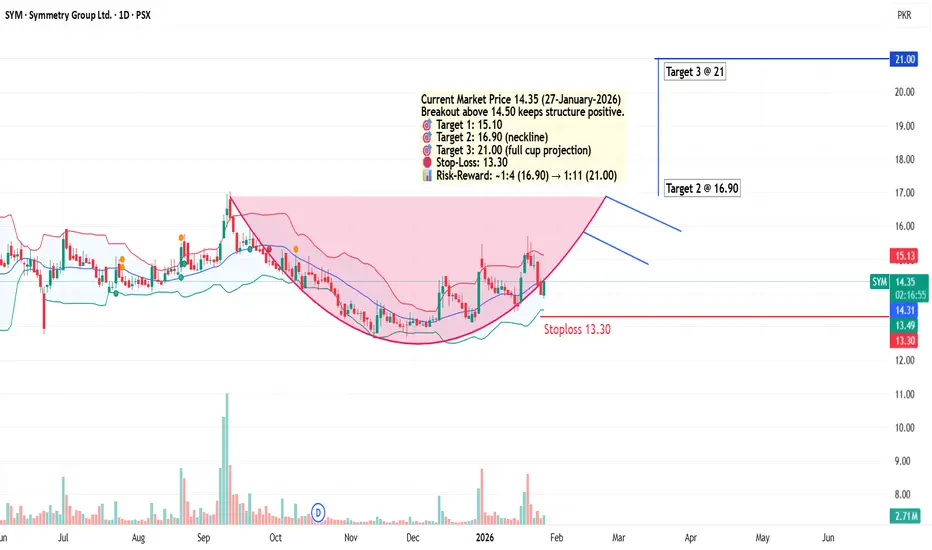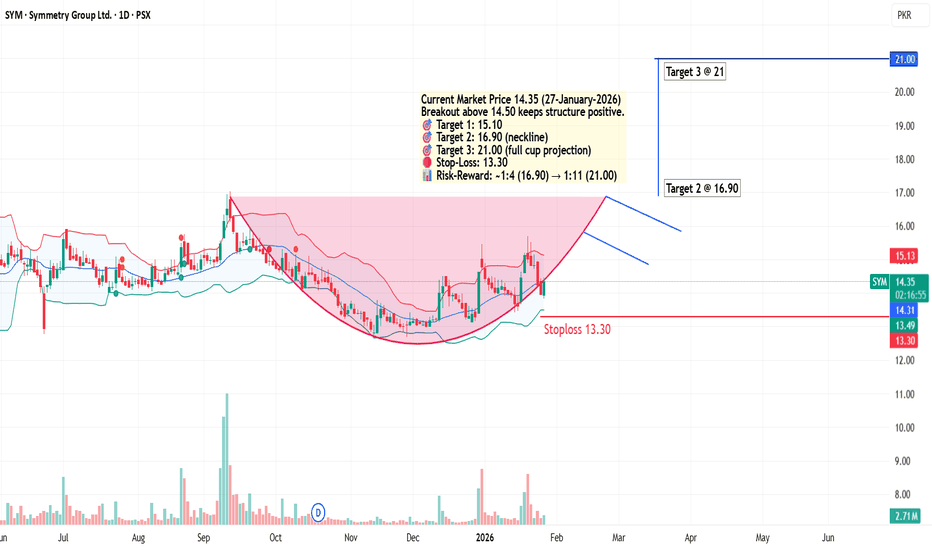
Cup and Handle formation in SYMMETRYPrice has formed a clear Cup & Handle structure, indicating accumulation followed by controlled consolidation. The pattern remains valid above 14.50, with resistance levels at 15.10, 16.90 (neckline), and 21.00 based on classical cup projection.
A daily close below 13.30 would invalidate the setup.
Cup And Handle
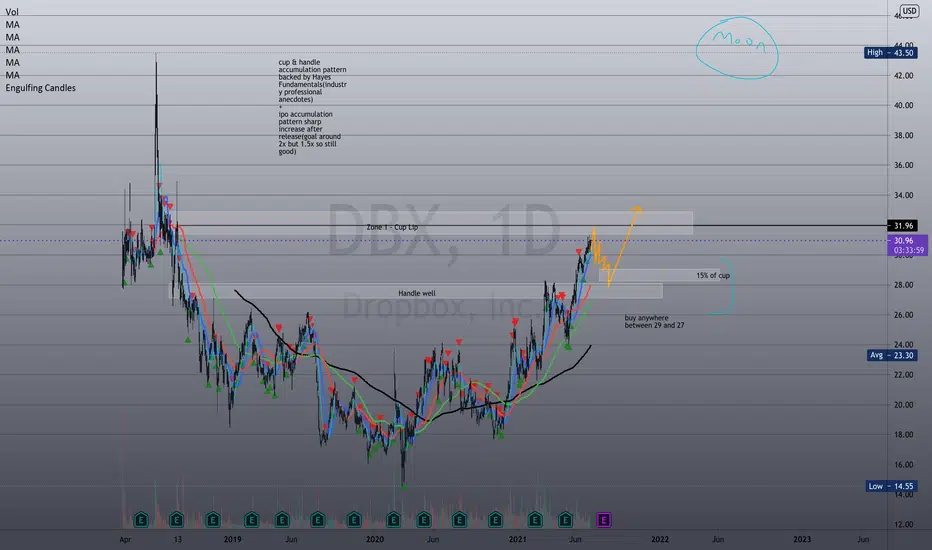
DBX LongDBX IPO ANALYSIS: Initial offering about $29 then shot up to $45 which shows interest, then the stock bottomed out at .5 its ipo price at about $14 and formed the base ofthe cup of a cup and handle pattern. since creating bottom dbx has shown consistent accumulation and a symmetrycal cup pattern. My estimate is that price is at or is nearing the lip of the cup and is about to form a handle. Aggressive Long positions should be looked for in the zones marked. Conservative entries should wait until the handle breaks the lip of the cup so watch out for that too.
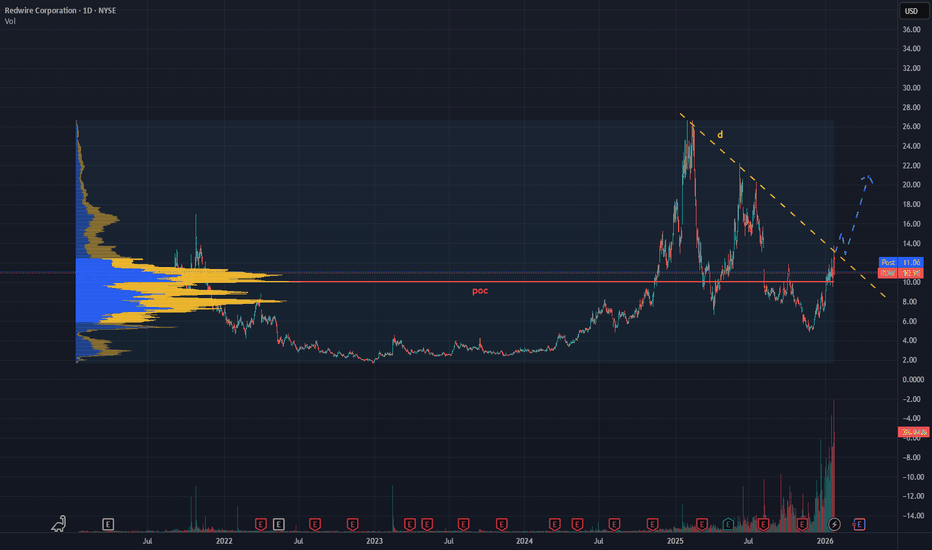
Technical Analysis – Redwire Corp (RDW)The stock RDW , which has been listed relatively recently, showed an interesting technical structure shortly after its IPO.
In the early trading phase, price action formed a classic Cup & Handle continuation pattern, later confirmed by a bullish breakout that led to a strong impulsive move, nearly doubling the price.
Market Structure
After setting a significant high, the stock entered a corrective phase, characterized by:
lower highs
lower lows
a short- to medium-term bearish market structure
From a volume and market profile perspective:
price is currently holding above the POC (Point of Control), a key level representing the area of highest traded volume
the stock is trading just below a descending daily trendline, acting as a dynamic resistance
Bullish Scenario
A long setup becomes technically valid only after a confirmed breakout above the daily descending trendline.
Key conditions:
clean breakout of the trendline
decreasing or controlled volume, suggesting supply absorption rather than emotional buying
potential retest of the broken trendline as dynamic support
⚠️ Trading Note
Until the bearish structure is broken, the stock remains in a corrective/consolidation phase.
A confirmed breakout would be the key signal to reassess bullish momentum and directional strength.
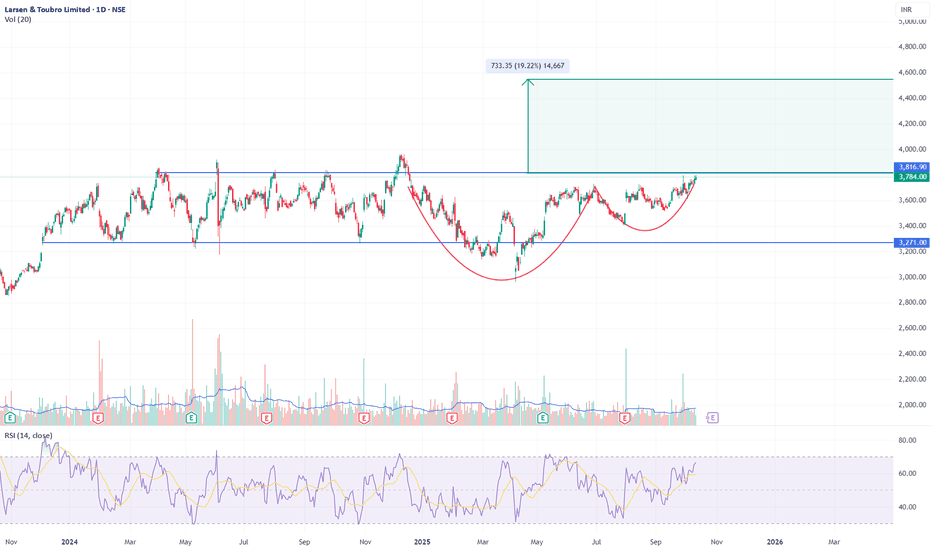
L&T - Cup and Handle Formation Near Breakout ZoneChart Structure:
Larsen & Toubro is forming a textbook Cup and Handle pattern that’s now testing its neckline around ₹3,780–₹3,800. The base extends nearly 10 months, creating a strong accumulation structure with a shallow handle - ideal for a breakout continuation.
Technical Highlights:
Cup Base: ₹2,950–₹3,000
Neckline: ₹3,780–₹3,800 (currently being tested)
Handle: Tight consolidation with declining volume, now showing early expansion
RSI: Rising towards 70, confirming strengthening momentum
Volume: Reaccumulation behavior - lighter on corrections, heavier on upswings
Trade Setup:
Breakout Confirmation: Close above ₹3,820 with strong volume
Target: ₹4,500–₹4,550 (≈19% upside from breakout)
Stop-Loss: ₹3,600 (below handle low)
Technical Verdict:
A sustained move above ₹3,820 would mark a major bullish continuation, potentially initiating a new leg in L&T’s long-term uptrend. Pattern reliability is high given the depth, duration, and structure of the base.
Disclaimer:
This analysis is for educational and informational purposes only and does not constitute investment advice or a recommendation to buy or sell any security. Markets involve risk, and past performance does not guarantee future results. Conduct your own due diligence or consult a qualified financial advisor before making investment decisions.
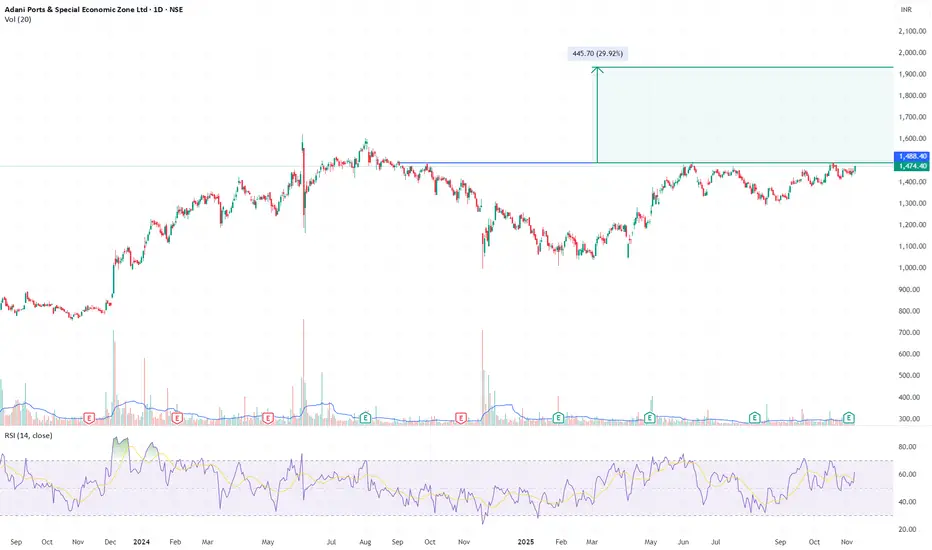
Adani Ports - 12/14 month base Breakout in ProgressAdani Ports is retesting the ₹1,485–₹1,500 zone after a 12–14-month rounding base between ₹1,050 and ₹1,500. A breakout could unlock a 30% upside potential toward ₹1,900 based on measured-move projection.
This pattern can be seen in multi timeframes (Daily and Weekly). RSI 60+;
Break below ₹1,365 on volume would negate the breakout setup.
Disclaimer:
Not financial advice. Educational analysis for charting reference only.
My upside targets for TESLAWe are finishing the 'handle' phase of a year-long setup of the Cup and handle.
All this taking place above the Brimline of the large cup and handle pattern.
We already identified The head and shoulders drop from 2021
The #HVF that took us to Target at $490 in December 2024.
We advised not to be sucked in to the doom and gloom.
during peak #Swastikar outrage and dealership vandalism.
If #TSLA clears $500 with volume, we aren't just looking at a new high—we are looking at a structural re-rating of this company.
🚀 Target 1: $503 (Short-Term Breakout)
The Logic: A high-volume break above the $490 resistance (post-robotaxi pop zone) would confirm the "handle" breakout.
Why it hits: Bullish momentum from year-end delivery updates and the Dovish Fed tone are currently providing the necessary liquidity.
🎯 Target 2: $600 (The "Ives" Consensus)
Widely considered the "mid-term" bull target for 2026, popularized by Wedbush analyst Dan Ives.
The Logic: This targets a roughly 100% gain from the projected 2026 lows.
The Catalyst: This hinges on the successful production start of the Cybercab in April 2026 and the initial commercialisation of the Optimus robot.
🏆 Target 3: $800 - $1,200 (The "AI Chapter" Re-Rating)
This target assumes Tesla is valued as an AI/Robotics powerhouse rather than a car company.
The Logic: Bullish algorithmic projections from sources like StockScan place #TSLA at $1,213 by the end of 2026 if Full Self-Driving (FSD) reaches mass adoption.
The Catalyst: Reaching a $2 Trillion to $3 Trillion market cap as the "AI Chapter" finally takes hold in the company's revenue mix.
🌌 Target 4: $2,000+ (The "ARK" Moonshot)
This is the long-term "blue-sky" target for 2027–2030, most famously championed by Cathie Wood's ARK Invest.
The Logic: Based on a $2,600 per share model, this target assumes the Robotaxi network reaches total global dominance.
The Catalyst: Tesla’s energy storage and software services segments must grow to become the dominant share of revenue, requiring net income to jump from ~$5 billion to $50 billion by 2030.
All these stages are backed by the projected moves of the #HVF @TheCryptoSniper and the two Cup and handle patterns.
GBP/CHF: Gap is Going to Be Filled!I spotted a nice gap down opening on 📈GBPCHF.
Following a significant downward trend, the pair is now showing a strong indications of bullish sentiment.
A bullish breakout from the neckline of a cup and handle pattern has been observed on the 4-hour timeframe, occurring after a test of daily support.
It suggests that the price is likely to increase and close the existing gap.
The target is set at 1.0731.
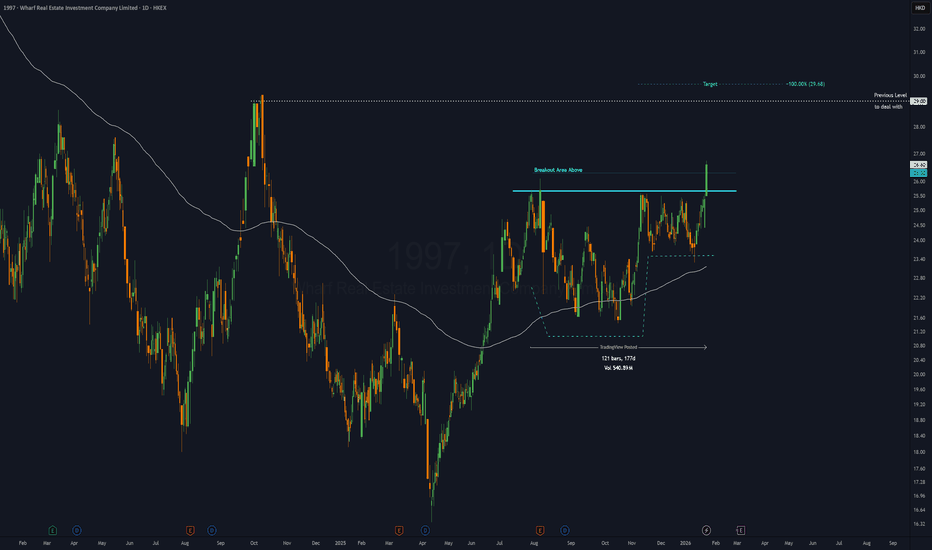
1997 - 6 months CUP & HANDLE══════════════════════════════
Since 2014, my markets approach is to spot
trading opportunities based solely on the
development of
CLASSICAL CHART PATTERNS
🤝Let’s learn and grow together 🤝
══════════════════════════════
Hello Traders ✌
After a careful consideration I came to the conclusion that:
- it is crucial to be quick in alerting you with all the opportunities I spot and often I don't post a good pattern because I don't have the opportunity to write down a proper didactical comment;
- since my parameters to identify a Classical Pattern and its scenario are very well defined, many of my comments were and would be redundant;
- the information that I think is important is very simple and can easily be understood just by looking at charts;
For these reasons and hoping to give you a better help, I decided to write comments only when something very specific or interesting shows up, otherwise all the information is shown on the chart.
Thank you all for your support
🔎🔎🔎 ALWAYS REMEMBER
"A pattern IS NOT a Pattern until the breakout is completed. Before that moment it is just a bunch of colorful candlesticks on a chart of your watchlist"
═════════════════════════════
⚠ DISCLAIMER ⚠
The content is The Art Of Charting's personal opinion and it is posted purely for educational purpose and therefore it must not be taken as a direct or indirect investing recommendations or advices. Any action taken upon these information is at your own risk.
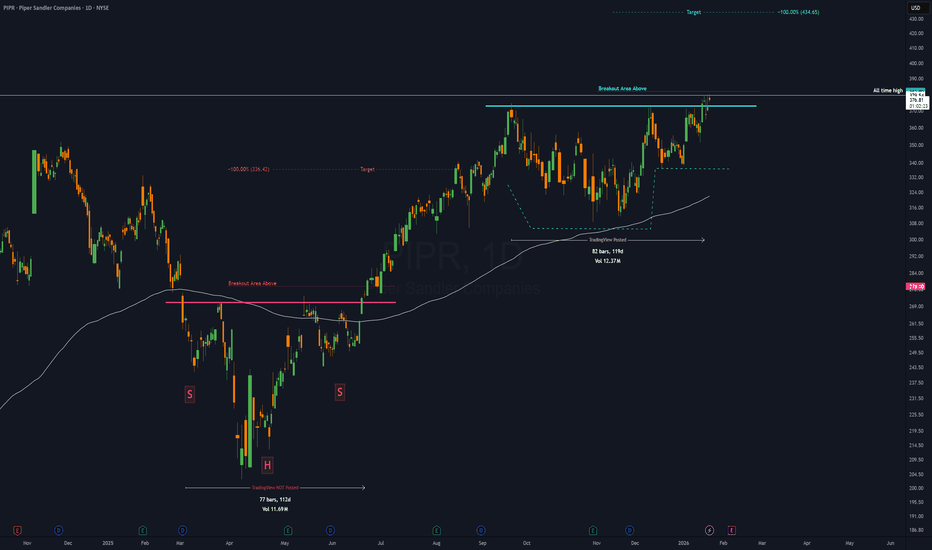
PIPR - 4 months CUP & HANDLE══════════════════════════════
Since 2014, my markets approach is to spot
trading opportunities based solely on the
development of
CLASSICAL CHART PATTERNS
🤝Let’s learn and grow together 🤝
══════════════════════════════
Hello Traders ✌
After a careful consideration I came to the conclusion that:
- it is crucial to be quick in alerting you with all the opportunities I spot and often I don't post a good pattern because I don't have the opportunity to write down a proper didactical comment;
- since my parameters to identify a Classical Pattern and its scenario are very well defined, many of my comments were and would be redundant;
- the information that I think is important is very simple and can easily be understood just by looking at charts;
For these reasons and hoping to give you a better help, I decided to write comments only when something very specific or interesting shows up, otherwise all the information is shown on the chart.
Thank you all for your support
🔎🔎🔎 ALWAYS REMEMBER
"A pattern IS NOT a Pattern until the breakout is completed. Before that moment it is just a bunch of colorful candlesticks on a chart of your watchlist"
═════════════════════════════
⚠ DISCLAIMER ⚠
The content is The Art Of Charting's personal opinion and it is posted purely for educational purpose and therefore it must not be taken as a direct or indirect investing recommendations or advices. Any action taken upon these information is at your own risk.
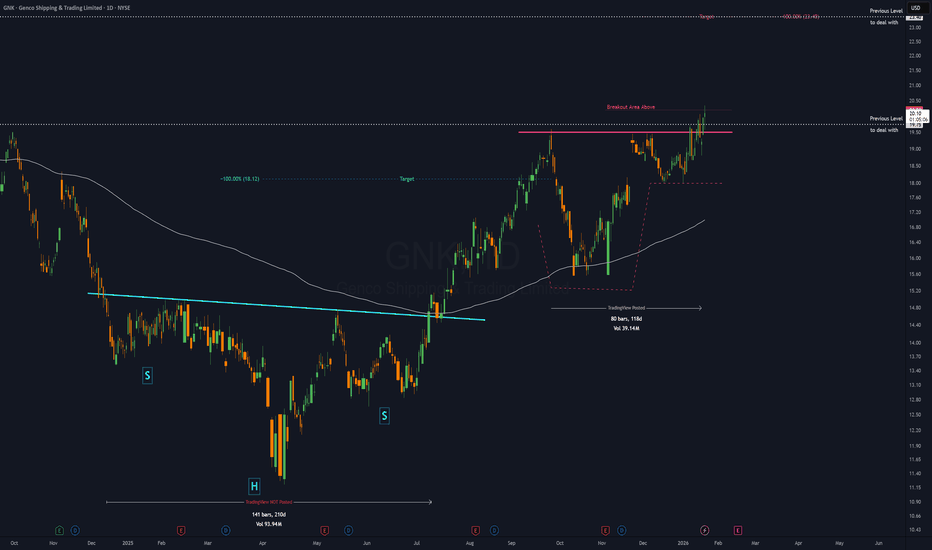
GNK - 4 months CUP & HANDLE══════════════════════════════
Since 2014, my markets approach is to spot
trading opportunities based solely on the
development of
CLASSICAL CHART PATTERNS
🤝Let’s learn and grow together 🤝
══════════════════════════════
Hello Traders ✌
After a careful consideration I came to the conclusion that:
- it is crucial to be quick in alerting you with all the opportunities I spot and often I don't post a good pattern because I don't have the opportunity to write down a proper didactical comment;
- since my parameters to identify a Classical Pattern and its scenario are very well defined, many of my comments were and would be redundant;
- the information that I think is important is very simple and can easily be understood just by looking at charts;
For these reasons and hoping to give you a better help, I decided to write comments only when something very specific or interesting shows up, otherwise all the information is shown on the chart.
Thank you all for your support
🔎🔎🔎 ALWAYS REMEMBER
"A pattern IS NOT a Pattern until the breakout is completed. Before that moment it is just a bunch of colorful candlesticks on a chart of your watchlist"
═════════════════════════════
⚠ DISCLAIMER ⚠
The content is The Art Of Charting's personal opinion and it is posted purely for educational purpose and therefore it must not be taken as a direct or indirect investing recommendations or advices. Any action taken upon these information is at your own risk.
TSLA 1D — Ascending triangle + possible Cup & Handle
Tesla (TSLA) just hit support line and bounced on it with good volume, making it an interesting point to buy, its next major resistance is at 488.
if at 488 we will have a clean break that could potentially be a cup and handle formation with potential to 755 (54% upside)
$NB: The 'Niobium' King is Finally Breaking Groundand breaking resistance levels for a Cup and Handle that points to double figures.
🔥 Why the "Nobium" Story is Serious (Bulls)
Uncle Sam’s Support: NioCorp just finished a "Department of War-funded" drilling campaign (results were solid) and has a pending debt application with the EXIM Bank.
Strategic Moat: Brazil currently controls over 88% of global niobium. NioCorp is positioned as the "Security Choice" for U.S. defense and EV tech.
The Tech Play: Niobium is critical for HSLA steel (lighter, stronger cars) and next-gen batteries that charge in minutes.
⚠️ The Risks (Keeping it Real)
Pre-Revenue Stress: They are still burning cash (net loss of ~$0.8M last quarter) and need to finalize a massive financing package to actually finish the mine.
Volatility: It’s a "Single Project" company. Everything hinges on Elk Creek.
Everyone is laughing at the 'NOBium' puns until the NASDAQ:NB breakout hits. 🚀
With Board Approval for the mine portal and work starting this quarter, we are moving from 'exploration' to 'execution'.
The U.S. government is literally funding their drilling because we need this stuff for fighter jets and EVs.
The Play: Long on the break of $7.00. The Goal: $11.00+ as EXIM financing news drops.
Stay radiant.
⚛️
#NB #Niobium #CriticalMinerals #MiningStocks #TurnaroundStory
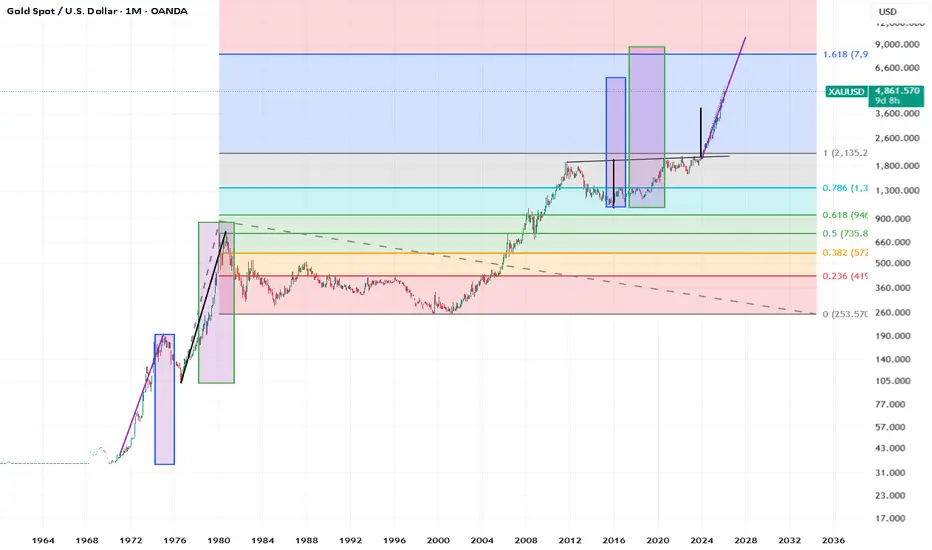
Gold is accelerating at same rate as prior cycles big picture Bullish Gold
how far will gold move to? this shows it could go over 8k?
Yes there are big round numbers out there
But if it scales like last time maybe we get another chance to add soon
Then wheres the top Elliot 5th wave top ?
Have a look at the boxes to give you some perspective how far gold could travel and still be in the same remit similar to what it did in the past.
Same works for Silver
Long term 15k or even 25k looks like big real numbers but first its got to do 5k and 10k
Chart needs cleaning up for exact numbers just was drawn fast to look at big picture to see how far the gold and silver miners could keep running for as they lag.
How many gold and silver miners were in the top 100 companies or top 10 last time around? and look to see if a similar amount are there again. As a relative comparison I guess would be sensible Using fib exertion tool on the monthly often you see price reach one of the key fib numbers and then inflect and gold likes Fib numbers historically.
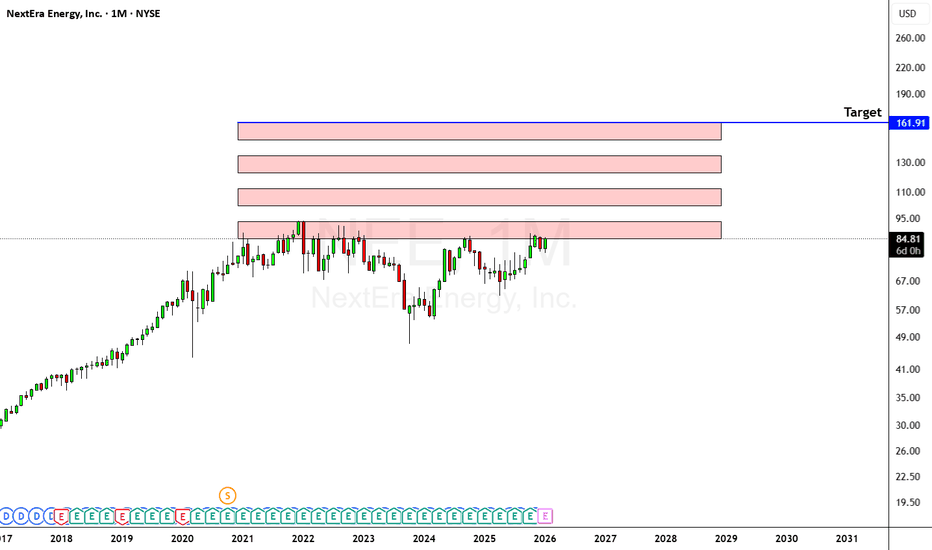
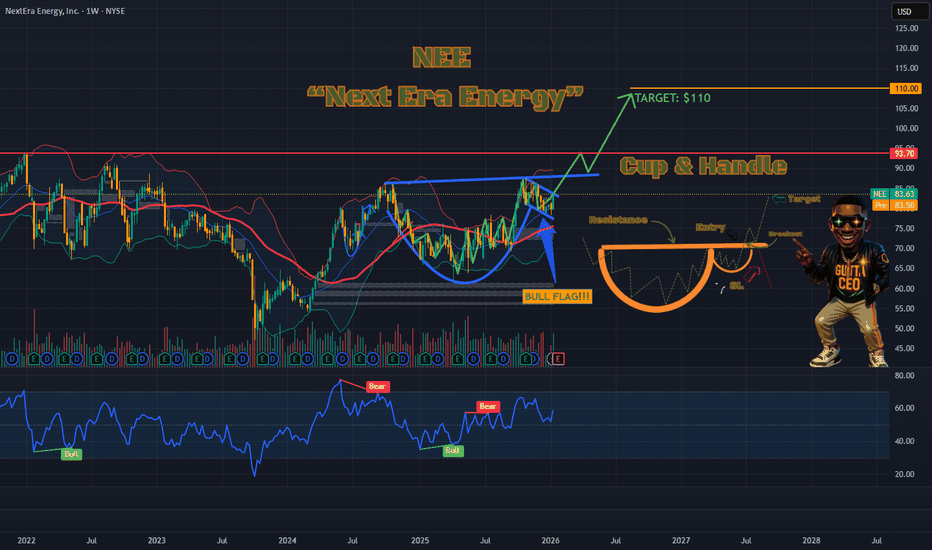
NEE Cup & Handle on Weekly + Bull Flag on Daily: Breakout Setup NextEra Energy ( NYSE:NEE ) is lining up a high-probability bullish combo:
Weekly timeframe: Classic Cup and Handle forming over a year....beginning at the 2024 highs and rounded cup base from mid-2025 lows (~$65-70), followed by a tight handle consolidation. Price is currently in the handle, coiling right below key resistance ~$87 (recent highs / prior breakout level).
Daily timeframe: Overlay Bull Flag pattern emerging — sharp impulse up, followed by a downward-sloping flag channel with contracting volume.
Breakout trigger: Decisive close above $87 on volume — classic continuation signal in this clean energy powerhouse.
Measured move targets:
Initial: $93–$100 (ATH zone)
Extended: $110–$120+ (adding full cup depth to breakout)
Support to watch: $78–$80 (flag lower boundary / recent base).
AI/data-center power demand tailwinds + renewables exposure make this a strong thematic play. A breakk of $87 and a Pullback to $85-$86 could be ideal entry if it holds.
Bullish bias — eyes on that $87 break! Who's positioned? Share stops/targets below! 📈 #NEE #CupAndHandle #BullFlag #Breakout #TechnicalAnalysis #TradingView
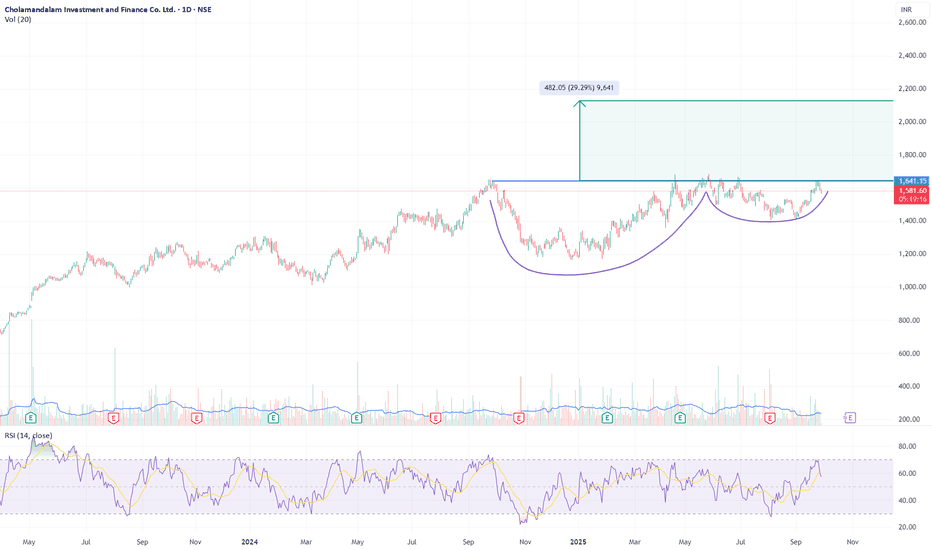
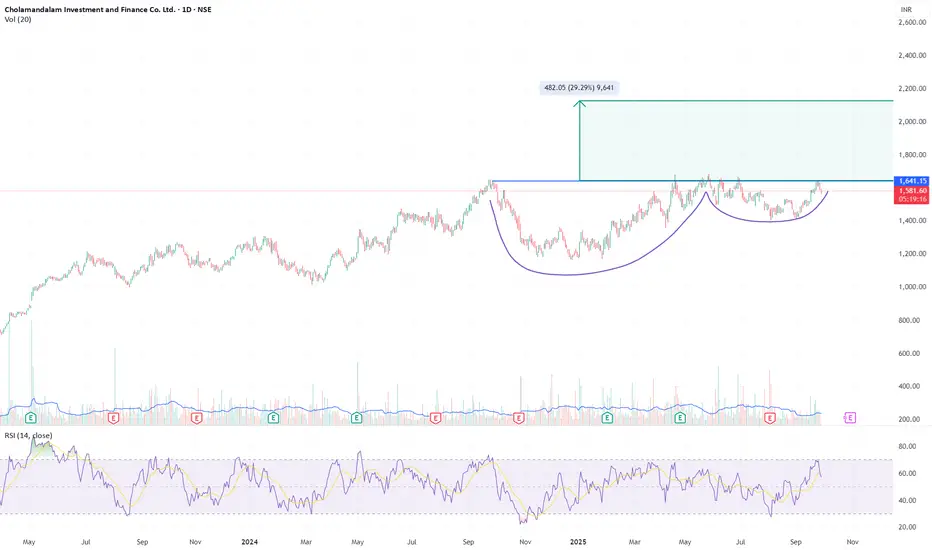
CHOLAFIN – Cup & Handle Reformation | Setup in ProgressCHOLAFIN is re-forming a higher timeframe Cup & Handle pattern after a failed breakout attempt in July. The broader base now spans from late 2024, showing improved symmetry and structural maturity. This is a classic example of a breakout setup resetting through time.
Pattern Details
Pattern: Cup & Handle (reformed)
Neckline / Breakout Level: ₹1641.15
Current Price: ₹1581.10
Target (if breakout holds): ₹1641 + ₹482 = ₹2123
Upside Potential: ~29%
Volume: Needs breakout-day confirmation (>2x 20-day avg)
RSI: 57.2 – healthy, approaching 60
Setup Bias
Not a buy yet — structure is constructive but needs confirmation
Watch for daily/weekly close above ₹1645 with volume support
Prior failure adds caution, but also strengthens credibility on second attempt
Disclaimer
This post is for educational and informational purposes only . It is not a recommendation to buy, sell, or hold any securities. Technical chart patterns involve inherent risk and are not guarantees of future performance. Traders must use their own discretion, manage risk appropriately, and consult with a SEBI-registered financial advisor if needed.
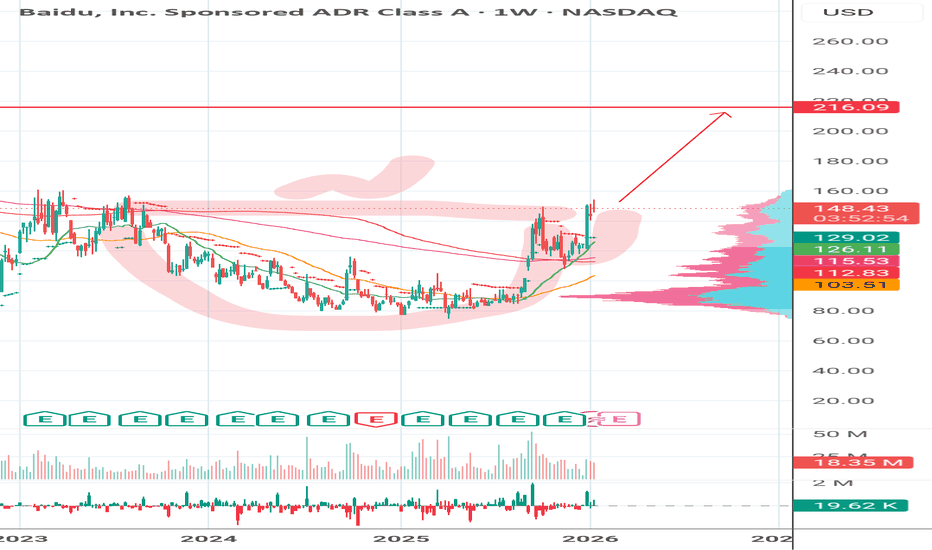
$BIDU. Cup and handle pattern.BIDU shows a technically justified bullish setup: after a prolonged downtrend, price has formed a rounded base with higher lows, reclaimed and held above key moving averages, and broken out of a high-volume accumulation zone, signaling a clear shift in market control from sellers to buyers; the breakout is supported by expanding volume and strong acceptance above value, while overhead supply is relatively thin until much higher levels, creating a favorable risk-to-reward profile and opening room for continuation toward the prior distribution area around the 200+ zone.
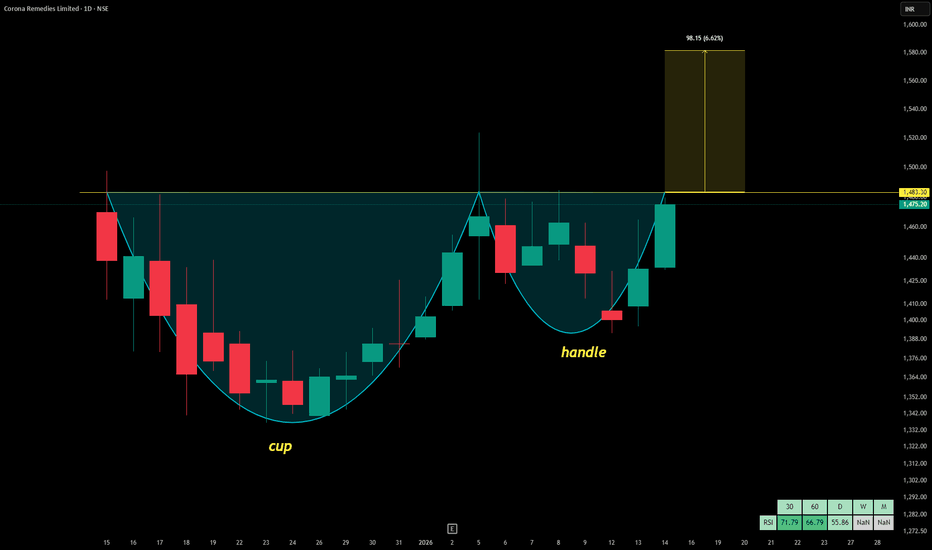
CORONA REMEDIESCorona Remedies Ltd. (CMP ₹1475) is a mid‑cap pharma company incorporated in 1996. It manufactures and markets branded formulations across multiple therapeutic areas, with a strong presence in cardiology, diabetology, dermatology, gynecology, and critical care segments.
Promoter: The company is promoted by the founding family of Corona Remedies, who have built the business into a recognized specialty pharma player in India.
FY22–FY25 Snapshot
Sales – ₹890 Cr → ₹1,014 Cr → ₹1,196 Cr
Net Profit – ₹72 Cr → ₹90.5 Cr → ₹149.4 Cr
Operating Performance – Moderate → Strong → Very Strong
Dividend Yield – 0.6% → 0.8% → 1.0%
Equity Capital – ₹61.16 Cr (constant)
Total Debt – ₹126 Cr → ₹84 Cr → ₹16 Cr (sharp deleveraging)
Fixed Assets – ₹541 Cr → ₹591 Cr → ₹620 Cr
EPS – ₹11.8 → ₹14.8 → ₹24.4
Institutional Interest & Ownership Trends
Promoter holding is ~70%, reflecting strong family control and governance. FIIs and DIIs have begun to take exposure as the company scales, though institutional interest remains modest compared to larger pharma peers. Public float is ~30%, with delivery volumes showing accumulation by long‑term investors.
Strategic Moves & Innovations
Focus on specialty therapies (cardio, diabetes, dermatology).
Expansion into critical care and gynecology segments.
Investment in R&D and backward integration for cost efficiency.
Increasing presence in exports and institutional sales.
Cash Flow & Balance Sheet Strength
Operating cash flows have strengthened in FY25, supported by margin expansion. Free cash flow is positive, with reinvestment into R&D and manufacturing capacity. Debt has been reduced sharply, improving balance sheet resilience.
Risk Factors
Dependence on branded formulations in competitive therapy areas.
Regulatory risks in pharma pricing and compliance.
Margin sensitivity to raw material costs and supply chain disruptions.
Investor Takeaway
Corona Remedies Ltd. demonstrates strong fundamentals with revenue growth, margin expansion, and sharp deleveraging.