Bitcoin is ready to reach a new all time high! (Buy now)Bitcoin finally revealed its direction and its bullish. On the chart we can see 2 parallel channels. The first one is currently breaking out and there is no doubt that the second parallel channel will break as well. Next resistance is exactly at the top of the first parallel channel, I am expecting a pullback from this strong dynamic line.
From the Elliott Wave perspective, the WXYXZ corrective pattern is now confirmed, so this is also a very bullish sign for the next weeks and months! On the 1
Fibonacci Extension
3 Best Fibonacci Tools For Forex Trading
Hey traders,
In this article, we will discuss 3 classic Fibonacci tools you must know for trading different financial markets.
1️⃣ Fibonacci Retracement
Fib.Retracement is my favorite fib.tool. It is aimed to identify strong horizontal support and resistance levels within the impulse leg .
We draw this tool based on the high and low of the impulse (from wick to wick) and it shows us POTENTIALLY strong structure levels determined by Fibonacci numbers .
Common Fib.Retra
#Bitcoin [ Inverted Head And Shoulders - Short Squeeze Combo ] BTCUSD has printed an allbeit slanted yet very nice inverted head and shoulders that has retested and played out perfectly so far. The measured move coincides with multiple high time frame short liquidation levels (Not marked on this chart) with the biggest level being a 6 MONTH high volume liquidation level at $74,045. This strong of a #shortsqueeze could easily amplify the measured move, which I have extended, using the 150%-161.8% fib levels. The extension also lines right up with where all s
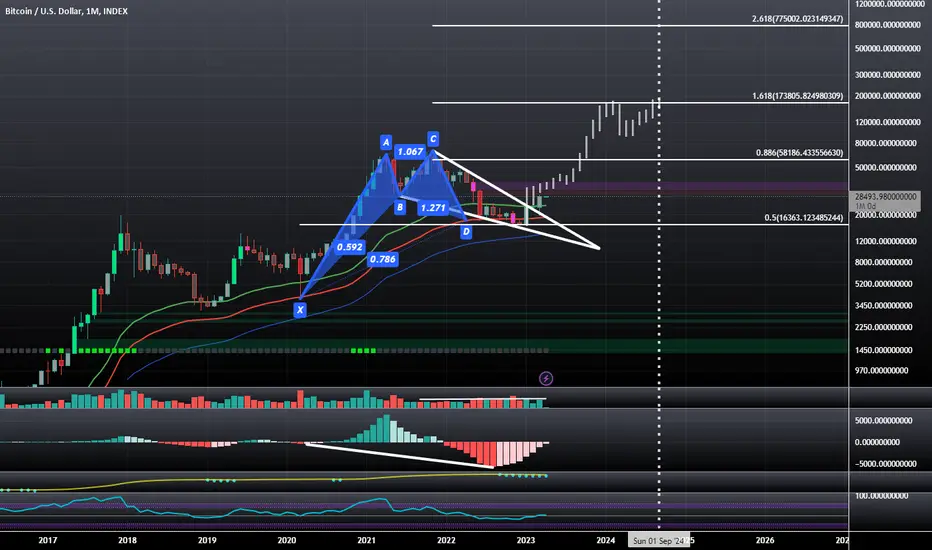
BTCUSD: Monthly BHG Confirmed; Now Targeting $146,000 - $174,000Bitcoin after bouncing from a Bullish Cypher PCZ and Breaking out of a Falling Wedge has back tested the wedge as support and has closed bullishly above the backtest and now we have a confirmed Break-Hook-and-Go on the monthly timeframe as well as Hidden Bullish Divergence on the MACD. If this is truly the bottom then I would think Bitcoin is likely to complete an AB=CD BAMM that will take it to a 1.618 Fibonacci Extension which sits at $173,805
GOLD - Buy after this pullback!Gold is extremely bullish and is expected to double its value in the next few years. We want to take advantage of this bull market and implement long-only strategies on futures. Right now, GOLD is breaking out of the descending channel, but I want to see a retest of it. The price broke out of this channel but created a fair value GAP. These GAPs tend to be filled sooner or later, so do not FOMO in and wait for a proper retest. Then we can open a leveraged trade with a high probability of success
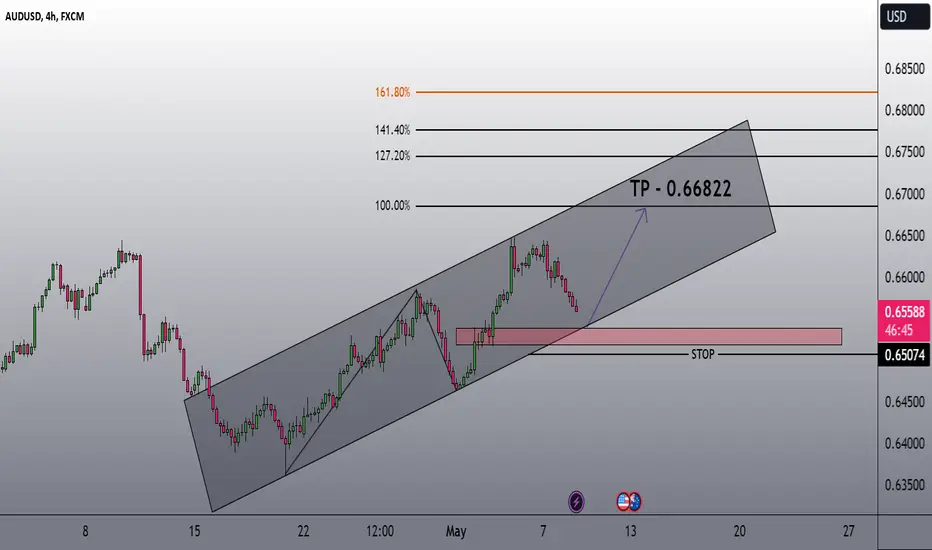
AUD-USD | 4H | TECHNICAL CHARTHello traders, FX:AUDUSD I have determined the formation target on the chart. I wish everyone success.
Like and comment if you find value in our analysis.
Feel free to post your ideas and questions at the comments section.
Thank you for considering my analysis and perspective.
Good luck
52,838 and 06 cents: BTC most likely Retrace Target almost hereUpdate to my ongoing analysis of this bull run.
Correction proceeding exactly per plans.
We are nearing some key levels to watch.
The bottom should be pretty close to here.
$ 56,265 - 56,799 is the minimum expected.
$ 52,838 - 53,659 is best Guess and Ideal target.
$ 48,090 - 48,750 is the Overshoot (backboard).
.
Previous plots and logic that lead us here (click the links):
- 73k Top Call no one expected
- Retrace Roadmap of Support zones
- 52.8k imagined but not believed
- Impulse
USDJPY🗝️ LEVELS TO WATCH👀 AND WHY 🤔
Hello Awesome Traders!
I trust you had a rejuvenating weekend and are geared up for the exciting trading opportunities the new week has in store. Let's dive right into USDJPY, where a compelling setup awaits our attention.
USDJPY has formed an ascending triangle pattern on its weekly chart, signaling a potential bullish move. The recent breakout above the resistance level at 151.944 marks a significant development, offering traders an opportunity to capitalize on the upward momentum.
While
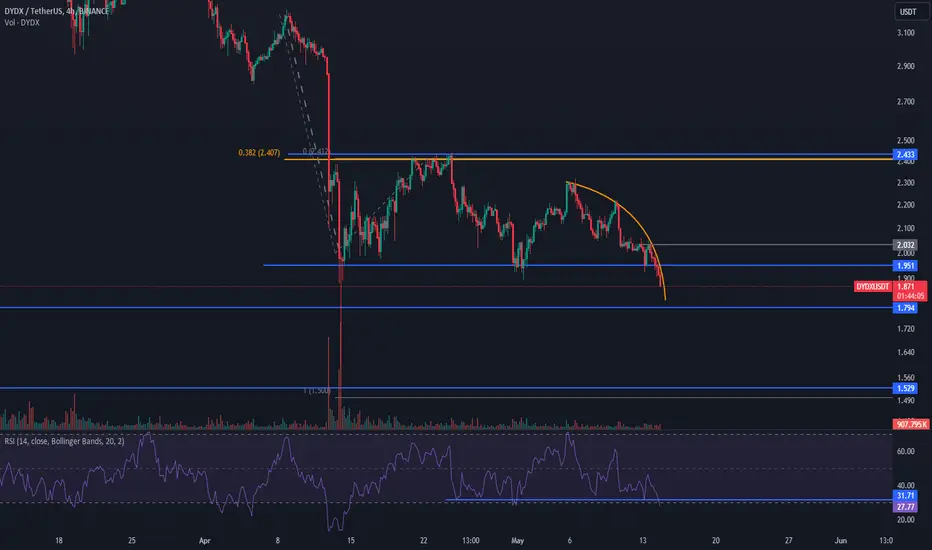
📈Strategic Insights on DYDX Movements🔔🔍Yesterday, Bitcoin was rejected at the 63,200 resistance level and remains within its trading box, potentially heading towards the bottom. As Bitcoin dominance continues to rise, altcoins have suffered more, with many breaking through their support levels and continuing to decline. One such altcoin is DYDX, a DeFi token that allows users to open long or short futures positions with leverage in a decentralized environment. This appeals to those concerned about the security of their assets and wh
Bitcoin is ready to reach 70k! Here is why.Bitcoin has finished its corrective pattern (ABC ZigZag) and is ready to go higher. My next target is 70k (69577) because we have a 1:1 FIB extension level at this price. Usually this Fibo level is pretty significant; that's why I am expecting a small crash from it, but after that, we should continue much higher, to the 1.618 FIB extension. Of course, we need more information and data to precisely establish long-term targets.
On the chart, we can see 2 parallel channels, the first is larger th
INJ, when next pump? Be carefulThe price of INJ is at the top of the parallel channel on the weekly chart. This is probably not the best time to buy INJ, I would wait a for a small pullback. Rather buy INJ in March / April and buy some other coins because INJ is going to go sideways. From the Elliott Wave perspective, we are waiting for the final wave (5). We are in wave (4). Let me know what you think about my analysis, and please hit boost and follow for more ideas. Thank you, and I wish you successful trades!
Injectvie L
DUSK can make a 2800% profit in 2024, buy now?First technical analysis. DUSK looks absolutely great! We have a pretty long bullish accumulation of whales, which you can see in the rectangular pattern. Usually, whales need to accumulate a lot of coins / contracts before they send a coin to the moon. What is positive is the Elliott Wave outlook. My EW count suggests that the WXYXZ complex correction has been completed together with the leading diagonal pattern. This is a strong bullish combination. Where to take profit? 1:1 Fibonacci extensio
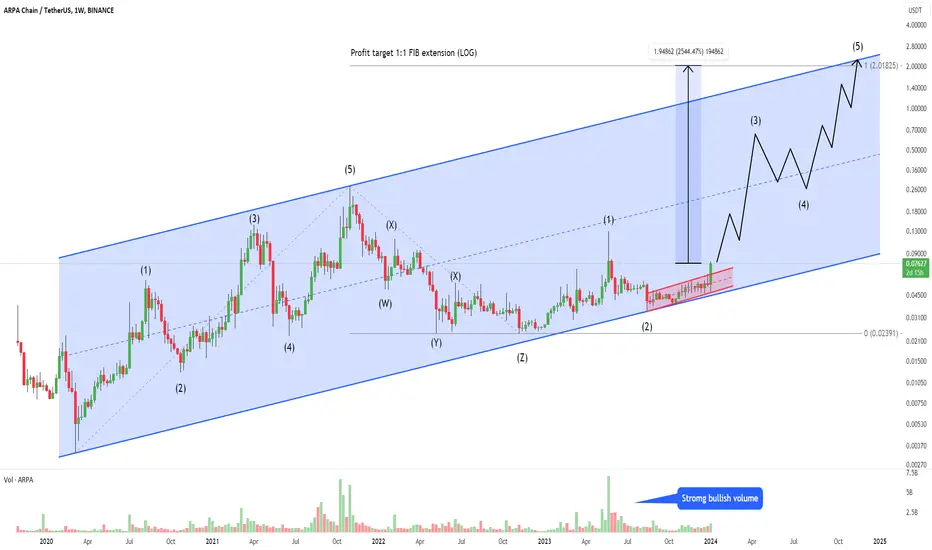
ARPA is starting a new uptrend. This is going to be hugeARPA is looking really good on the major timeframe. We have a breakout of the local small parallel channel and the volume last year was pretty strong. 25x is possible on this coin in 2024. Take profit at the top of the parallel channel or 1:1 FIB extension (LOG). It looks like the pump is starting, so it is time to buy if you are interested in this coin. Let me know what you think about my analysis, and please hit boost and follow for more ideas. Thank you, and I wish you successful trades!
ARP
CHZ will 50x in 2024/2025! Buy now.Technical analysis
CHZ is breaking out of the descending parallel channel after an incredible 1085 days! This is a huge event for this coin, and of course, I am expecting a massive pump in the near future. The pump is starting right now, so I recommend buying this coin right now. From the Elliott Wave perspective, we have completed a WXYXZ correction inside this channel, which is always good to see! This coin can 50x in the upcoming months.
Let me know what you think about my analysis, and pl
SUPER: 5800% profit in 2024/2025Technical analysis
SUPER is pumping hard; there is no doubt about it, and the trend should continue in the next few weeks and months! I recommend buying SUPER right now for a 50x profit in 2024/2025. We can see that the downtrend has ended with a descending parallel channel, and bullish volume is very high, which is always good to see! From the Elliott Wave perspective, we have completed a triple-three corrective pattern (WXYXZ), and we are in a new impulse wave.
Let me know what you think a
GOLD - New all-time-high soon! (Buy now)Gold looks extremely bullish in the short-term and also in the long-term. 5000 USD or 10000 USSD in the next few years is definitely very likely, but right now let's focus on the short-term price action.
We can see that GOLD is in a strong uptrend, and we can use a simple trendline tool to measure its strength. The price respects the blue trendline pretty accurately, and the uptrend is valid as long as this trendline holds. Of course, nothing lasts forever, and to be bearish, we need to wait fo
EURUSD | MT Long H4 |Overly OversoldPair: FX:EURUSD
Timeframe: H4 - Medium Term (MT)
Direction: Long
Technical Confluences for Trade:
- Stochastics are in Oversold Conditions on D1, H4 and H1 time-frames
- Price action has some support trend-line holding it
- Horizontal trendline looks like a demand zone across the years
- Horizontal trendline (Red) is at the 1% Fib Extension Level
- Aiming for the 32.8% Fibo Retracement with 23.6% as the TP 1 level
Fundamental Confluences for Trade:
- EUR weakness has been mostly be
BTC: Two potential target prices
- Two critical support zones correspond with the 0.382 and 0.618 Fibonacci retracement levels of the entire swing from A to B, enhancing the significance of these support levels.
- After two months of ranging, the price finally broke below the critical support zone as volume spiked, confirming the breakout and leading to a significant drop.
- If the price does not return above the first support zone , two potential target prices can be anticipated:
1. A 100% extension of the large purple
Bitcoin - Crash to 57k, then 100k! (must see)The price of Bitcoin is preparing for a final drop to the downside, to 57k per my calculations! The price is still inside this bullish flag formation, and we still need to complete the ABC corrective pattern from the Elliott Wave perspective. At this point, I cannot be bullish at all, just be patient and wait for 57k to be hit before buying BTC!
It's also important to take a look at the long term trendline (October 2023 -> January 2024). We have 2 touches, and the 3rd touch is inevitable soone
BTC-USDT | 4H | TECHNICAL CHARTHello traders, Bitcoin has made its first 5 waves, now it's time for the abc waves. This is the exact move I'm expecting in Bitcoin, traders.
PS: Thank you very much that you support me with your likes and Comments
If you have another analysis at this pair, please share in comments, I will be glad to discuss with you.
Thank you for considering my analysis and perspective.
📈Potential Short Opportunity in FTM: Technical Analysis🔥🔍In today's analysis, we observe a continuation of yesterday's market movement, characterized by a minor downward trend. Yesterday's correctionary movement, as discussed in our previous analysis, has extended into the London time frame today. This movement has nullified all corrections suggested yesterday, indicating the potential for a second wave of decline in altcoins, notably in FTM/USD.
⚡️Our focus today is on positioning for a short trade in FTM/USD, leveraging a strong trigger point at $
FShort
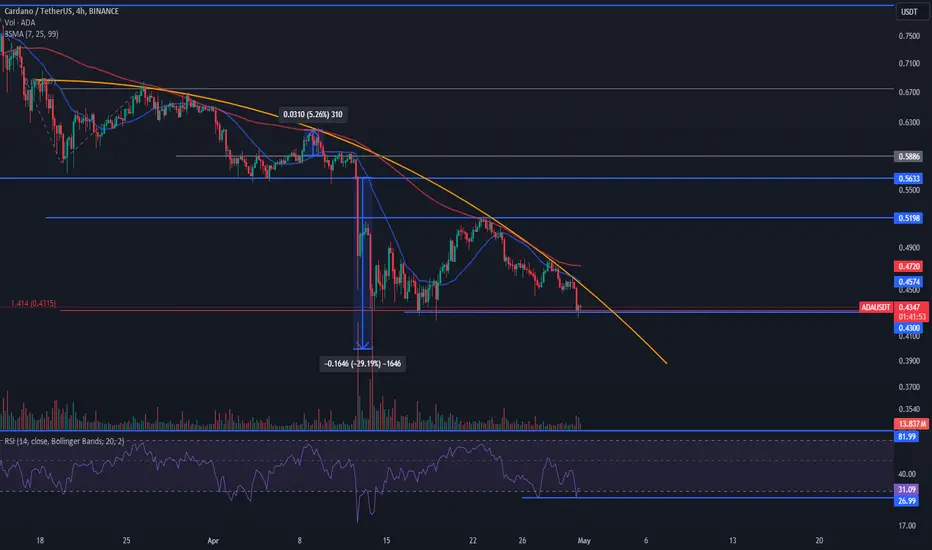
📈ADA Market Analysis: Navigating the Current Trends🎯🔍et's embark on our daily market analysis journey. The market witnessed another minor downturn recently. Bitcoin's dominant bullish candles may have overshadowed, causing altcoins like ADA to experience further decline. Among these altcoins, ADA, which we previously analyzed, remains under our scrutiny.
🔄First and foremost, let's review the trading triggers provided in the previous analysis. For long positions, as previously mentioned, a breakout and consolidation above $0.5886 could have initi
Bajaj Hindustan - On Sugar Rush :)Bajaj Hindustan Sugars is in Super Bullish Mode off late. Let's compare the Weekly Vs Quarterly pattern below
On Weekly:
1. Price is about to BO of Rounding Bottom Pattern above 40.5 for Target of 54
2. Fibonacci 0.618 retracement for Targets of 42, 50
On Monthly:
1. Inv Head and Shoulder BO confirmed on Monthly for Target of 54 (which is matching the Rounding Bottom BO on Weekly)
2. Larger Rounding Bottom BO pending above 40.5 for Target of 78
Disclaimer:
3+ Years Teaching Experience in
MATIC.usd stuck between the proverbial Rock and Hard PlaceMATIC currently range bound by major fibs.
Break in either direction should pop violently.
Golden fib above is stronger than blue support.
=========================================
M