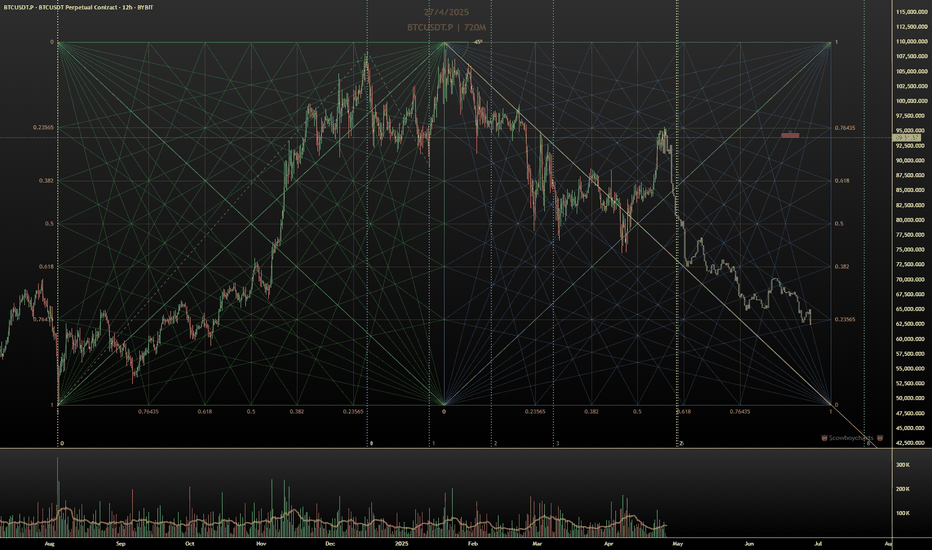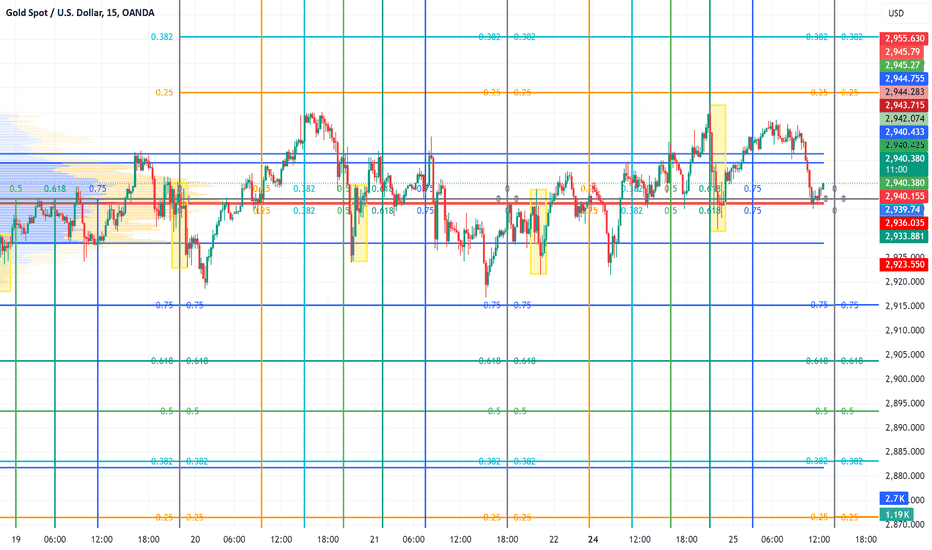
Gann Box
BIT500: Prediction Markets — From Polymarket to InfoFiIn the dynamic crypto landscape of September 2025, prediction markets are evolving into powerful tools for aggregating information and speculation. Polymarket is experiencing explosive growth, with trading volume up 50% month-over-month, reaching $1.16 billion in June and $7.5 billion for the year. This reflects a shift from simple betting to InfoFi—"information finance," where markets not only forecast events but also generate valuable analytics. From BIT500, a leading analytics platform focuse
MEV Bot Exploit by MIT-Educated Brothers Leads to $25M CryptoIn the dynamic world of crypto trading, where cutting-edge innovation meets finance, abuses are inevitable. One of the most prominent cases of the year involves brothers Anton and James Peraire-Bueno, MIT graduates accused of exploiting Maximal Extractable Value (MEV) strategies to siphon off $25 million from the Ethereum ecosystem within seconds. The case may set a precedent for how automated behavior in decentralized systems is judged under traditional legal frameworks.
What Happened?
Accordi
E
EUR/USD CRAZZYY BULLISH BIAS (SMC Perspective) | 1H Outlook🔍 Analysis Summary:
Price is consolidating above a clear demand zone after breaking previous structure to the upside.
We’ve seen liquidity engineered above the swing high (marked X), followed by internal structure developing.
I’m watching for a sweep into demand (grey zone) between 1.1520 – 1.1540, followed by a bullish reaction.
Expecting a bullish BOS (Break of Structure) on the lower timeframe to confirm continuation to 1.16340.
📌 Key Levels:
Demand Zone: 1.1520 – 1.1540
Liquidity Sweep:
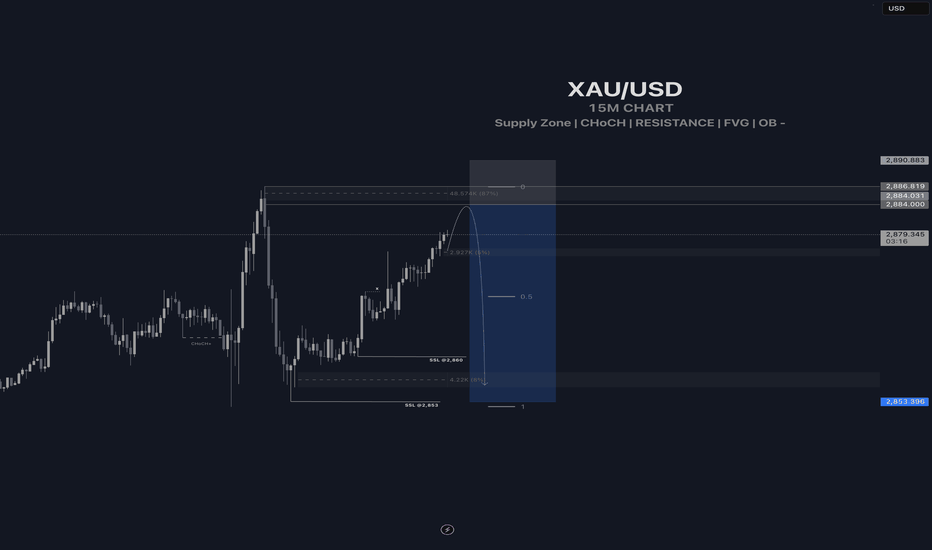
Gold (XAUUSD) Trading Setup – Mid-June 2025 Analysis🔰 Gold (XAUUSD) Trading Setup – Mid-June 2025 Analysis
This chart represents a strategic price action-based setup on Gold (CFDs on Gold – US$/Oz) using a 15-minute timeframe. It includes clearly defined entry zone, support/resistance levels, and profit-taking targets (TP1, TP2) for both bullish and bearish scenarios.
🔍 Current Market Context
Current Price: ~$3431.77
Structure: The price has been in an upward trend with a consolidation phase forming near the key mid-zone.
Highlighted Zone: A
How Gann’s Square of 9 Reveals Hidden Time Cycles in the US500In today’s fast-moving markets, most traders are stuck reacting, chasing signals, hunting for breakouts, and trying to make sense of noise. But what if you could predict where the market might turn, not just based on price, but on time itself?
That’s exactly what W.D. Gann mastered. His tools, like the Square of 9, weren’t just about charts, they were about timing the rhythm of the market. Today, I’ll walk you through a real-world example on the US500, using Gann’s time technique on the 5-minut
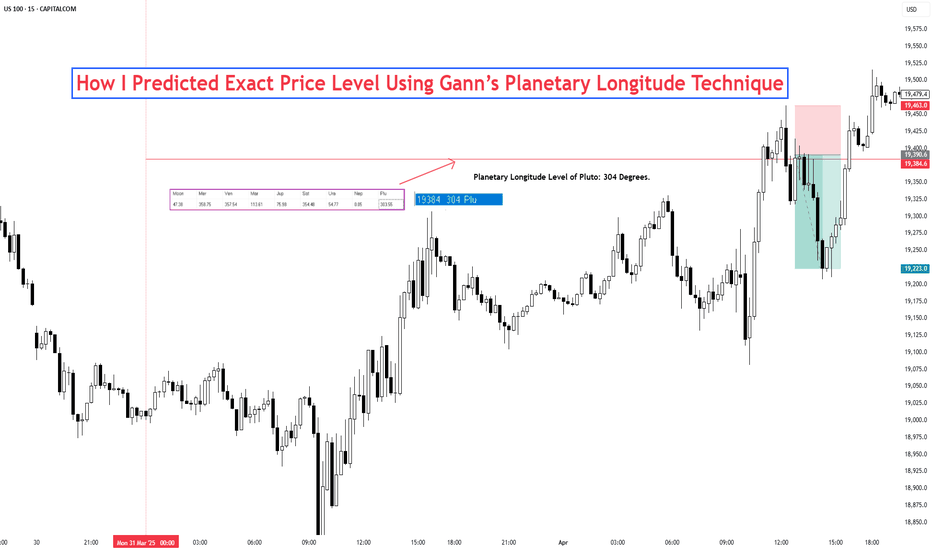
92% Win Rate Strategy Using Gann’s Planetary LongitudeHave you ever wondered how some traders seem to anticipate market reversals with uncanny precision, almost as if they can see into the future?
Well, what if I told you that the secret doesn’t lie in guesswork or traditional retail indicators, but in the heavens themselves?
Let me walk you through one of the most powerful forecasting tools in Gann's arsenal—the Planetary Longitude Method and how I used it to identify the exact price level from which the market reversed.
The Power of Planetary
SPY: Yet another bearish SPY forecastLooking at the previous sell-off patterns, theres a strong possibility that if the downtrend continues, SPY will head to low 500's by mid-May before rebounding in the summer to retest current levels (540-560) before completing the final leg (or first) of a correction to the high mid-high 400 price level - or potentially low 400s in September. Its been a while since I've shared a predictive chart but the current market behavior makes it hard not to try to paint a picture. Heaps of salt to be tak
Unlocking Market Secrets with Sacred GeometryIn this post we’ll dive into sacred geometry and how it is used in trading. Geometry isn’t just shapes—it’s the foundation of nature, architecture, and even trading.
From Pythagoras to Gann, great minds have studied these patterns to unlock hidden market signals. Let’s break down these powerful concepts and see how we can apply them to our own strategies!
First, take a look at this picture…
What you’re looking at here is a life-size oil portrait painting that’s displayed in the Manly P. Ha
USDJPY CHART TECHNICAL ANALYSIS CONFIRM TARGET WIN USD/JPY Chart Technical Analysis: TARGET WIN!
Congratulations on a successful trade!
Your technical analysis skills and market insight have paid off, and you've reached your target on the USD/JPY chart!
Take a moment to review your strategy and analyze what worked well. This will help you refine your approach and achieve even more success in your future trades!
What's your next move? Are you setting new targets, adjusting your strategy, or taking a break?
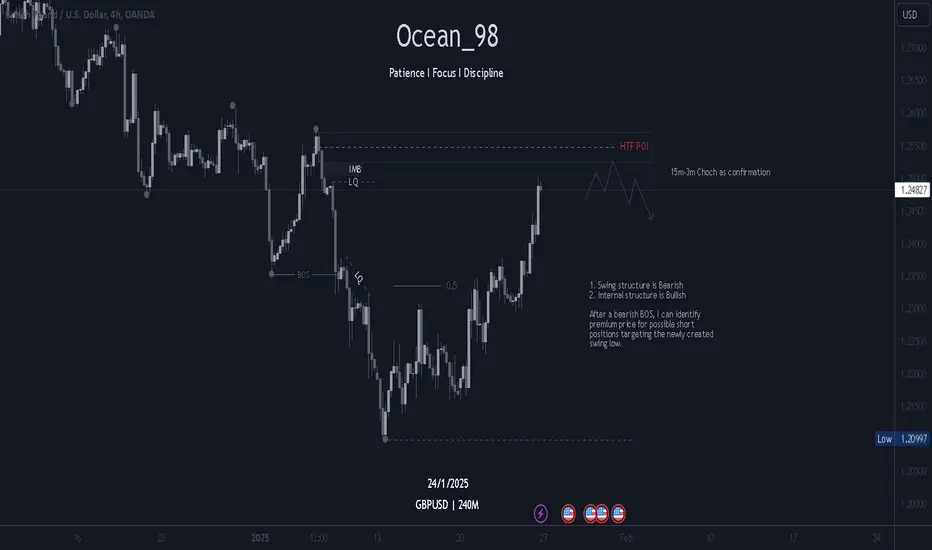
GBPUSD Swing Trade idea 27-31 Jan-2025Hello Traders.
Following up on the previous post and as promised. This is my expectation on GBPUSD on a HTF.
1. Swing structure is Bearish
*After a Bearish BOS, I can identify premium price for possible short positions targeting the newly created swing low.
*Price is already trading above equilibrium level /50% FIB and the identified POI i consider it a valid POI due to IMB/FVG; LQ, CHOCH & above 50% FIB.
2.Internal structure is Bullish
*Using 15m-3m i would be waiting for MSS to align w
Weekly GEX Insights: 01/13 SPX dropTotal Correction? What Can an Options Trader Do in This Situation? How Far Might We Fall This Week? We’ll tackle these questions in this week’s options newsletter!
It looks like the new president hasn’t even been sworn in yet, but the market is already reacting with fear to every statement he makes. Last week’s economic data didn’t help ease those concerns either.
SPX Weekly Analysis
Friday’s red candle set a bearish tone heading into this week. Everyone is predicting and pricing in a pote
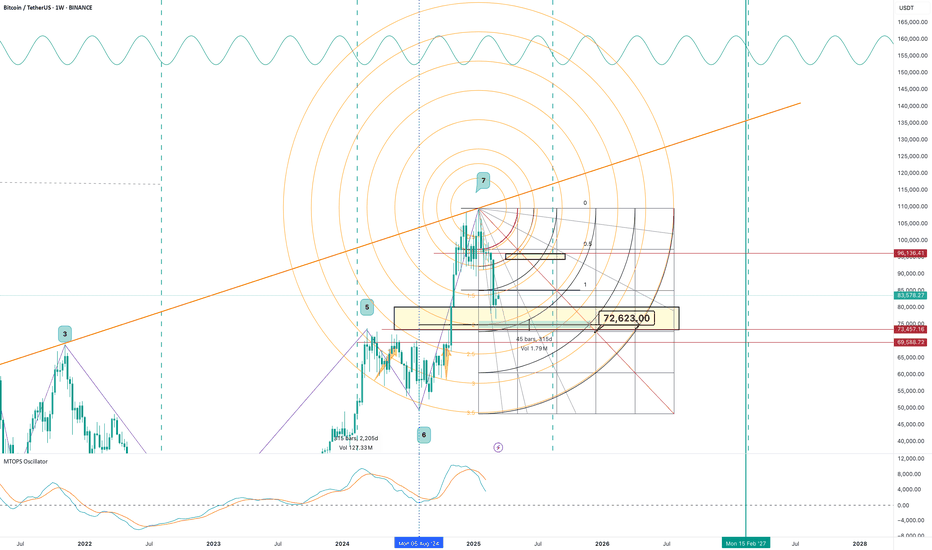
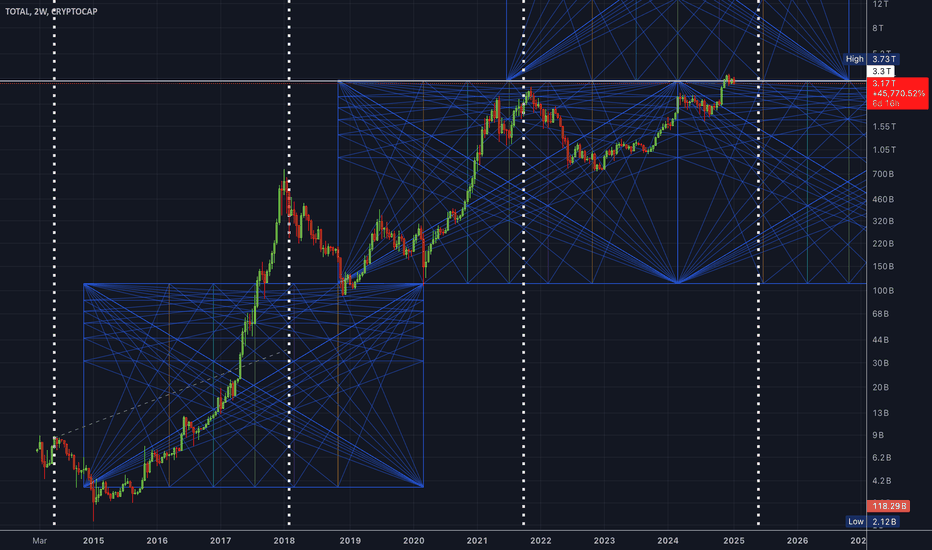
1W BTC Gann BoxThey won't tell you where or what level things will end up at but they can be precise at providing an idea of which directions the price could be contained at, for all directions. Each Gann diagonal acts as a 2 dimensional support and resistance, the closer and more that they are, the more difficult it is for the PA to pass through. Areas and pockets less densely packed with angles tend to be where a lot of significant price movement happens.