Daily trendline on BTC/USDTHere is a daily trendline drawn on the Bitcoin. If the price gets above this trendline then the trend might change. For now the price is neutral.by trader77974Updated 4
Next possible trading zoneNext possible trading zone if the price keeps on going down.Shortby trader77974Updated 1
Is getting above its Ichimoku cloudWill it close above it (daily japanese candlestick of 15-01-2023) ? SLongby trader77974Updated 3
Weekly Analysis BTC via Ichimoku Good start to the week, Let us analyze at a glance the daily chart of BINANCE:BTCUSDT with Ichimoku Kinko Hyo. We use the traditional settings. There are other indicators in the analysis. We have developed and released them Open Source. Trend: Kumo has been green for 44 days and is about 9.9% wide. It has expanded further since the last analysis and but has flattened out. In the short/medium term the situation is bearish: price is below the tenkan, the tenkan is moving below the kijun. In theby TheSocialCryptoClub3
Trading setup for a long opportunityIf the chikou span gets above the cloud then there could be a long trade opportunity with key levels for TP that could be : 0.1615 0.1635 0.1670 KLongby trader77974Updated 4
Weekly Analysis BTC via IchimokuGood start to the week, Let us analyze at a glance the daily chart of BINANCE:BTCUSDT with Ichimoku Kinko Hyo. We use the traditional settings. There are other indicators in the analysis. We have developed and released them Open Source. Trend: Kumo has been green for 37 days and is 8.5% wide. It has expanded further since the last analysis and Senkou Span A is looking upward. The situation is always bullish/lateral on the long term but on the short term it's a bearish momentum: the price is beby TheSocialCryptoClub2
Weekly Analysis BTC via IchimokuGood start to the week, Let us analyze at a glance the daily chart of BINANCE:BTCUSDT with Ichimoku Kinko Hyo. We use the traditional settings. There are other indicators in the analysis. We have developed and released them Open Source. Trend: Kumo has been green for 30 days and is 7% wide. It has expanded since the last analysis and is now flat again. The situation is always bullish/lateral on the long term but on the short term the bullish momentum has stopped and the price is now below the by TheSocialCryptoClub13
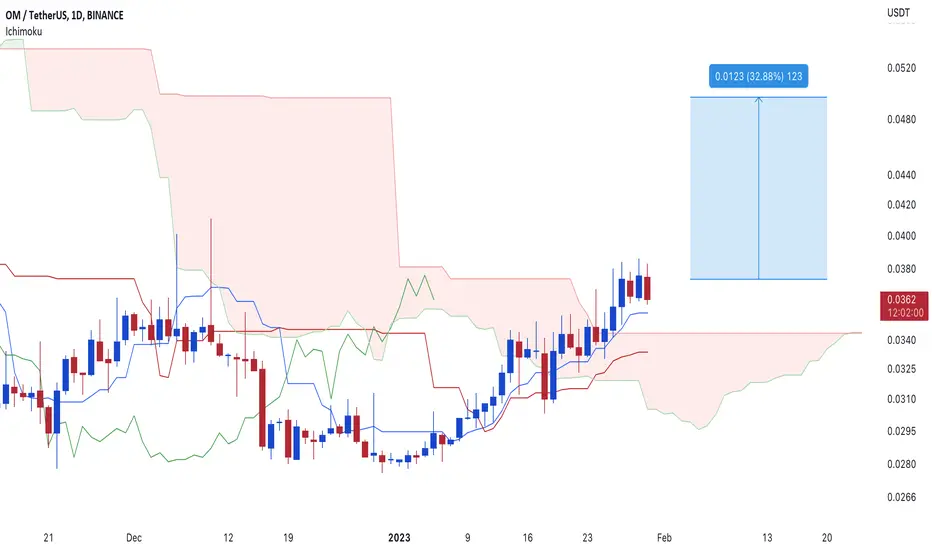
Ichimoku Analysis for OMwe have the bullish crossover, all we need is for lagging to come out and start the party.Oby TheAltcoinBuff0
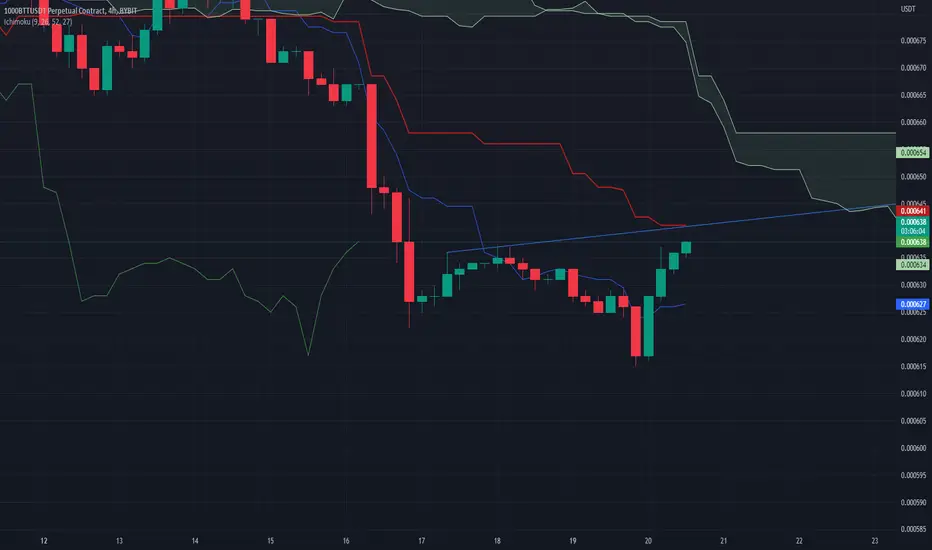
H1 trendline viewed in H4Will the price reach the trendline ? If yes then will it get above it and pump ? Longby trader77974Updated 5
Weekly Analysis BTC via IchimokuGood start to the week, Let us analyze at a glance the daily chart of BINANCE:BTCUSDT with Ichimoku Kinko Hyo. We use the traditional settings. There are other indicators in the analysis. We have developed and released them Open Source. Trend: Kumo has been green for 24 days and is 2.4% wide. It has expanded since the last analysis and is now flat. In concert the situation is always bullish/lateral. It is important to note that the price has bounced off the monthly Tenkan. The Kijun Trend indby TheSocialCryptoClub4
Ichimoku forecast lines on BitcoinThe price might go to 22622. The price has got below its IFL and the Chikou Span has got below its one.Shortby trader779741
Fibonacci extension levelsHere are the Fibonacci extensions that were drawn from the weekly timeframe. Longby trader779740
Key levels for ANT/USDT if it keeps going upThese key levels have been identified on the weekly timeframe (ichimoku levels) and the next level is a the next higher high in the past.ALongby trader779740
Might get above its H4 cloudMight get above its H4 cloud. The chikou span still has to get above it. Longby trader77974Updated 2
Key levels for the Dollar IndexHere are some key levels identified from the Ichimoku system.Shortby trader779741
Currently testing an H4 trendlineIf it gets above it then here are the next key levels identified.Longby trader779741
Can go to 38$ if the bitcoin keeps on going upHere is some key levels identified on higher timeframes. Longby trader779740
Weekly Analysis BTC via Ichimoku Good start to the week, We resumed our weekly analysis. Let us look at a glance at the daily chart of BINANCE:BTCUSDT with Ichimoku Kinko Hyo. We use the traditional settings. There are other indicators in the analysis. We have developed and released them Open Source. Trend: Kumo has been green for 16 days and is 1.4% wide. It is thin and looking upward. In concert the situation is bullish. Importantly, the price has crossed the Tenkan and the weekly Kumo and is now on significant price levelsby TheSocialCryptoClub0
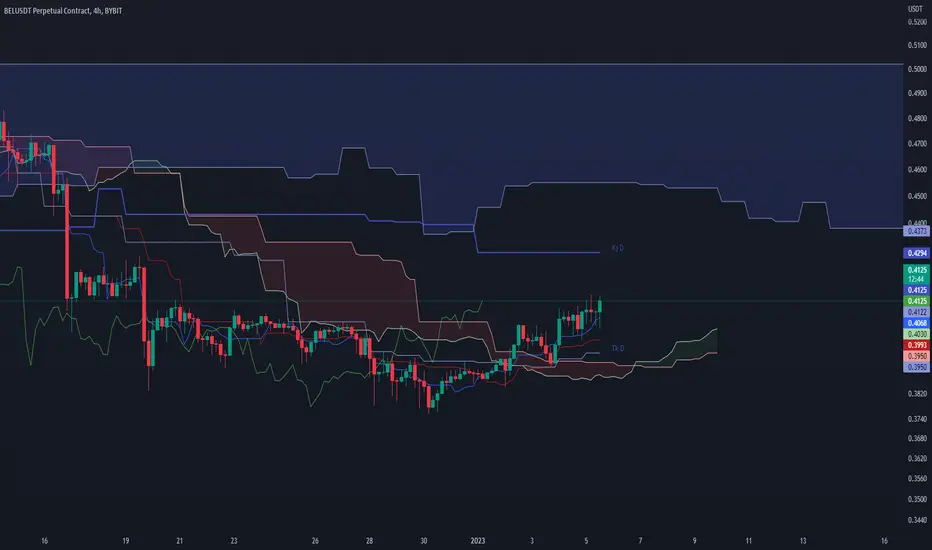
Could go to 0.4294The price and the chikou span are free to go up. 0.4294 is the kijun sen on the daily timeframe.Longby trader77974Updated 2
Key levels if the price keeps going upThese key levels have been identified on the weekly timeframe. Longby trader779740
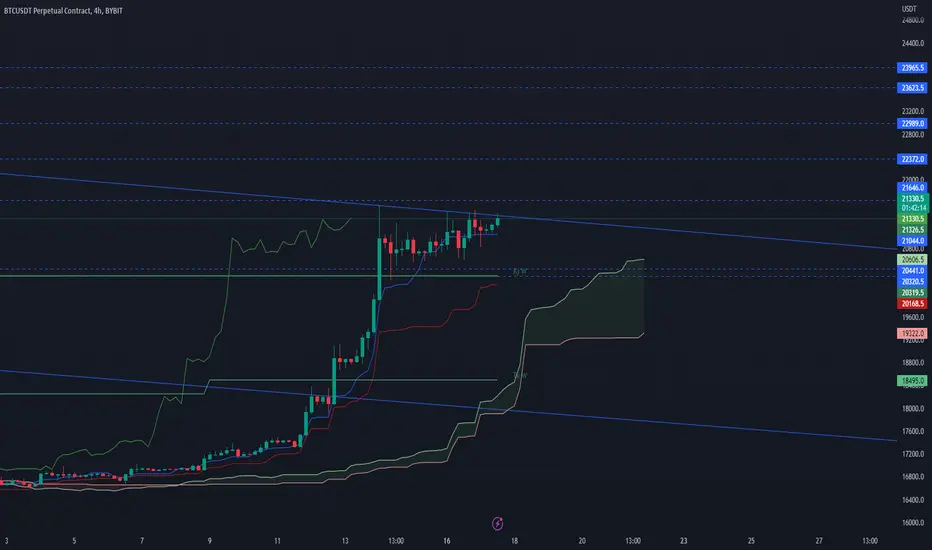
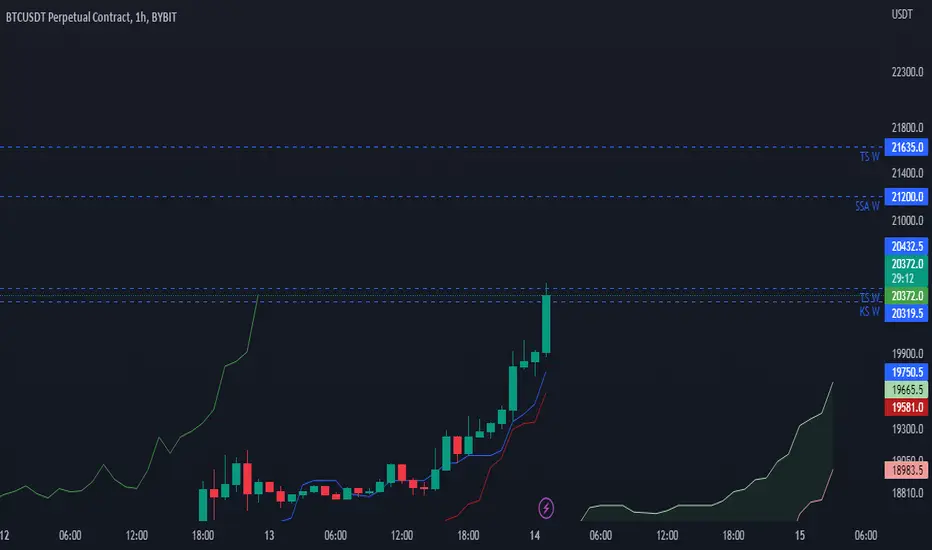
Next S/R if it keeps on going upHere are some weekly key levels to watch if the bitcoin keeps on going up. It has just got above a weekly kijun sen (strong level). Longby trader779741
ETHUSD Ichimoku 4H Szenarios Week 1 2023Here is my weekly 4H INDEX:ETHUSD Ichimoku Analysis for Week 1. General outlook The overall market trend is still downwards and I expect that we will see more in Q1 downward pressure due to adjustment of earnings and the higher and higher possibility of, at least, a mild recession in the US and EU. The Crypto market will be also pointing further downwards as the stock and crypto markets are still highly correlated. Ichimoku analysis My weekly analysis is based on the 4H chart. Lagging by chukymucUpdated 13
Trading setup for a long opportunityIf the price gets above 0.1327 then there could be a long trade opportunity with TP = 0.1390 Longby trader779741
Trading setup for a long opportunityIf the chikou span gets above its H4 cloud then there would be a good long opportunity with : TP1 = 0.2670 TP2 = 0.2725 Longby trader779741

 Short
Short LongShort
 Long
Long Long
Long ShortLong
 Long
Long Long
Long LongLong
 Long
Long Long
Long