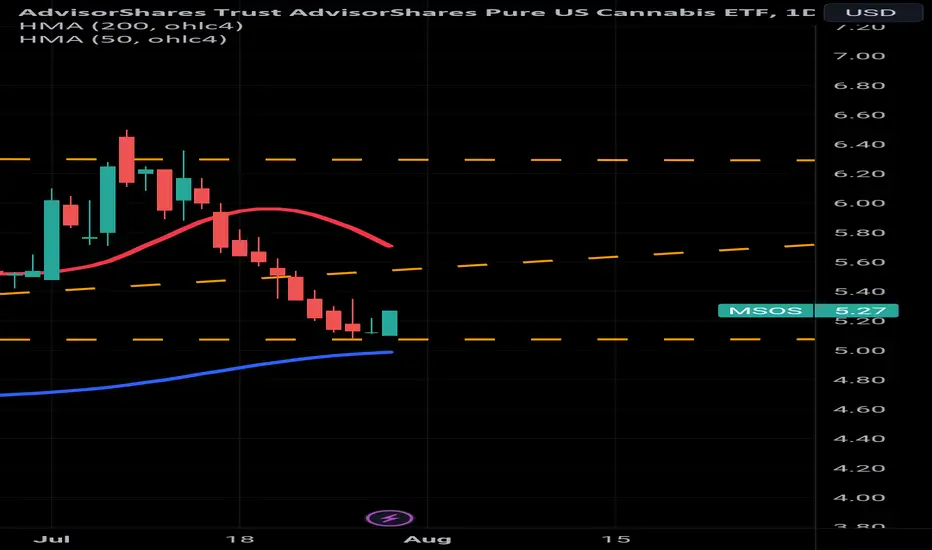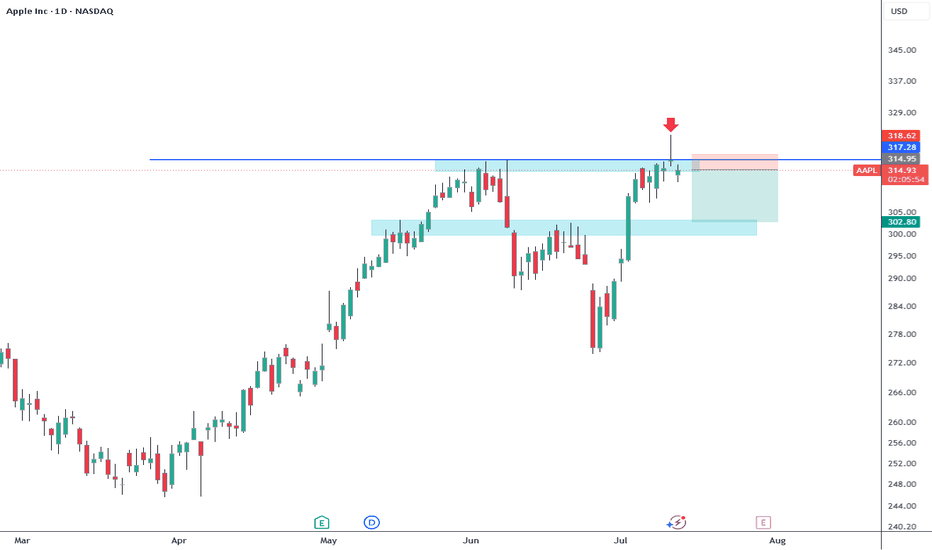
Nasty rejectionApple tried to make ATH yesterday but the price was rejected as shown. Now is trading below the resistance at 317. I don't think that is going to close above that level. I think is going back to the support at 300 before trying ATH again. I bought puts 07/31 300. If the price closes above 317 I'll take the loss.
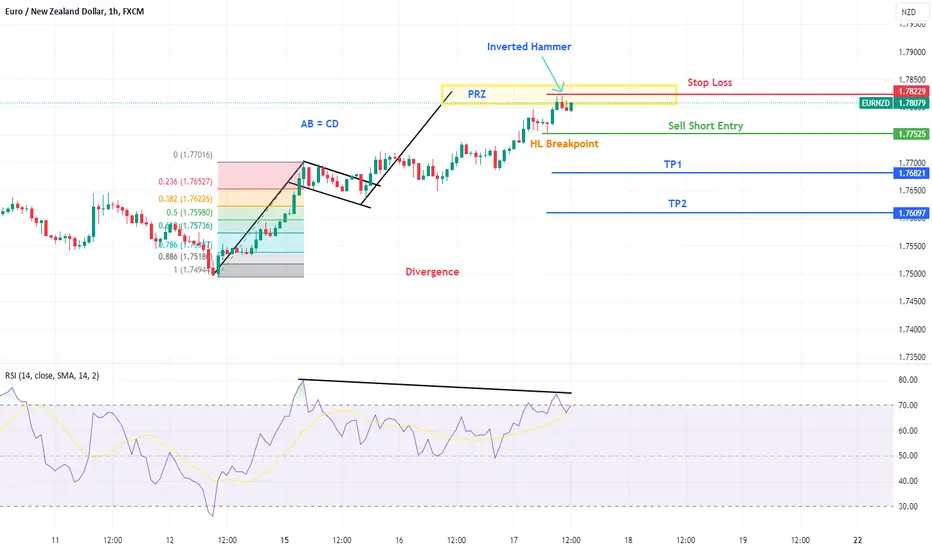
Inverted Hammer
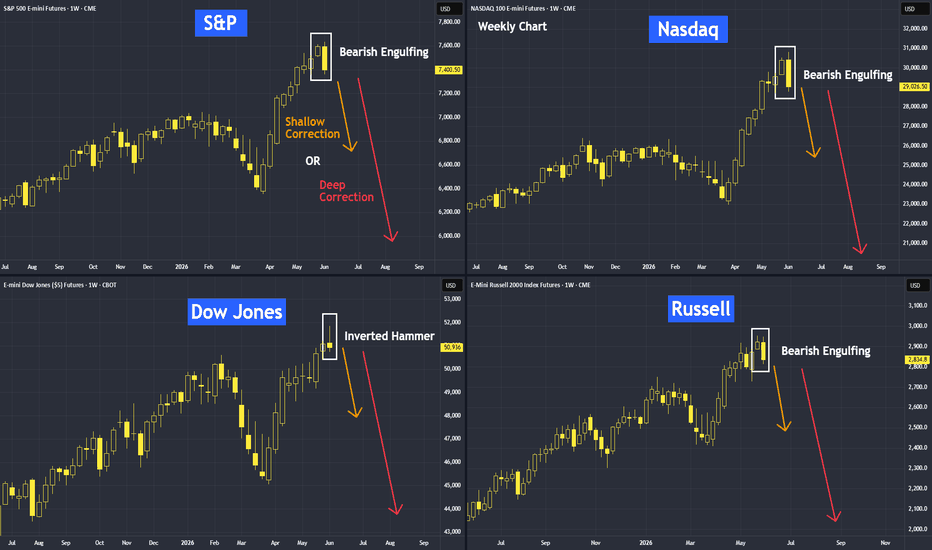
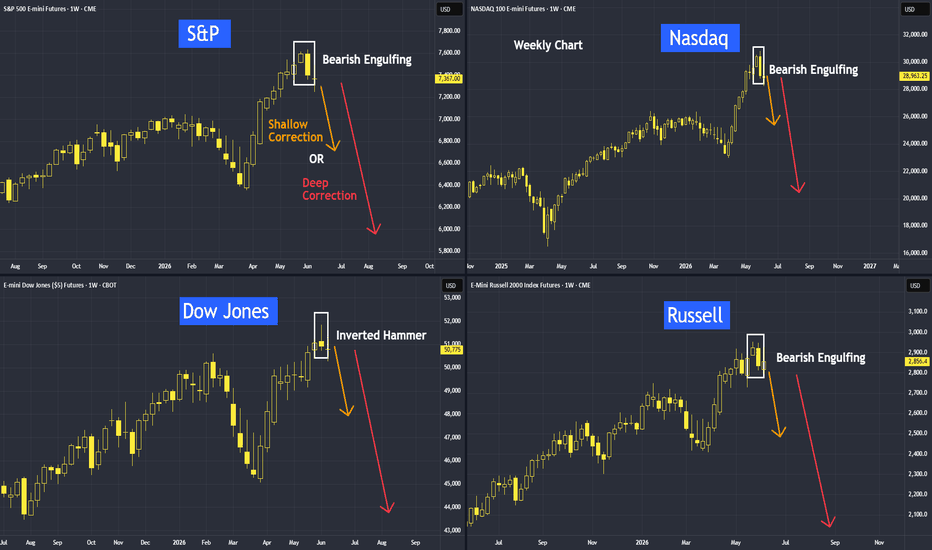
Will US Reversals Hold?As of last week's close, all major US indices completed their weekly movements, and all of them indicated a reversal pattern.
S&P 500, Nasdaq, and Russell 2000 all formed a bearish engulfing pattern, while the Dow Jones formed an inverted hammer.
So, is a correction coming?
Based on these technical studies, a correction appears to be developing.
We will discuss how to manage these risks and whether this correction will be shallow or deep.
Micro E-mini S&P 500 Index Futures & Options
Cod
Upcoming Correction: Shallow or Deep?Friday’s closing completed the weekly chart, with all indices indicating a reversal pattern. A correction is imminent. The question is whether this correction will be shallow or much deeper. How can we tell? Stay tuned for my upcoming video in the coming days.
Disclaimer This analysis is based on technical studies and does not constitute financial advice. Please consult your licensed broker before investing.
Micro E-mini S&P 500 Index Futures & Options
Code: MES
Minimum fluctuation
0.25 index
A Quick Bitcoin Warning, We may draw back to Range Low..........
There are a numberr of reason why I am watching a Fractal of the 2021 ATH to Low and comparing it to Current PA
This and the 50 SMA ( Red) and the 100 SMA ( Bliue) show us that we maybe about to see a Draw back if we continue to follow this fractal
As we can see,, in 2021, there was a brief push higher just before the 50 crossed below the 100 SMA.
This Cross over happened 315 days after the ATH in Nov 2021
PA is currently touching resistance after a push higher.
The 50 SMA is dropping to mee
US Stocks: Likely Scenarios After the Middle East Conflict on 28As of the close of the Dow Jones last Friday, 27 February, the monthly chart indicated an inverted pattern — not just in the cash market, but also in the futures market.
Then on Saturday, the Middle East conflict erupted once again.
First, I analysed the monthly chart, followed by the smaller time frame on the weekly. If you try it on the daily and even the hourly, you will see much more detail.
Video analysis:
Micro e-mini Dow Jones futures
Ticker: MYM
Minimum fluctuation:
Outright: 1.0 in
Has the Correction Begun? Will it Turn Into a Meltdown?I would say technically, yes. I will also cover the fundamental side of it.
As of the close of the Dow Jones last Friday, 27 February, the monthly chart indicated an inverted pattern — not just in the cash market, but also in the futures market.
Then on Saturday, the Middle East conflict erupted once again.
Micro e-mini Dow Jones futures
Ticker: MYM
Minimum fluctuation:
Outright: 1.0 index points = $0.50
Disclaimer:
• What presented here is not a recommendation, please consult yo
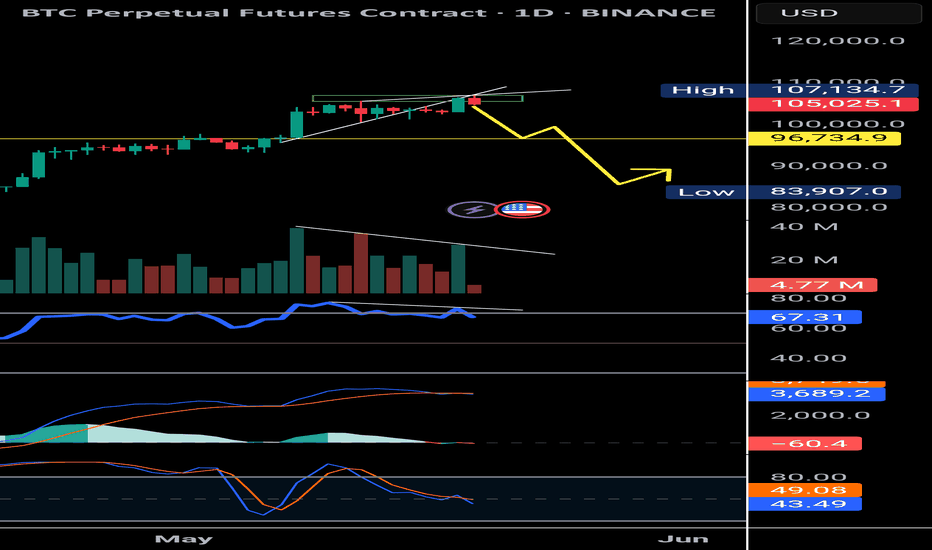
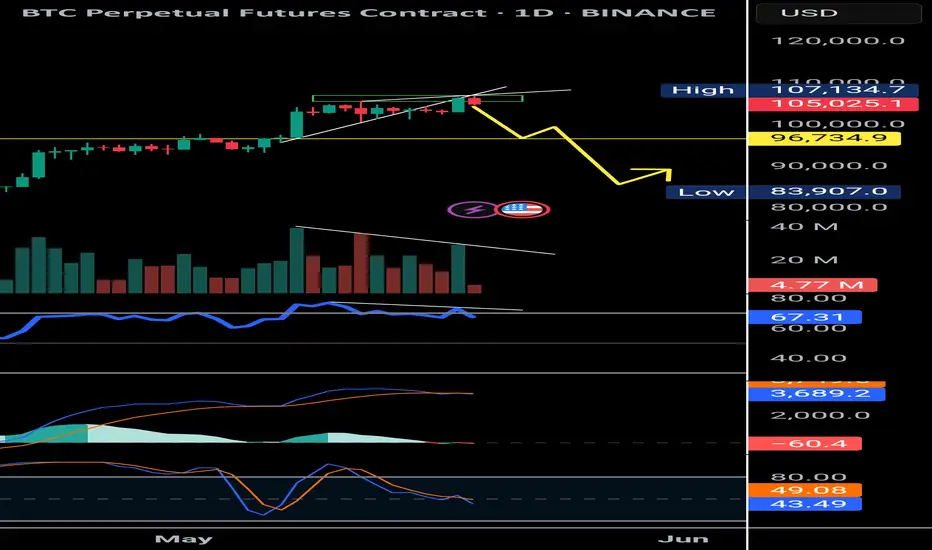
$BTC Bearish Divergence Confirmed | Correction ImminentBitcoin has formed a clear bearish divergence on the daily timeframe, accompanied by declining volume, an inverted hammer candlestick at resistance, and a MACD crossover to the downside. Price has also retested the upper trendline but failed to break higher.
Key levels to watch:
First support: $96,000
If broken, further downside to $80,000
Ultimate support around $60,000 if market sentiment weakens further
Also, be cautious as today's Moody's downgrade of U.S. credit may increase market vo
US Market Reversal Emerged? This Week's Closing is CrucialThe final trading day of February. I always take the opportunity to analyze the monthly chart closely.
We saw an inverted hammer. From the cash chart, clearly, we can see the inverted hammer. Beyond that, it also appears to be a potential double top for the Nasdaq.
E-mini Nasdaq Futures & Options
Ticker: NQ
Minimum fluctuation:
0.25 index points = $5.00
Micro E-mini Nasdaq Futures & Options
Ticker: MNQ
Minimum fluctuation:
0.25 index points = $0.50
Disclaimer:
• What presented here is not a
US Stocks Record High with Record Retrenchment, What's HappeningIn January alone, Microsoft, Google, Meta, and other tech companies have collectively cut more than 21,000 jobs. Furthermore, last year marked one of the worst periods in recent memory, with approximately 260,000 tech professionals losing their jobs.
Normally, we expect to see cost-cutting measures during a contraction stage, as was the case during the Dot-com bust, rather than during a period of growth like today. So, what is currently happening?
My name is Kon How, my work in this channel, a
Hammer of Trend ChangeThe Hammer and Inverted Hammer candlestick patterns, two powerful tools adept traders employ for reversals.
If you appreciate our charts, give us a quick 💜💜
Here’s what you need to know:
1. Understanding the Essence:
Hammer: This pattern typically emerges at the culmination of a downtrend, indicating a potential bullish surge. Its small body and extended lower wick signify the bears' struggle to maintain lower prices.
Inverted Hammer: Contrarily, this pattern usually appears a
Bullish Opportunity on EURJPYBullish Opportunity on EURJPY - Inverted Hammer Pattern Indicates Potential Upside Move
Greetings, traders!
Today, I want to share an exciting trading opportunity on the EURJPY currency pair, which appears to be trading bullish on the 1-hour chart. After conducting a thorough analysis, I have identified a compelling bullish inverted hammer candlestick pattern, suggesting the continuation of the upward trend. Let's delve into the details of this trade plan.
Trade Plan:
Entry Point 1 (Marke
Trading Series – The ManagementMost of us will spend about 90% of our time thinking of what to buy and at what price we should get in. In fact, that is only 10% of work done.
Focus on this scenario instead - “After getting into a position, how are we going to manage it with either a calculated loss when market go against us or how should we take profits when market perform better than our expectation?
As usual we will do a few case studies on how I manage my positions for this year.
Today’s content:
1. 90% of us – Spend
"Biting Point" Signal in Every Turn for 2022Stay-tune for the video version shortly, we will do more in-depth study.
Micro E-Mini Nasdaq Futures
Minimum fluctuation
0.25 point = $0.5
1 point = $2
10 points = $20
100 points = $200
Disclaimer:
• What presented here is not a recommendation, please consult your licensed broker.
• Our mission is to create lateral thinking skills for every investor and trader, knowing when to take a calculated risk with market uncertainty and a bolder risk when opportunity arises.
CME Real-time Market Data
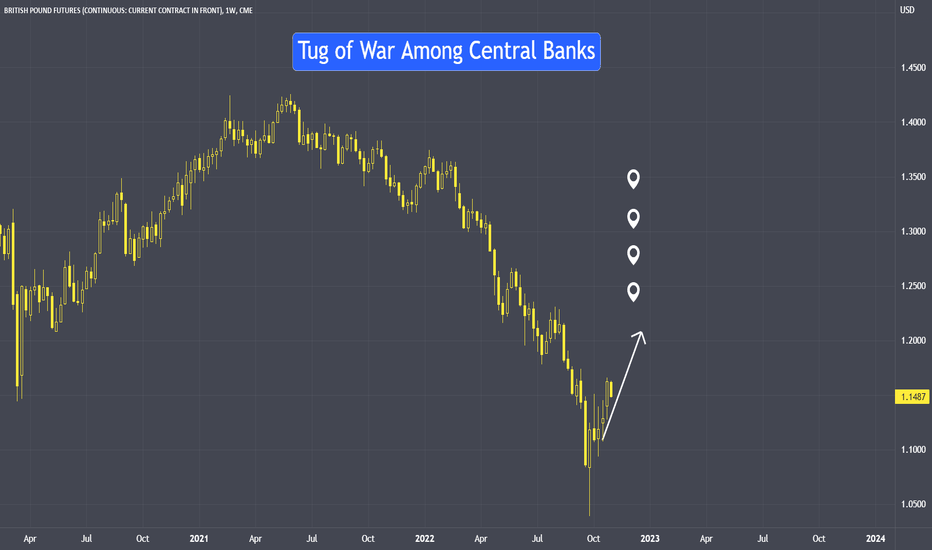
Tug of War Among Central BanksThere is a tug of war situation among the central banks to hike interest rates. What is the bad and the good that will come out from this?
i. Last week of October, European Central Bank officials announced another massive 75 basis point hike, increasing interest rates at the fastest pace in the history of the euro currency.
ii. This week, the Federal Reserve is expected to increase rates by 75 basis points for the fourth time in a row.
iii. The Bank of England could join the club on Thursday.
BTC - 1W ThoughtsThe Inverted Hammer candlestick formation occurs mainly at the bottom of downtrends and can act as a warning of a potential trend reversal.
After a long downtrend, the formation of an Inverted Hammer is bullish because prices hesitated to move downwards.
Sellers pushed prices back to where they were at the open, but increasing prices shows that bulls are testing the power of the bears.
**This is not a signal and should be used for educational purposes only.**
Wish you all the bestGL to all...
Do your research, trust nobody, look first then leap, and don't trust your "feelings" that much...
WLong
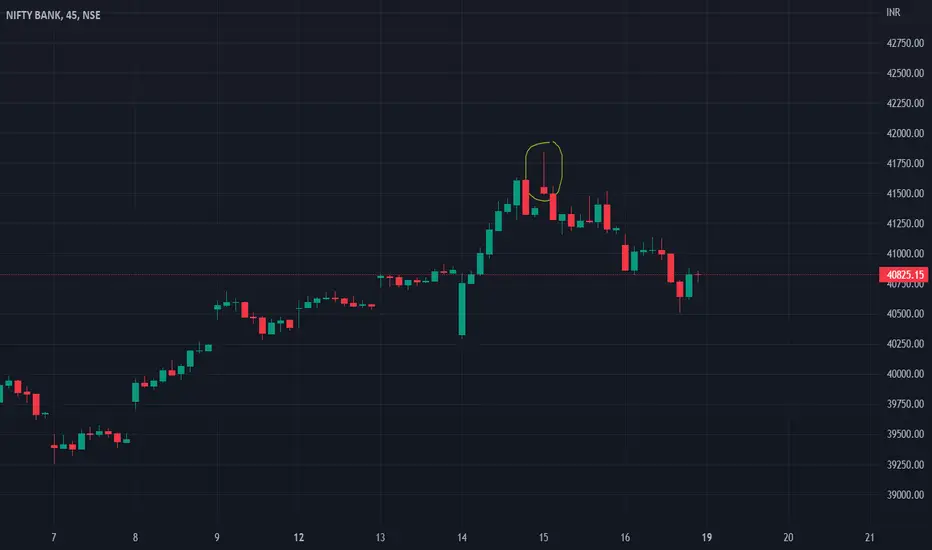
SHOTING STARHere we can see the formation of an inverted hammer which is usually called as a shooting star. This generally appears in a bullish run and indicates a reversal in the trend. The very next candle is a conformation of the shooting star. If someone had taken an appropriate put trade they could have easily gained 454 points.