Long
Long
 Long
Long
 Long
Long
 Long
Long
Watchlist for the upcoming MonthWatchlist, I am leaving the buy and hold or technical analysis to the trader.
90% Equity Allocation
T (AT&T) – One of the largest U.S. telecom operators. Known for wireless, broadband, and media services. Defensive dividend stock, often favored for income but less growth.
HWM (Howmet Aerospace) – Supplies aerospace components, particularly jet engine parts and fastening systems. Strong tie to aviation cycles and Boeing/Airbus demand.
PLTR (Palantir Technologies) – A data analytics and AI-driven company with heavy government and enterprise contracts. Popular among growth investors for its AI positioning.
TPR (Tapestry) – Parent of luxury brands like Coach, Kate Spade, and Stuart Weitzman. A play on consumer discretionary spending and global luxury markets.
CBOE (Cboe Global Markets) – A major U.S. options exchange. Benefits from high volatility and increased derivatives trading.
STX (Seagate Technology) – A storage solutions company, specializing in HDDs and increasingly in data center storage. Sensitive to tech hardware cycles.
VST (Vistra Corp.) – A Texas-based power generator and retail electricity provider. Recently a big beneficiary of U.S. grid transition and power demand growth.
LDOS (Leidos Holdings) – Provides defense, IT, and engineering services. A government contractor with exposure to cybersecurity and national defense budgets.
RTX (RTX Corporation / Raytheon Technologies) – Aerospace & defense giant. Combines Pratt & Whitney engines and Raytheon defense systems. Key player in defense spending.
RPRX (Royalty Pharma) – Buys pharmaceutical royalties, giving exposure to drug revenues without direct R&D risks. A unique business model in biotech financing.
NFLX (Netflix) – Streaming leader. Strong global brand with massive original content library. Faces competition from Disney+, Amazon Prime, etc., but maintains scale advantage.
PM (Philip Morris International) – Tobacco company with a pivot toward smoke-free products (IQOS). Strong global distribution, especially outside the U.S.
AVGO (Broadcom) – A semiconductor and infrastructure software powerhouse. Key supplier to Apple and data centers. Huge in AI-driven chip demand.
UAN (CVR Partners LP) – Produces nitrogen fertilizer. Highly cyclical, tied to agricultural demand and natural gas pricing.
10% 2x Leverage Allocation
CAKE (Cheesecake Factory) – U.S. casual dining chain. Consumer discretionary, sensitive to economic cycles and inflation.
NVDA (NVIDIA) – AI and GPU leader. Critical to data centers, gaming, and autonomous vehicles. Market darling in AI revolution.
TSLA (Tesla) – EV leader, also expanding into energy storage and AI-driven autonomous driving. Strong growth but highly competitive sector.
GEV (GE Vernova, the energy spinoff of General Electric) – Focused on renewable and grid solutions. Plays into global decarbonization and power infrastructure demand.
MMM (3M) – Diversified industrial conglomerate (healthcare). Currently restructuring amid legal challenges, but historically a strong dividend payer.

 Long
Long
 Long
Long
OKLO — when nuclear momentum breaks resistanceSince late 2024, OKLO had been consolidating inside a clear rectangle between $17 and $59. The breakout from this long-term range triggered a new bullish impulse. The price has since returned to retest the breakout zone, now aligned with the 0.618 Fibonacci retracement at $51.94. The retest has completed, and the price is bouncing upward, confirming buyer interest.
Technically, the trend remains firmly bullish. The price closed above the prior range, EMAs are aligned below, and the volume spike during breakout supports genuine demand. The volume profile shows a clean path toward $100, indicating limited resistance ahead. The structure suggests a controlled rally rather than an exhausted move.
Fundamentally, OKLO is a next-generation SMR (Small Modular Reactor) company focused on delivering compact, efficient nuclear power solutions. Following its public debut via SPAC and recent capital injection, OKLO is transitioning from development to implementation. Institutional interest is holding strong, and the broader move toward decarbonization and energy independence places the company in a strategic position.
Target levels:
— First target: $100 — psychological and technical resistance
— Second target: $143 — projected from prior range breakout
OKLO isn’t just another clean energy ticker — it’s a quiet disruptor with nuclear potential. The chart broke out. The volume confirmed. Now it’s time to see if the market follows through.  Long
Long
 Long
Long
 Long
Long
 Long
Long
 Long
Long
 Long
Long
 Long
Long
 Long
Long
 Long
Long
 Long
Long
Gold Analysis – Is the Correction Over?Yesterday I maintained my bias that OANDA:XAUUSD correction could extend lower, with 3570 as the focus for the next swing low. I even sold rallies above 3640 zone with that scenario in mind.
However, after the CPI release, Gold dipped to 3620 zone but quickly recovered. That prompted me to lock in a modest 100 pips gain rather than fight the market.
A wise move in hindsight, since Gold is now back testing the 3650+ resistance zone.
So, is the correction finished?
➡️ Most probably, yes.
Here’s why:
• Bulls are defending the 3620 zone, stepping in strongly on dips.
• The chart is shaping into a rectangle, typically a continuation pattern, which suggests consolidation before trend resumption.
• Momentum is aligning again with the broader bullish trend.
Trading Plan:
• As long as 3620 holds, my strategy shifts to buying dips instead of selling rallies.
• A break above 3660 would open the path for continuation, with 3700 as the next bullish milestone.
The market has spoken – the correction seems to be losing steam, and the trend is ready to reassert itself. 🚀
 Long
Long
Germany 40 Index – Range Trade or Something More?It has been a nervy week for the Germany 40 index as it has struggled for direction ahead of today’s ECB rate decision, which is due at 1315 BST, and then the press conference, led by ECB President Lagarde, which starts at 1345 BST.
While general sentiment has been boosted by US inflation data (PPI) supportive of a Federal Reserve rate cut next week, helping to lift the Germany 40 up to a weekly high of 23887 (Wed), issues related to Ukraine, including a violation of Polish airspace by a Russian drone leading to it being shot down, and the start of discussions between the US and EU regarding the potential for new tariffs on China and India, two big export markets for German companies, for their continued purchases of Russian energy, have weighed on rallies, which resulted in lows being seen at 23582 this morning (0700 BST).
Now, looking forward, Germany 40 traders may be focused on the ECB who are fully expected to keep interest rates unchanged, which could shift the focus for volatility to what Madame Lagarde says regarding the potential for one more 25bps (0.25%) rate cut in December, economic growth, the outlook for global trade and the sustainability of European government debt, particularly in France.
Any surprises here, combined with the US CPI release at 1330 BST could decide where the Germany 40 moves into the weekend, ensuring that monitoring the technical outlook could also be helpful for traders.
Technical Update: Range Trade or Something More?
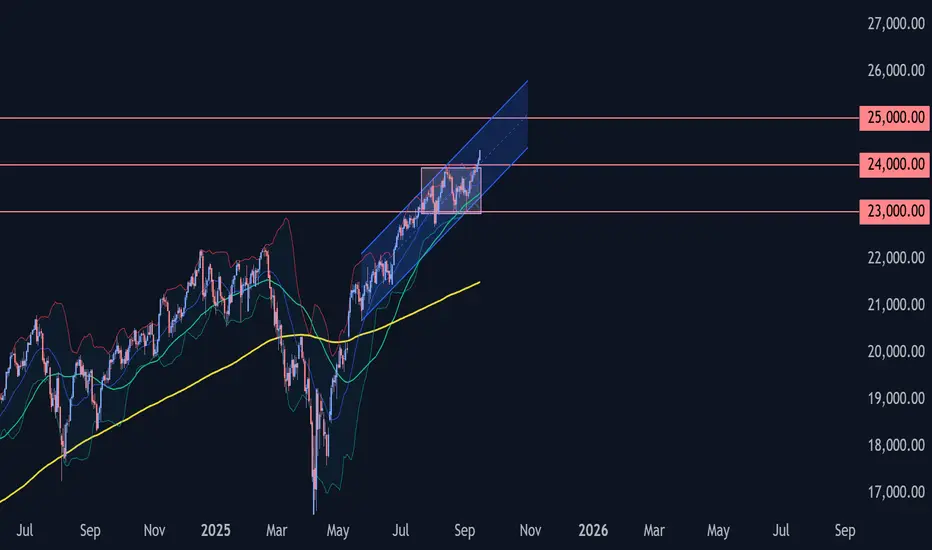
Since early July, when the Germany 40 index hit its all-time high of 24639 on July 9th, it hasn’t shown a clear upward or downward trend. As shown on the chart below, prices have mostly moved sideways, staying between the resistance level at 24639 and the support level at 23378, which was the low on August 1st.
It is impossible to say when this type of sideways price movement will end. A strong close above the resistance level or below the support level would suggest that prices may start moving more steadily in the direction of the break.
That said, with recent price weakness and a decline toward the August 1st low of 23378, traders may be wondering whether this could lead to a break lower from the sideways range, or if support will hold again, keeping the range intact.
So, let’s look at what may be the key support and resistance levels to watch
Potential Support Levels:
One could argue that the August 1st low of 23378 is the first key support to watch. If prices close below this level, it could signal a more extended phase of weakness, with the next potential support being 23013, which is the low from June 19th.
While there is no guarantee of further weakness, a close below 23013 could trigger a deeper decline toward 22420, which marks the 38.2% Fibonacci retracement of the price strength from April 7th to July 9th, possibly further.
Possible Resistance Levels:
While the July 9th high of 24639 remains the key resistance level marking the upper boundary of the current sideways range, if the August 1st low of 23378 continues to hold and sees a rebound, traders may want to watch for earlier resistance levels that could come into play before opening possibilities of moves toward the top of the range.
As shown in the chart above, the Bollinger mid-average is currently declining and sits at 24006. This level may act as the immediate resistance.
If prices manage to close above 24006 in coming sessions, it could open the door for a retest of the July 9th high at 24639.
The material provided here has not been prepared accordance with legal requirements designed to promote the independence of investment research and as such is considered to be a marketing communication. Whilst it is not subject to any prohibition on dealing ahead of the dissemination of investment research, we will not seek to take any advantage before providing it to our clients.
Pepperstone doesn’t represent that the material provided here is accurate, current or complete, and therefore shouldn’t be relied upon as such. The information, whether from a third party or not, isn’t to be considered as a recommendation; or an offer to buy or sell; or the solicitation of an offer to buy or sell any security, financial product or instrument; or to participate in any particular trading strategy. It does not take into account readers’ financial situation or investment objectives. We advise any readers of this content to seek their own advice. Without the approval of Pepperstone, reproduction or redistribution of this information isn’t permitted.

 Long
Long