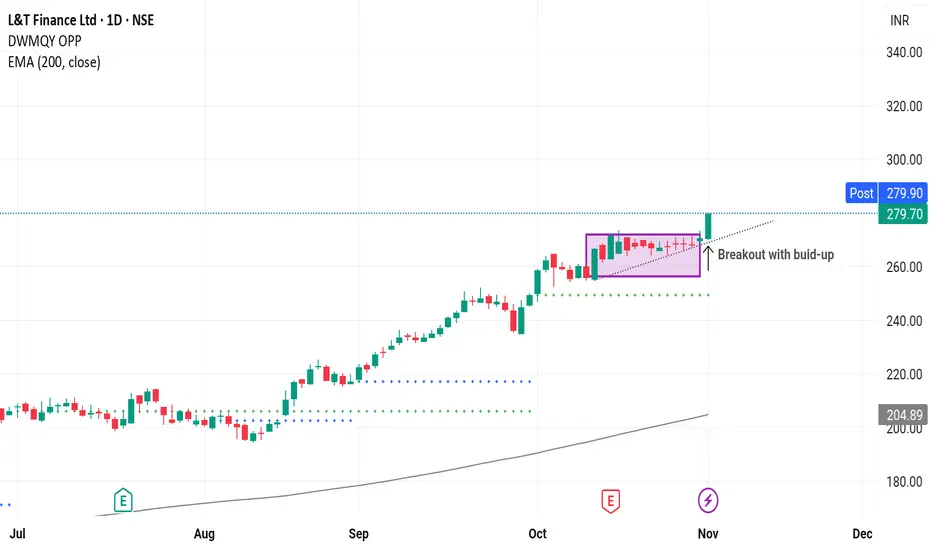
Thyrocare Long - ATH BreakoutThe Chart says it all.
Thyrocare is displaying strong #bullish #momentum, breaking out confidently after a solid period of #accumulation.
The structure is clean—consecutive higher highs and higher lows keep the #uptrend firmly intact.
Price has surged above key resistance levels, turning them into support, and is now marching toward multiple #swing and long-term #targets.
Overall, the chart reflects renewed strength, buyer dominance, and clear upside potential as the trend continues to build
Rectangle
BULLISH ON XAUUSDBullish Momentum Ahead.
-Touch/Retest on the previous support.
-Im still expecting a drop before or after highlighted move (later on in the day if not week)
-With that being said im still expecting crazy market movement (fake outs;wicks etc)
-Bullish Confirmations:
4HR TF touch on rectangle support zone.
1HR TF new buy candle formed & closed above.
15MTF continuation flag.
-Anything can still happen; hence im expecting to types of entries.
Lets see....
Disney Wave Analysis – 14 November 2025
- Disney falling inside impulse wave (1)
- Likely to fall to support level 100.00
Disney continues to fall inside the wide weekly sideways price range from the middle of 2022, as can be seen from the weekly Disney chart below.
The price earlier broke below the support level 110.00 (which stopped the previous impulse wave i) – which accelerated the active impulse wave (1).
Given the long-term downtrend, Disney can be expected to fall further in the active impulse wave (1) to the next round s
Tesla Macro Chart - Monitor PA @ Gap and Box midpointWatching to see what happens to tesla at the daily gap below and the box midpoint.
Again there could be a look below and fail of the pictured inner box but the failure at the top of this box says that we should be heading lower.
If the gap fill happens and it continues past $384, things could get musky.
CAD/JPY: Multiple Time Frame Analysis & PlanFollowing a breakthrough of a significant daily structural resistance yesterday.
📈CADJPY is currently consolidating within a horizontal range on an hourly timeframe.
For those seeking an intraday buying opportunity, a bullish breach of the range's resistance, specifically an hourly candle closing above 110.65, would provide a strong bullish confirmation.
A subsequent bullish continuation would then be anticipated, at least to the 111.00 level.
US100 | Building Liquidity for a Potential Push Toward 26,000NASDAQ (US100) is consolidating between 25,400–25,750, forming a potential accumulation zone below short-term liquidity. A clean break and retest above 25,750 could trigger a bullish expansion toward the 26,000–26,200 range, where major buy-side liquidity sits.
Market Structure:
Bias: Bullish (HTF structure shifting higher)
Key Demand Zone: 25,400 – 25,450
Breakout Zone: 25,750
Target Zone: 26,000 – 26,200
Invalidation: Below 25,400
Concepts: Liquidity Grab | Market Structure Shift | Dem
LYFT 1W from losses to profit investors believe,but for how longLYFT broke out of its long accumulation range between $8 and $20 and is now consolidating above the breakout level. The “breakout + retest” structure remains intact, with $20–21 acting as key support. A golden cross on the weekly chart confirms a shift toward bullish momentum. As long as price holds above $20, targets stay at $33.33 and $48.48.
Fundamentally , Lyft is in its strongest position in years. In Q3 2025, the company reported its first net profit of about $46 million after years of
DAX index Wave Analysis – 12 November 2025
- DAX index reversed from support level 23500.00
- Likely to rise to resistance level 24695.00
DAX index recently reversed with the daily Hammer from the support level 23500.00 (lower border of the sideways price range inside which the index has been moving from July, as can be seen from the daily DAX chart below).
The support level 23500.00 was strengthened by the lower daily Bollinger Band.
Given the clear daily uptrend, DAX index can be expected to rise further to the next resistance lev
GOLD BLOODBATH | 4103 so close | TradeWithMKY🚨 **GOLD JUST HIT MIRACLE SHOT SUPPORT @ $4,001**
📉 **-0.11% today, but SMART MONEY LOADED AT $3,990–$4,010**
🧠 **What the chart says (3H):**
- **Smart Money Footprint** = Dark pool accumulation zone
- **Red Warning Line** = $3,990.251 → **DO NOT BREAK**
- **Green Support** = $4,001.275 → **Bounce or Die**
- **First Target** = $4,175 (All-time high retest)
⚡ **Miracle Shot™ Indicator NOW PUBLIC**
👉 Search: `Miracle Shot by TradeWithMky` → Add to chart
📢 **Comment "GOLD" belo
XAUUSD | Breakout Above Supply Zone – Targeting 4140–4150 NextGold has successfully broken above the supply zone (4020–4060), confirming a bullish structure shift after multiple rejections in the past week. The clean breakout now opens the path for a liquidity grab toward 4140–4150, aligning with higher timeframe inefficiencies.
Trade Plan:
Entry Zone: Retest of 4040–4060 (previous supply turned demand)
Bias: Bullish continuation
Target 1: 4129 (intra-day liquidity level)
Target 2: 4153 (major HTF resistance)
Invalidation: Below 4020
The Swing Strategy, I been usingZone‑to‑Zone Trading
1.1 Drawing the Zones
What is a zone?
A price area (not a single line) where the market repeatedly reacts: flips from support→resistance (S/R) or resistance→support (R/S), stalls, or coils.
Priority by timeframe:
Monthly ≥ Weekly ≥ Daily ≥ Hourly. Higher‑timeframe zones carry more weight.
How to mark zones
Start on monthly, and highlight obvious S/R bands.
Drill down to weekly, refine, or add.
Drill down to daily, refine, or add.
Drill down to hourly for tactical ent
GOLD (XAUUSD): Deep Consolidation
This week is very slow for Gold.
The market is stuck within a wide horizontal range on a daily time frame.
With the absence of high impact US fundamentals, I think that probabilities will be high that the market will keep consolidating.
The best strategy to follow for now is to look for trading opportunities from the boundaries of the underlined parallel channel: selling from the resistance and buying from the support after a confirmation.
As the price is closer and closer to the resistanc
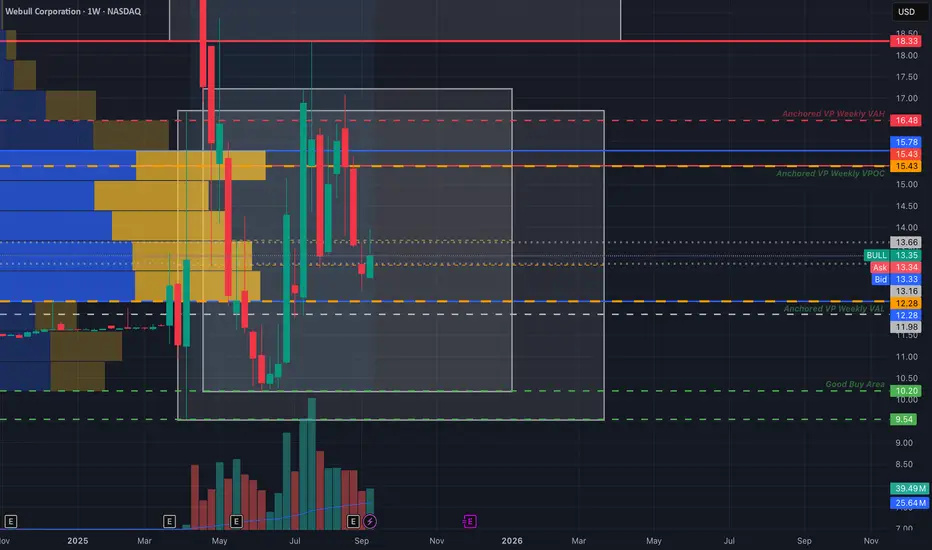
Webull Chart - Robinhood Competitor?Calling all matadors, we got a bull to corral.
I've charted some levels of interest for a speculative hold. Many view webull as a potential competitor for robinhood, although fundamentally, bull is in no-where near in the financial position that hood is in terms of free cash flow and expenses (or innovation as far as I've seen).
This could make a great swing trade on pure technicals. If the brokerage industry sees a period of exuberance(like we've seen in the quantum space), bull could catch
EURAUD Wave Analysis – 4 November 2025
- EURAUD reversed from support level 1.7600
- Likely to rise to resistance level 1.8085
EURAUD currency pair recently reversed from the support zone between the support level 1.7600 (lower border of the narrow sideways price range inside which the pair has been trading from June) and the lower daily Bollinger Band.
The upward reversal from this support area stopped the previous short-term impulse wave A.
Given the strength of the support level 1.7600 and the bullish euro sentiment seen tod
Updated BTC Box - BTC Box 2.0Hella levels to this shit.
BTC's been struggling in the upper box for a while.
Previously achieved a look below and fail but could not go beyond the box's midpoint.
To summarize a bullish event occurred without producing a bullish result. That is objectively bearish to me.
I would like to see how BTC reacts to the previous lows and if we revisit that old bear trap from a year ago.
Maybe we get another look below and fail but I will continue to evaluate.
For now I just want to share the up
EURCAD: Consolidation Trading 🇪🇺🇨🇦
EURCAD is trading in a horizontal range.
The price has just tested its support.
There is a high chance that the price will bounce from that
and reach a resistance of the range soon.
Goal - 1.621
❤️Please, support my work with like, thank you!❤️
I am part of Trade Nation's Influencer program and receive a monthly fee for using their TradingView charts in my analysis.
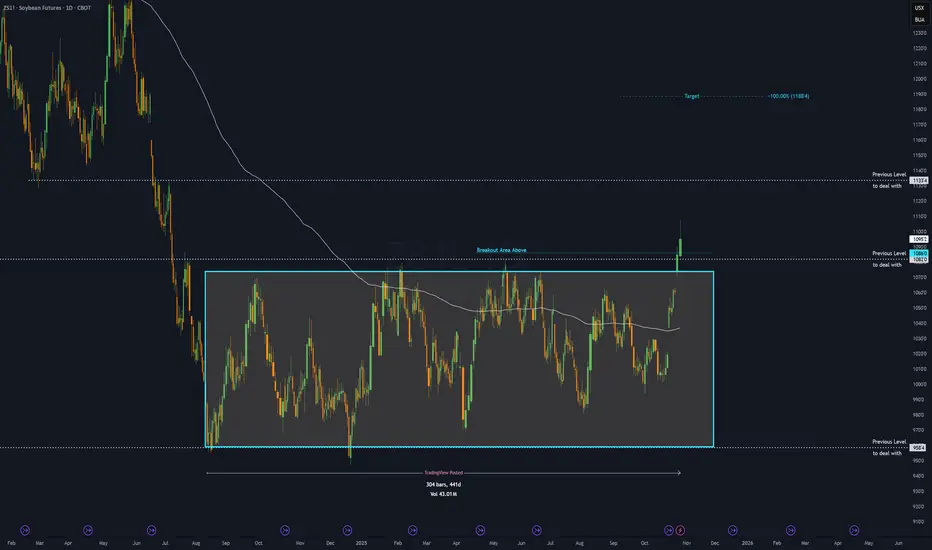
ZS - 14 months RECTANGLE══════════════════════════════
Since 2014, my markets approach is to spot
trading opportunities based solely on the
development of
CLASSICAL CHART PATTERNS
🤝Let’s learn and grow together 🤝
══════════════════════════════
Hello Traders ✌
After a careful consideration I came to the conclusion that:
- it is crucial to be quick in alerting you with all the opportunities I spot and often I don't post a good pattern because I don't have the opportunity to write down a proper didactical comment;
- sin
The Interesting part of the marketHello traders, so guys I applied my strategy to this baby and it did work out.. Observe that sui came down hugely before I think it's getting back at it's fit...
The current leap BYBIT:SUIUSDT broke the structure it had and now it's a run, keep a good eye on BYBIT:SUIUSDT
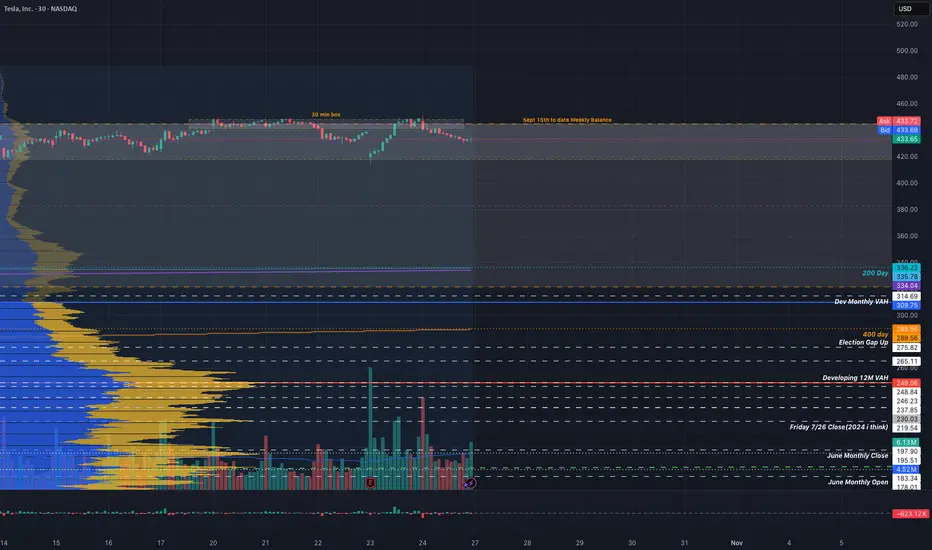
Tesla Macro ChartSharing my Macro Chart.
Use this as a reference for the levels of interest mentioned in my previous tesla post. Added a 30 minute box within the weekly balance box.
I like to personally use this chart to monitor levels intraday on the 30 minute or to plan major shorts or buys.
Some of these levels were drawn a year ago probably but I hope you'll find them useful.
~The Villain