Trend Line Break
GBPJPY — Potential 1H Reversal SetupAfter the sharp bearish move, GBPJPY has reached an important area of interest.
Price created a new LL, followed by a reaction and another test of the lows. I’m watching this as a potential double-bottom / bullish reversal structure around the 206.7–207.0 area.
The key level for me is the 209.1 neckline.
Trade idea:
🟢 Long around the neckline / on confirmation
🛑 SL below the recent LL / jaw area
🎯 TP around 211.224
📊 Targeting approximately 1:3 RR
The main confirmation I want to see on the
XAUUSD — Bearish Wave Toward 4,160
Gold is still moving inside a clear bearish channel after failing to break above the descending trendline. From Kelly’s view, the current chart suggests that XAUUSD remains under downside pressure, and the latest recovery may only be a short correction before another bearish Elliott Wave leg continues.
The key idea is simple: gold is trading below the FVG sell zone, and if buyers cannot reclaim this resistance, sellers may continue pushing price toward the lower support and final target area.
GOLD - A bounce off support before falling to 4,200 ICMARKETS:XAUUSD remains under pressure from the Fed’s hawkish stance and a strengthening dollar. In the medium term, the market may maintain its bearish trend; however, this week, all attention is focused on the Fed’s rate decision and the regulator’s comments
The dollar is forming a countertrend correction but remains locally bearish. The dollar’s rise is putting additional pressure on the metals market. Gold is maintaining its bearish market structure amid the Fed’s hawkish stance, whil
BTCUSD 1H — Bullish Rebound From SupportBTCUSD is showing a potential bullish reversal from the strong **$76,400–$76,700 support zone**. Price has reacted positively from this area, suggesting buyers are stepping in. A sustained move above the nearby **$77,200–$77,600 resistance** could strengthen the bullish setup and open the way toward higher levels.
**🎯 Target:** **$79,150**
**📍 Support:** $76,400–$76,700
**📈 Confirmation:** Break and hold above $77,600
**⚠️ Invalidation:** Strong breakdown below $76,400
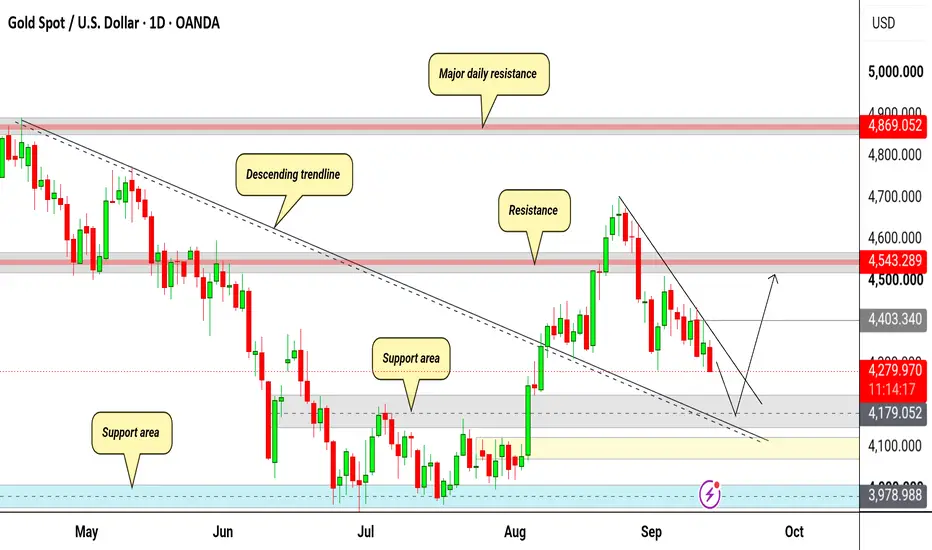
XAUUSD: Major Support Confluence & Descending Liquidity RetestTechnical Analysis
Market Structure & Trendline Retest: Gold (XAUUSD Daily) completed a major structural breakout above its long-term Descending Resistance Trendline in August, accelerating toward the $4,600 supply zone. The subsequent pull-back represents a textbook descending liquidity sweep and retest of the broken trendline acting as new dynamic support.
Support Confluence Zone ($4,179 – $4,287): Price is compressing directly into a high-confluence demand cluster formed by:The top boundary
XAUUSD — Bearish Channel Toward 4,175
Gold is still moving inside a clear bearish channel after failing to reclaim the upper resistance trendline. From Kelly’s view, the chart suggests that XAUUSD remains under downside pressure, and the current recovery may only be a short correction before the next bearish wave continues.
The key idea is simple: gold is trading near the sell zone, and if buyers fail to break above this area, sellers may push price back toward lower support and the final target zone.
⟡ Market structure
Gold is
GOLD - A countertrend correction to 4,400 ahead of the newsICMARKETS:XAUUSD remains under pressure from a strengthening dollar and a weak fundamental backdrop. The market is making new intermediate lows within the 4,290–4,500 trading range. Key news is ahead…
The dollar is bouncing from support and returning to its bullish momentum, putting further pressure on the market. Gold is trading near its weekly lows, around $4,310, on Friday following a sharp decline triggered by hotter-than-expected PPI data and rising oil prices.
According to TD Securit
BITCOIN - A correction within a consolidation phaseBINANCE:BTCUSDT.P reached a new cycle high at 82,300, but still failed to reach the key target. The market remains in consolidation, within which a countertrend correction is developing
The fundamental backdrop remains unstable, but relatively favorable for the market. Against this backdrop, Bitcoin continues to consolidate within the current range. On September 15, the Senate is scheduled to hold another vote on the CLARITY Act.
The market has been range-bound between 76,400 and 81,300 fo
XAUUSD — Medium-Term Bearish Wave Toward 3,836
Gold is showing a medium-term bearish Elliott Wave structure after failing to recover above the descending channel resistance. From Kelly’s view, the chart suggests that XAUUSD is still moving inside a broader downside trend, and the current rebound may only be a correction before the next bearish wave continues.
The key idea is simple: gold may retest support first, then create a short recovery, but as long as price stays below the descending trendline and resistance structure, the priority
XAUUSD — Bullish Retest Toward 4,425
Gold is showing a short-term bullish recovery after completing the previous downside wave near the lower support area. From Kelly’s view, the current chart suggests that XAUUSD may be forming a corrective bullish structure, with price now reacting from the 4,334–4,340 buy retest support zone.
The key idea is simple: if gold holds above this support, the next recovery leg may continue toward the 4,420–4,435 strong resistance area.
⟡ Market structure
Gold recently completed a bearish 5-wave se
SOLANA Bullish Trendline Breakout — Target 106.84SOLANA (SOLUSD) is showing a bullish reversal setup after breaking above the long-term descending trendline. Price has also reacted strongly from the **major support zone around 98.00–98.50**, showing strong buying interest. The breakout suggests a potential continuation toward the marked resistance area.
🎯 **Target:** 106.84
🛡️ **Key Support:** 98.00–98.50
📌 **Bias:** Bullish above the breakout area
The setup remains constructive as long as price holds above the broken trendline and support z
BTC ENTERING INTO NEW UPTREND DAILY BASIC TREND..Depending on last data BTC is just entering the first 1/3 trend of uptrend, we will follow the other confirmations in the coming hours. BTC had a breakdown trend of more than 22h+
For now BTC seems to return into positive trend, and the start of new Long follow
GOLD - A Hunt for Liquidity Ahead of Further DeclinesICMARKETS:XAUUSD has been forming a countertrend correction since the session opened. The fundamental backdrop remains unstable, and this correction could end with another move lower
Gold remains exposed to two-sided risks ahead of the release of U.S. CPI data. The sell-the-bounce strategy remains in place, especially against the backdrop of higher-than-expected inflation in China. TD Securities expects core inflation to remain under control in August but warns of upside risks
Drivers:
Ups
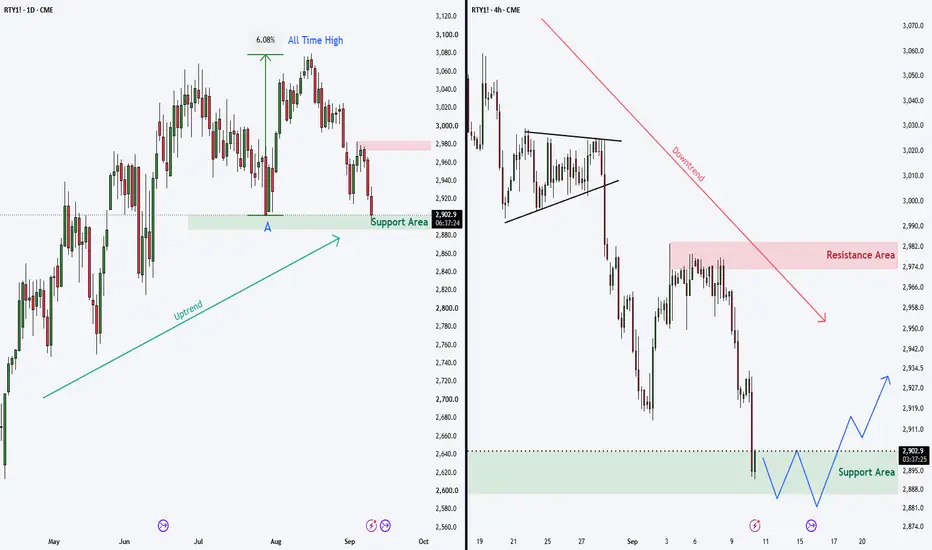
RTY1! / RUSSELL 2000 Multiple Timeframes
RTY1! Multiple Timeframe Analysis:
On the Daily chart (LEFT), we can see that this price zone (A) previously acted as support and led to a strong +6% move to a new all-time high. The Daily chart is still in an uptrend.
However, the 4H chart (RIGHT) is trending steadily lower, and at the moment there is no clear sign that the downtrend is coming to an end.
Since the Daily trend (LEFT) remains intact, we could potentially see a bullish reversal if a double bottom, a breakdown failure, or a s
CADJPY 4H: Bullish Reversal Setup Off Key Support Zone Overview & Setup Parameters
Pair / Timeframe: CAD/JPY (4-Hour Chart)
Current Trading Price: ~111.334
Bias: Long / Bullish Reversal
Key Support Zone (Entry Zone): 110.830 – 111.330
Target Resistance (Take Profit): 113.340 – 113.500
Invalidation / Stop Loss: Below 110.500 (below major structural low)
📉 Technical Analysis
Major Support Test: CAD/JPY has retested a major horizontal support zone around 110.830–111.000, which historically held as a key structural base in late July / early Augu
Tactical Risk-Off Broadens as MES Loses 7,670Tactical Risk-Off Broadens as MES Loses 7,670
Market Regime: Tactical Risk-Off / Downside Continuation
Macro Regime: Hostile Tilt
Systemic Stress: Not confirmed
Confidence: High
Wednesday confirmed that the market’s narrow repair attempt had failed.
MES lost the 7,670.50–7,682.25 support band and remained below it during the evening review. The significance was not limited to the index decline: equal weight, small caps, sectors and global equities broadly confirmed the deterioration.
A growi
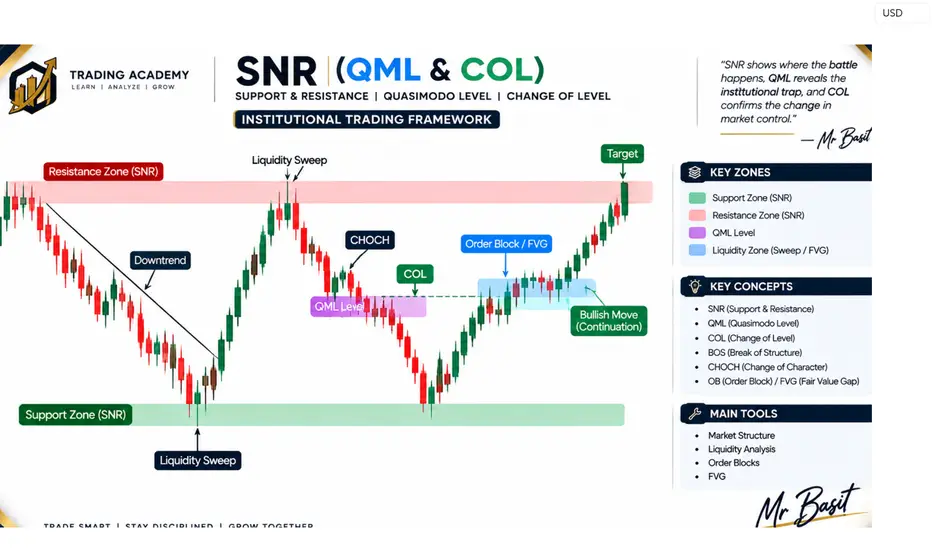
SNR MODEL (QML & COL) | Advanced Support & Resistance Framework
The SNR Model (Support & Resistance) with QML (Quasimodo Level) and COL (Change of Level) is an advanced price-action framework used to identify high-probability reversal and continuation zones.
Traditional traders see support and resistance as simple lines, but professional traders understand them as institutional decision areas where liquidity, order flow, and market structure interact.
The combination of SNR + QML + COL helps traders identify where smart money may enter, exit, or reverse t
GBP/USD setup: Ascending channel retest & key support zones
Technical Analysis
Trend & Structure: GBP/USD on the 4-hour timeframe is respecting an ascending channel / trendline originating from the July lows (~1.3150). Price action shows higher highs and higher lows overall.
Key Support Zones:
Immediate Support / Flip Zone: The 1.3540–1.3550 area acts as a pivot zone (former resistance now behaving as support/resistance).
Major Horizontal Support: Located around 1.3437, which coincides with the primary ascending trendline and a previous consolida
GOLD - The market is under pressure from a bearish trend ICMARKETS:XAUUSD remains in a local bearish trend, while consolidation below the 4,435 liquidity zone is becoming a technical catalyst for further downside
The dollar is stagnating, but at the same time, it is weakening due to interventions by the Bank of Japan. Gold looks weak against this backdrop, especially given the Fed’s medium-term hawkish stance. Geopolitical risks and inflation expectations that could limit further upside remain in place. The key event of the week will be the U.S.
GBP/USD 2H | Breakout Setup with Bullish TargetsGBP/USD is showing a potential bullish breakout from the descending structure after holding the support zone. A confirmed breakout could open the way toward the 1st target at 1.3560, followed by the 2nd target near 1.3609.
Key focus: breakout confirmation and support holding.