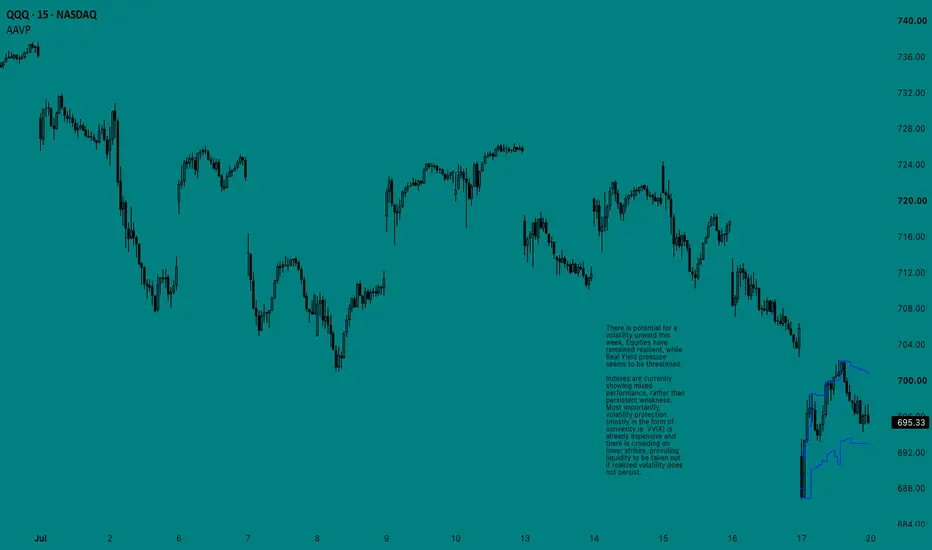
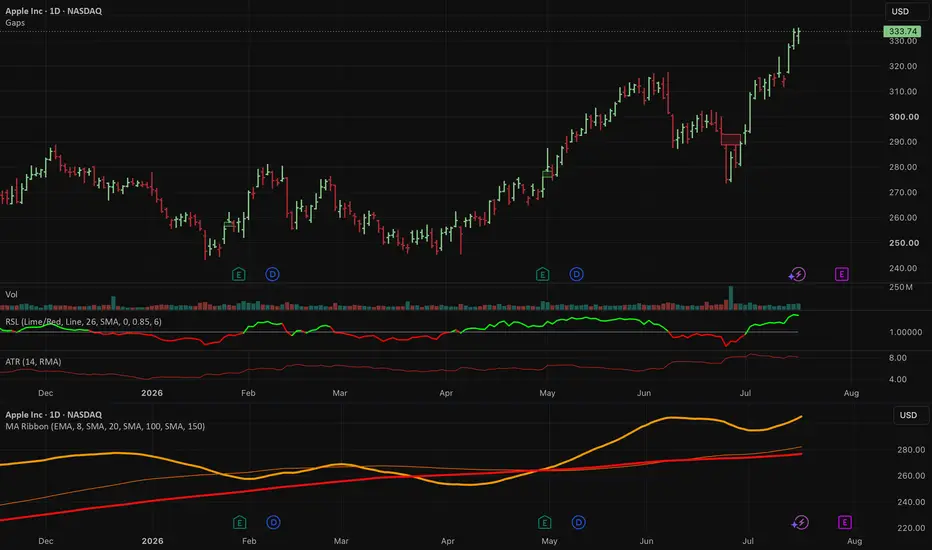
Long
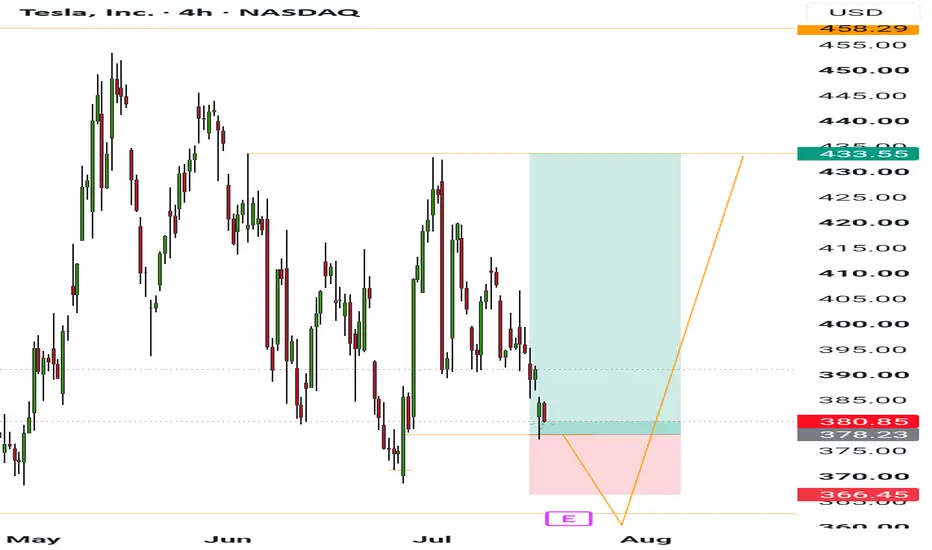
Long
The Amihud Illiquidity Ratio● 📊 Theoretical Foundation & Economic Origins
- The Amihud Illiquidity Ratio represents a seminal milestone in empirical asset pricing and quantitative market microstructure analysis.
- Introduced by Yakov Amihud in his landmark 2002 study, the metric directly addresses the fundamental relationship between expected asset returns and market illiquidity across temporal market horizons.
- Traditional financial economic models often operate under the idealized assumption of perfectly frictionless capital markets where assets can be exchanged instantaneously without impacting underlying quotes.
- Modern market microstructure reality demonstrates that transactions generate deterministic price impacts proportional to trade size, order book depth, and prevailing liquidity conditions.
- The core economic intuition relies on measuring price response per unit of order flow, effectively transforming raw transaction metrics into an absolute measure of market price elasticity.
- Price displacement in order-driven environments occurs as incoming aggressive market orders consume resting limit order liquidity across sequential price tiers in the order book.
- High illiquidity readings quantify a state of acute market fragility where small transaction volumes yield disproportionately large price dislocations and structural gaps.
- Low illiquidity values characterize deep, resilient order books capable of absorbing institutional-scale block trade flows with minimal price friction and tight bid-ask spreads.
- Understanding illiquidity as an independent asset pricing factor allows quantitative practitioners to distinguish between genuine structural price discovery and low-volume speculative noise.
- The broader economic framework demonstrates that market participants demand an illiquidity premium to compensate for inventory risk and transaction execution costs.
- By analyzing liquidity friction, traders gain structural insight into how institutional capital flows interact with resting supply and demand imbalances.
- This framework provides a rigorous foundation for identifying periods where market depth vanishes, exposing market participants to elevated execution risks.
● ⚙️ Quantitative Mechanics & Microstructure Architecture
- At its foundational core, the quantitative formulation calculates the ratio of an asset's absolute return to its concurrent financial trading volume over a defined observation window.
- Mathematically, the metric evaluates the absolute percentage price change divided by the total fiat or quote currency volume transacted across the identical candle period.
- By calculating absolute price returns, the metric remains indifferent to directional bias, focusing exclusively on the magnitude of price movement per unit of monetary turnover.
- Raw daily illiquidity ratios exhibit extreme statistical variance, severe positive skewness, and non-normal heavy-tailed distributions across volatile macroeconomic cycles.
- To construct a robust, actionable trading utility, the underlying engine incorporates rolling moving averages and statistical standardization techniques.
- Standardizing the metric via rolling Z-score transformations normalizes raw outputs against historical baseline distributions, enabling cross-asset comparability.
- The calculation engine evaluates volume displacement strictly on fully closed historical bars to eliminate intra-bar shifting and guarantee zero-repainting stability.
- High structural values indicate that liquidity providers have withdrawn bids and offers, leaving wide spreads, thin market depth, and high execution friction.
- Low structural values reflect sustained institutional participation, where primary market makers maintain tightly clustered limit orders absorbing localized imbalances.
- Volatility clustering phenomena frequently coincide with severe illiquidity regimes, creating compound risk states for automated execution strategies.
- The metric acts as a real-time elasticity gauge, illuminating whether price expansions represent true institutional accumulation or low-liquidity vacuums.
- Integrating volume turnover ensures that price movements are evaluated relative to the actual financial energy expended to achieve that displacement.
- The quantitative model transforms raw price-volume mechanics into a clear indicator of structural order book health and market absorption capability.
● 🧠 Psychological Architecture & Participant Behavior
- The implementation of a quantitative liquidity framework is as much an exercise in psychological discipline as it is in mathematical microstructure analysis.
- Human cognition is inherently flawed when processing probabilistic outcomes, frequently leading traders to commit cognitive errors during market illiquidity spikes.
- Retail market participants consistently fall prey to action bias, attempting to execute trades during rapid volatility expansions without assessing underlying order book depth.
- When illiquidity spikes, wider bid-ask spreads and severe execution slippage trigger emotional panic, causing participants to abandon predefined risk parameters.
- The psychological burden of illiquidity manifests as unexpected adverse selection, where market orders fill at worst-case boundary prices far beyond initial estimates.
- Maintaining emotional neutrality requires clear visibility into whether price momentum is backed by institutional depth or driven by thin market vacuums.
- Misinterpreting low-volume price spikes as authentic institutional breakouts represents one of the most persistent emotional traps in modern active trading.
- Illumination of market depth friction mitigates emotional FOMO by warning practitioners when market conditions favor capital preservation over aggressive entry.
- Rational trade selection relies on identifying environments where deep order books provide a defensive structural buffer for logical stop-loss placement.
- Systematically tracking illiquidity fosters algorithmic patience, aligning participant actions with high-probability institutional accumulation and distribution phases.
- Overcoming cognitive biases requires shifting focus from simple price patterns to the underlying microstructure health that governs execution outcome distributions.
- Establishing quantitative rules based on market elasticity protects traders from impulsive decision-making during chaotic, low-liquidity market regimes.
● 🏛️ Institutional vs. Retail Execution Perspectives
- Institutional asset managers operate under strict capital allocation mandates where trade execution efficiency directly impacts net portfolio alpha.
- Large institutional orders cannot be executed via naive market orders without provoking catastrophic self-inflicted market impact and severe negative slippage.
- Institutional quantitative desks actively model liquidity ratios to schedule algorithmic execution algorithms across fragmented liquidity venues.
- When institutional metrics reveal elevated illiquidity, automated execution algorithms automatically scale down order velocity or pause execution routines.
- Retail participants, trading smaller lot sizes, frequently operate under the false assumption that financial market execution liquidity is infinite and static.
- Retail traders regularly execute market orders during illiquid vacuum windows, absorbing the negative expected value of institutional spread capture strategies.
- By integrating institutional-grade liquidity metrics, retail traders gain structural visibility into the mechanical operational reality of professional market makers.
- Evaluating liquidity through an institutional lens transforms trade evaluation from superficial chart reading to sophisticated microstructure analysis.
- Understanding institutional execution constraints allows individual traders to align their entries with genuine liquidity pools rather than illiquid traps.
- Recognizing where institutional algorithms pause or accelerate provides a significant structural edge in predicting short-term price dynamics.
- Bridging the information gap between institutional market makers and retail participants is essential for navigating modern, highly automated financial markets.
● 🔄 Strategic Variance Across Market Regimes
- The diagnostic utility of the illiquidity framework undergoes structural shifts depending on prevailing macroeconomic market regimes and volatility cycles.
- In Trending Regimes, sustained directional progression accompanied by consistently low illiquidity readings confirms broad-based institutional participation and deep order books.
- Conversely, a trending market experiencing sudden spikes in illiquidity warns of structural fragility, signaling an impending trend exhaustion phase or vacuum sweep.
- In Ranging Regimes, low illiquidity readings near consolidation boundaries suggest quiet institutional accumulation or distribution in anticipation of expansion.
- High illiquidity readings at range boundaries highlight false breakout attempts driven by retail stop-sweeps in thin, illiquid order book conditions.
- In High Volatility Regimes, market makers aggressively widen quotes or pull resting limit orders, leading to exponential spikes in measured illiquidity.
- Recognizing high-volatility illiquidity surges protects quantitative systems from entering positions when execution costs exceed mathematical statistical edges.
- Cross-regime adaptability ensures that risk parameters dynamically loosen or tighten based on real-time empirical liquidity states rather than static assumptions.
- Analyzing regime-specific liquidity dynamics prevents traders from applying uniform entry rules to fundamentally different market microstructure states.
- Quantitative evaluation across distinct market phases builds a robust framework capable of maintaining structural performance through changing volatility cycles.
● 🛡️ Risk Management & Probability Philosophy
- The foundational philosophy of quantitative risk management dictates that position sizing must account for asset illiquidity alongside classical price volatility.
- Standard deviation and value-at-risk models severely underestimate downside risk when applied to assets prone to periodic liquidity freezes and gap events.
- The integration of the Amihud metric establishes a dual-variable risk matrix combining volatility metrics with real-time liquidity absorption capacity.
- As illiquidity metrics escalate beyond statistical normative thresholds, quantitative position sizing algorithms proportionally reduce capital exposure.
- Protecting capital against tail-risk events requires establishing hard operational halts during extreme statistical illiquidity outliers.
- Probability distributions of financial asset returns exhibit fat tails precisely during liquidity crisis events where market depth vanishes completely.
- Incorporating liquidity friction into historical backtesting engines prevents the publication of overly optimistic, unrealizable theoretical strategy returns.
- Systematic risk management framework treats liquidity not as a constant, but as a dynamic variable directly dictating maximum tolerable exposure.
- Aligning risk parameters with microstructure health ensures that trading strategies remain resilient during sudden market panics and liquidity crunches.
- Understanding the mathematical limits of execution protects capital from unexpected structural market failures and extreme execution drag.
● 🛠️ Practical Application & Indicator Features
• Microstructure Engine
- Calculates real-time absolute price displacement normalized by consolidated financial turnover.
- Implements adaptive rolling historical windows to dynamically contextualize current illiquidity readings against past market regimes.
- Eliminates intra-bar repainting by locking structural calculations exclusively to fully closed historical candle intervals.
- Processes raw tick and volume inputs to generate high-fidelity elasticity metrics across any financial instrument.
• Statistical Normalization & Z-Scores
- Converts raw ratio values into standardized Gaussian Z-Scores for objective cross-asset evaluation and thresholding.
- Highlights statistical upper-tail anomalies representing acute liquidity contractions and severe execution risk zones.
- Provides customizable lookback periodicities to align calculation windows with multi-timeframe systematic strategies.
- Smoothes statistical noise without introducing destructive lag into the microstructure signal pipeline.
• Dynamic Liquidity Thresholds
- Visualizes adaptive baseline bands separating liquid market regimes from fragile, low-volume operational states.
- Generates clear visual visual signals when price moves occur in thin order book environments lacking institutional backing.
- Features configurable smoothing algorithms including exponential, simple, and volume-weighted moving baselines.
- Allows traders to establish dynamic risk filters based on real-time statistical deviations from historical norms.
• Multi-Timeframe Confluence Analytics
- Evaluates higher-timeframe illiquidity metrics to ensure lower-timeframe execution aligns with macro liquidity trends.
- Helps traders avoid taking intraday setups during macro higher-timeframe liquidity dry-spells and vacuum regimes.
- Integrates seamlessly across diverse asset classes including equities, foreign exchange, commodities, and digital assets.
- Delivers a unified overview of structural liquidity conditions across multiple operational timeframes.
• Alert & Execution Integration
- Provides configurable alerting thresholds triggered on statistical illiquidity breakouts and normalization sweeps.
- Delivers real-time execution warnings when market conditions cross predefined mathematical risk thresholds.
- Enables seamless integration into quantitative execution workflows to automatically filter trade signals during illiquid states.
- Designed for systematic traders who require objective, real-time feedback on market microstructure health.
Based on the concepts previously discussed, the Amihud Illiquidity Ratio indicator was developed to reflect the academic and technical principles outlined in this article.
● ⚠️ Risk & Educational Disclaimer
- Technical analysis indicators and quantitative metrics based on historical price and volume data are provided strictly for educational and analytical purposes.
- The Amihud Illiquidity Ratio is an empirical statistical metric and does not constitute financial advice, investment recommendations, or trade guarantees.
- Past market performance, liquidity metrics, and historical statistical correlations do not guarantee or predict future market behavior or execution outcomes.
- Trading financial instruments involves substantial risk of loss, including the potential loss of initial principal capital due to slippage and market gaps.
- Users are fully responsible for evaluating their individual financial situation, risk tolerance, and trading systems prior to deploying real capital in live markets.  Education
 Short
Short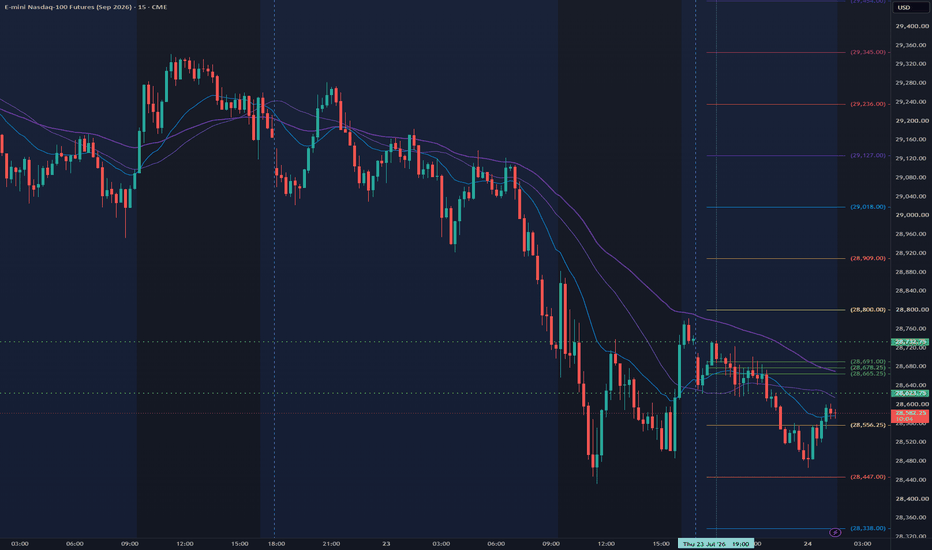
The war against oil countries is a trend. Oil is ready to go UP! Imagine that the tap from which oil flows for the whole world begins to be gradually turned off. What will happen to the price? She will start to grow.
This is exactly what may be happening now. Military conflicts affect regions that play a huge role in global oil exports. The higher the risk of supply disruptions, the more the market factors a possible shortage into the price of oil BLACKBULL:BRENT
Why is this important?
It's very simple...
The price of any product depends on two things:
How many people want to buy it (demand).
How much can it be sold (offer).
If supply decreases and demand remains high, the price usually rises.
Now several factors can reduce supply:
1) military operations in the Middle East, including Iran, Iraq, Saudi Arabia, UAE, Kuwait, Bahrain;
2) sanctions and risks for Russian exports;
3) possible disruptions to important shipping routes through which a significant portion of the world's oil passes. Even the threat of such disruptions can raise prices.
Investment idea:
If geopolitical tensions persist or intensify, oil could continue to rise. Along with it, oil stocks and the energy sector often benefit.
Of course, this is not a guarantee. If conflicts begin to be quickly resolved or oil production increases in other countries, prices could decline.
Therefore, such a scenario should be considered as one of the possible investment ideas, and not as an inevitable outcome.
💡 Conclusion: when the world risks losing part of its oil supply, the market begins to anticipate a possible shortage. That is why experienced investors closely monitor not only charts, but also world news.
On my channel in Tradingview you can find many educational posts that will improve your trading results.  Long
Long
EURUSD - Can the ECB Kickstart FX Volatility?EURUSD has been trading in a relatively tight range so far this month, moving between a low of 1.1376 seen on July 14th and a high of 1,1483 touched on July 15th. The lack of volatility could be put down to drifting differentials between the ECB and Fed interest rate outlooks, which have been impacted equally by the changing geopolitical environment in the Middle East, as the Iran Conflict evolves from an agreed ceasefire, to escalation and a resumption of hostilities, which have pushed energy prices back up to levels seen in early June. Perhaps unsurprisingly against this backdrop, EURUSD prices are currently trading at 1.1425 at the time of writing (0645 BST), slap bang in the middle of the July range!
However, FX volatility could pick up later as the ECB announce their next interest rate decision at 1315 BST, and then ECB President Christine Lagarde holds her usual press conference at 1345 BST. The current expectation of analysts and economists seems to favour the ECB keeping rates on hold to consider the impact of war in the Middle East, so anything else may be seen as a major surprise. If the consensus is correct, EURUSD volatility could pick up when Madame Lagarde starts to comment in the press conference on the outlook for Eurozone growth and inflation, surging energy prices and whether market expectations for a further rate hike in September are reasonable or off base.
In an environment like this, where a major event looms at a time of constricted volatility, the potential for surprises which may lead to outsized directional moves can increase, so keeping apprised of the latest technical setups and levels to monitor ahead of time could be useful preparation.
Technical Update: Will the Current Downtrend Continue or Reverse?
As we approach the ECB rate announcement (1315pm BST) and press conference (1345 BST), traders could be wondering how EURUSD will fare and if the potential for increased price volatility may see a more extended phase of price movement.
Looking at the chart below, it appears as if more negative sentiment has been evident since the January 27th high (1.2082), where any price recovery has failed below the previous recovery peak, and has then been followed by selling pressure strong enough to break below the previous price low. This is the basic definition of a downtrend.
Of course, just because there has been negative sentiment in the run-up to the latest ECB decision, doesn’t mean it will continue after. The reaction to today’s news could just as easily see price strength emerge again, so being aware of both key support and resistance levels may prove useful to help determine where the next directional themes could lie.
Potential Resistance Levels:
Against a negative sentiment backdrop and a pattern of lower price highs, traders may focus on the last failure high as the first potential resistance area. In the case of EURUSD, the last high stands at 1.1483, posted on July 15th, and closing breaks above this level may be required to open the possibility for positive momentum emerging again.
If 1.1483 were to give way on a closing basis, attention could shift toward 1.1525, which is the 38.2% Fibonacci retracement level. A closing break above 1.1525 may then open scope toward 1.1586, the higher 50% level and possibly even 1.1648, the 61.8% retracement.
Potential Support Levels:
In terms of key support levels to monitor, the most recent price low from which attempts at strength have developed is 1.1376, registered on July 14th.
[/image
If volatility were to increase, a break below this level on a closing basis could lead to further declines to test the next potential support at 1.1324, which is the June 24th low. If this level is in turn broken on a closing basis, it could lead to continued price weakness that could open the way for eventual moves toward 1.1211, the low from May 29th 2025.
The material provided here has not been prepared accordance with legal requirements designed to promote the independence of investment research and as such is considered to be a marketing communication. Whilst it is not subject to any prohibition on dealing ahead of the dissemination of investment research, we will not seek to take any advantage before providing it to our clients.
Pepperstone doesn’t represent that the material provided here is accurate, current or complete, and therefore shouldn’t be relied upon as such. The information, whether from a third party or not, isn’t to be considered as a recommendation; or an offer to buy or sell; or the solicitation of an offer to buy or sell any security, financial product or instrument; or to participate in any particular trading strategy. It does not take into account readers’ financial situation or investment objectives. We advise any readers of this content to seek their own advice. Without the approval of Pepperstone, reproduction or redistribution of this information isn’t permitted.
Short 
Long 
 Long
Long
Short 
COIN GEX - Breakout Above 170, Potential Gamma SqueezeCOIN printed a double bottom on the daily chart, then reclaimed structure and cleared 170 – C1 / Ab1 . Spot is now near 180.50 , holding above the former Call Wall.
With 170 accepted, price has entered the positive gamma extension zone — gamma squeeze potential opens toward the 200 multi-metric cluster if momentum holds.
🔶 Regime Context 🔶
Price is trading well above HVL 155 , keeping COIN inside a positive GEX regime . The double bottom below, then the push back through HVL and into a C1 clear, frames this as a structural reclaim — not a random spike.
🔶 Options Structure Context 🔶
👉 170 – C1 + Ab1 — highest call wall + largest absolute gamma; cleared, now the breakout reference that must hold
Confluence at 170:
C1 — highest call NETGEX
Ab1 — largest absolute gamma
That makes 170 a clear reaction zone — clearing it is what can trigger a potential gamma squeeze .
👉 200 – nCV + COI + AbOI — next overhead magnet
Confluence at 200:
nCV — strongest net call volume
COI — highest call open interest
AbOI — highest absolute open interest
Together, 200 is a call-inventory and call-flow cluster — the natural squeeze target if extension holds.
🔶 Downside Structure 🔶
👉 170 – C1 / Ab1 — first line that must hold for the squeeze thesis
👉 155 – HVL — regime pivot; loss of HVL would weaken the positive-regime read
👉 140 – P1 — strongest put wall / downside floor
🔶 Options Sentiment 🔶
CALL$ 84.5% means call options at an equivalent distance from spot are priced 84.5% higher than the corresponding puts — this is elevated call pricing skew .
On the Options Oscillator, the filled green histogram remains elevated at the right edge — call pricing skew is still strong, not fading.
IVRank 77.2
IVx 86.2
CALL$ 84.5% — call pricing skew
Implied move ±6.27% (±11.3)
Price is also reclaiming the 50 SMA area, while the declining 200 SMA sits near the 200 confluence — technical overhead aligned with the options cluster.
🔶 Key Structure to Watch 🔶
170 — C1 + Ab1 cleared; must hold
200 — nCV + COI + AbOI squeeze magnet
155 — HVL / regime pivot
140 — P1 put wall
For now, COIN is a double-bottom reclaim + C1/Ab1 clear setup, with squeeze potential toward 200 .
The key question is whether price can hold above 170 and extend toward 200 — or whether the Call Wall rejects and sends the move back toward HVL 155 .  Long
Long
XRP Price Prediction Today: Can Bulls Break $1.20XRP price today is trading above $1.10 after gaining nearly 4%, while Bitcoin has climbed back above $65,000. The recent recovery has improved market sentiment, but XRP still needs to move above $1.20 to confirm a stronger uptrend.
The $1.20 level has acted as a strong resistance in recent weeks.
According to analyst, a sustained move above this level could push XRP toward the next resistance zone between $1.24 and $1.28. A break above $1.29 would strengthen the bullish trend.
On the downside, XRP needs to stay above $1.13 to maintain the current recovery. A drop below $1.10 could erase recent gains.
XRP Price Rises as Funding Rates Fall
One unusual signal during the latest rally is the sharp drop in XRP funding rates.
Funding rates fell 240% in one day, even as XRP moved above $1.13. At the same time, trading volume increased 64% over the past 24 hours.
This suggests the price increase is being supported by spot buying rather than excessive leveraged trading, making the move appear healthier than a leverage-driven rally.
Whale Buying Continues
Large XRP holders added around 70 million XRP during the recent price recovery. Despite this accumulation, XRP has remained below $1.20, showing that buying pressure has not yet been strong enough to trigger a larger breakout.
Network Activity Remains Weak
Active XRP addresses have dropped to around 20,000, the lowest level in nearly a year. Lower network activity suggests fewer users are currently interacting with the XRP Ledger, even as the price attempts to recover. At the same time, new capital entering XRP remains limited, which has slowed upward momentum.
Key XRP Price Levels
$1.10 – Major support
$1.13 – Short-term support
$1.20 – Key resistance
$1.24-$1.28 – Next resistance zone
$1.29 – Level that could open the way for a stronger rally
XRP has started to recover, supported by higher trading volume and continued accumulation by large holders. However, the price remains below its key resistance, network activity is near a one-year low, and fresh buying remains limited. Holding above $1.13 and breaking $1.20 will be the next important signals to watch.  Short
Short
Alphabet – Can Earnings Volatility See a Range Breakout?Alphabet reports its earnings after the market close on Wednesday at a pivotal time in an on-going debate amongst retail traders and investors, over whether the AI trade is a bubble that is starting to deflate or is just taking a breather before initiating its next leg higher.
Alphabet, the owner of Google, is known as a hyperscaler, a company that operates a huge global cloud computing infrastructure. Its Google cloud platform is one of the giants powering the world’s AI, data and internet services, alongside Amazon Web Services (AWS) and Microsoft Azure. More importantly, it’s the first of these key companies to report its earnings. With traders extremely sensitive to levels of AI capital expenditure and on red alert for any signs suggesting this huge spending is starting to generate some significant returns, the outcome of this event could be important, not just for the Alphabet shares but also short-term sentiment toward the entire market.
The Alphabet share price topped at an all-time high of 404.38 on May 18th and has since been range trading between a low of 333.20 hit on June 26th and a high of 374.23 briefly seen on Thursday July 16th, before jitters resurfaced surrounding the AI model released by Chinese startup Moonshot, which saw prices drop back down to a low of 345.51 at the Friday close. However, at the start of this week, the Alphabet price has since rebounded to trade back at 353.15 ahead the company’s earnings release tomorrow.
Interestingly, with so much potential for price volatility resting on the outcome of these earnings, the technical outlook provides a key snapshot of the important levels traders may find useful to monitor, depending on how far the Alphabet results and management guidance deviate from market expectations.
Technical Update: Range Activity Builds Ahead of Earnings between 333.20 and 377.83.
The important focus for Alphabet this week is the release of its latest earnings report after the close on Wednesday and the potential for increased volatility that could result.
As the chart above shows, the earnings data could be important for the Alphabet stock price, with potential for more prolonged directional phases of price activity developing, especially as recent moves have seen prices confined within a sideways range between 333.20 (June 26th low) and 377.83 (61.8% retracement).
We discuss the technical outlook below and attempt to identify the key support and resistance levels that may become relevant if a breakout was to occur.
Potential Resistance Levels:
It appears that the Bollinger mid-average currently at 353.15 could represent the first resistance level this week. How this level is defended on a closing basis may be a gauge on short term price activity. If the Alphabet stock price was to close above 353.15 further upside strength may ensue, but while it caps prices, downside pressure may continue to materialise.
As the chart below shows, if the Alphabet share price were to close above 353.15, it could open potential to test 377.83, which may mark the upper extremes of the current sideways range. 377.83 is equal to the 61.8% retracement level calculated from the May high to June low and could be the key resistance to monitor.
If closes in price are seen above the resistance at 377.83 this week, it might suggest scope for moves to higher levels. This could shift the focus towards 389.63, which is equal to the May 27th high, even on towards 404.38, the May 18th upside extreme.
Potential Support Levels:
While the mid-average resistance at 353.15 continues to cap prices on a closing basis, the risk of further downside pressure may increase. This could shift the focus for traders toward a key support at 333.20 (June 26th session low), which could highlight the current lower range extreme.
A closing break below 333.20 may open potential for further declines to 322.85, which is the 61.8% retracement level (March low to May high). A closing break below 322.85 could see moves extend toward 309.44, which is the April 9th session low.
The material provided here has not been prepared accordance with legal requirements designed to promote the independence of investment research and as such is considered to be a marketing communication. Whilst it is not subject to any prohibition on dealing ahead of the dissemination of investment research, we will not seek to take any advantage before providing it to our clients.
Pepperstone doesn’t represent that the material provided here is accurate, current or complete, and therefore shouldn’t be relied upon as such. The information, whether from a third party or not, isn’t to be considered as a recommendation; or an offer to buy or sell; or the solicitation of an offer to buy or sell any security, financial product or instrument; or to participate in any particular trading strategy. It does not take into account readers’ financial situation or investment objectives. We advise any readers of this content to seek their own advice. Without the approval of Pepperstone, reproduction or redistribution of this information isn’t permitted.
Long 
Advanced GARCH Volatility Analysis● 🏛️ The Conceptual Origin
- The evolution of quantitative financial modeling has long grappled with the inherent instability of market variance, an observable phenomenon where periods of high turbulence cluster sequentially before dissipating into compression phases.
- Traditional analytical paradigms frequently assume a constant variance over time, a critical flaw that consistently fails to capture the true microstructural realities of modern order flow, algorithmic liquidity provision, and sudden institutional intervention.
- The Generalized Autoregressive Conditional Heteroskedasticity (GARCH) methodology emerged from the strict academic necessity to map these non-linear variances, providing a dynamic framework that respects the shifting gravitational pull of market sentiment.
- By anchoring this autoregressive logic strictly to volume anomalies rather than mere price derivation, the resulting architecture constructs a multi-dimensional perspective of market participation, completely insulating the analyst from the noise of low-volume manipulation tactics.
- This conceptual foundation dictates that every expansion in volatility carries a memory footprint, echoing through subsequent trading sessions and predictably altering the threshold for future price discoveries.
• The Heteroskedastic Reality
- Acknowledging that volatility is strictly conditional and time-dependent allows the algorithmic framework to move far beyond the lagging, static nature of traditional standard deviation metrics.
- The engine meticulously evaluates the residual statistical errors from past structural price action, treating historical volatility shocks as foundational baseline metrics for anticipating future systemic expansions.
- By abstracting the underlying mathematics away from public view, the integrity of the predictive variance models remains intact, ensuring that reverse-engineering attempts fall short of capturing the true alpha-generating mechanisms.
- Integration with absolute confirmed-bar evaluation logic ensures that historical mapping remains permanently fixed upon bar close, eradicating any possibility of historical signal repainting or real-time illusion.
● 📈 Narrative Technical Analysis
- When deploying this framework across live market environments, the narrative of price action transforms from a chaotic sequence of ticks into a highly legible auction process governed by volume-weighted boundaries.
- As price approaches significant liquidity pools, the volumetric volatility calculations act as an early warning system, highlighting the specific threshold where passive resting orders are overwhelmed by aggressive market execution.
- The system utilizes sophisticated structural regression milestones to identify where the current volatility regime deviates significantly from its historical autoregressive mean.
- Consolidation box mapping becomes highly contextualized; instead of merely viewing a range as sideways price movement, the analyst views it as a pressurized environment where the conditional variance is rapidly decaying, signaling an imminent and violent expansion.
- Volume profile anomalies are cross-referenced with the volatility outputs to validate whether a structural breakout is backed by genuine institutional commitment or is merely a low-participation retail trap designed to engineer liquidity.
• Confluence of Variables
- The true power of this analytical approach is fully realized when volumetric variance is analyzed in strict confluence with established Wyckoff mechanics, identifying accumulation and distribution phases through the lens of expanding or contracting variance.
- Market microstructure nuances, such as the speed of the tape and the density of the order book, are abstractly represented through the continuous rendering of the volatility baseline.
- Signal evaluation is strictly filtered by the dominant underlying trend regime, preventing the execution of mean-reversion tactics during periods of infinite directional variance.
- Every technical validation relies exclusively on confirmed data points, stripping away the visual clutter of standalone histogram layers and redundant bands to provide a clean, uncompromising view of the raw asset behavior.
● 🏢 Institutional vs. Retail Perspective
- The dichotomy between institutional operators and retail participants is most glaringly evident in their respective interpretations and applications of volatility data.
- Retail traders consistently view volatility as an unpredictable hazard, frequently tightening stops or exiting structural positions prematurely out of fear when market velocity abruptly increases.
- Conversely, institutional quantitative desks perceive volatility as the primary oxygen of the market, utilizing variance expansions as the optimal environment to offload massive inventory without incurring detrimental slippage.
- The GARCH-based volumetric approach aligns the user with the institutional mindset, quantifying the exact conditions under which smart money actively hunts for stop-loss liquidity to fill institutional-sized blocks.
- While the retail sector obsessively chases lagging moving average crossovers, the professional tier is actively calculating the probability of a variance shift, positioning themselves ahead of the inevitable momentum ignition.
• Asymmetric Execution Mechanics
- Institutional operators demand an asymmetric risk-to-reward ratio on every deployment, a standard that is mathematically impossible to achieve without a rigorous understanding of conditional heteroskedasticity.
- The model effectively highlights structural exhaustion points where the current volatility cycle has mathematically overextended its statistical boundaries, signaling a high-probability reversal zone.
- Retail traders often fall victim to the illusion of safety during low-volatility regimes, unaware that these exact conditions are being utilized by larger entities to build hidden, un-leveraged exposure.
- By stripping away lagging retail indicators, the framework focuses purely on the raw, undeniable footprint of institutional volume, mapping the true narrative of the financial auction process.
● ⚙️ Strategic Variance
- The operational application of this indicator must drastically shift in direct response to the overarching market environment, as variance models do not operate efficiently under a singular, rigid execution doctrine.
- During aggressively trending regimes, the baseline volatility metric will establish an elevated floor, indicating that pullback sequences should be treated as brief pauses in momentum rather than structural failures.
- Within ranging environments, the conditional variance will typically compress to historical lows, warning the analyst that mean-reverting strategies will eventually be decimated by the inevitable volatility breakout.
- High-volatility environments require a complete recalibration of structural targets; the expected range of price bars expands exponentially, demanding that the analyst widen structural invalidation levels to avoid being prematurely stopped out by algorithmic noise.
- The mathematical engine seamlessly transitions between these diverse states, continuously recalculating the autoregressive thresholds without requiring manual intervention from the operator.
• Environmental Adaptation
- The abstraction of complex algorithms ensures that the indicator dynamically adapts to shifting tick volume paradigms across differing asset classes, from high-beta equities to algorithmic forex pairs.
- Fixed, time-based segmentation drift is entirely eliminated by forcing all structural anchor points to lock precisely onto verified changes of character, ensuring that the analytical lens remains perfectly aligned with the market's true rhythm.
- False breakouts are systematically identified and ignored when the corresponding volumetric variance fails to breach the required quantitative threshold, preserving capital for legitimate structural shifts.
- The elimination of arbitrary manual anchor points guarantees that the output remains purely objective, preventing the analyst's cognitive biases from polluting the mathematical reality of the chart.
● 🧠 Psychological Architecture
- The implementation of a quantitative volatility framework is as much a rigorous exercise in psychological discipline as it is in applied mathematical analysis.
- Human cognition is inherently flawed when processing probabilistic outcomes, often heavily weighting recent emotional trauma over long-term statistical reality, leading to persistent hesitation during valid signal generation.
- The objective rendering of conditional variance serves as an essential psychological anchor, forcing the operator to acknowledge the absolute mathematical facts of the market rather than succumbing to fear or euphoria.
- By eliminating superficial chart chatter and focusing strictly on verifiable data, the framework actively dismantles the psychological hurdles associated with analysis paralysis.
- The trader is conditioned to view the market purely as an ongoing distribution of probabilities, recognizing that any single execution is entirely irrelevant within the grander scope of the statistical sample size.
• Cognitive Bias Mitigation
- Recency bias is aggressively counteracted by the indicator's deep historical memory, which continuously contextualizes current price action against years of underlying autoregressive data.
- Confirmation bias is neutralized through the strict requirement of volumetric validation; the operator cannot simply invent a bullish narrative if the underlying variance engine is definitively signaling a lack of institutional sponsorship.
- The absolute removal of predictive repainting logic guarantees that the analyst faces the harsh, unedited truth of their trading decisions, fostering an environment of ultimate accountability and continuous professional growth.
- Developing the mental fortitude to execute precisely when the market feels the most uncomfortable is the ultimate benchmark of a professional quantitative operator.
● 🎲 Risk & Probability Sagas
- The entire foundation of quantitative trading rests upon the mathematical philosophy of risk management, an absolute discipline that supersedes all forms of directional forecasting or fundamental analysis.
- Engaging with financial markets without a deep understanding of standard deviations and variance modeling is akin to navigating a hostile environment without a compass, guaranteeing eventual ruin through uncontrolled exposure.
- The framework explicitly visualizes the expanding and contracting nature of risk, allowing the operator to dynamically adjust their positional sizing in direct inverse proportion to the current volatility reading.
- A high-variance environment mathematically dictates a reduced position size, ensuring that the fixed percentage of capital at risk remains perfectly constant regardless of the width of the structural stop loss.
- Probability is not an abstract concept; it is a rigid, measurable reality that dictates the long-term survival of the trader, demanding absolute respect for the invisible boundaries of market distribution.
• The Mathematics of Survival
- The pursuit of alpha is entirely secondary to the preservation of initial capital; this engine is designed primarily as a defensive mechanism to keep the operator sidelined during low-probability, low-volume chop.
- Asymmetric execution requires that the potential reward is mathematically skewed to drastically outperform the initial risk outlay, a scenario that only presents itself when volatility transitions from compression to aggressive expansion.
- True professional longevity is achieved solely through the ruthless application of risk management parameters, refusing to compromise the statistical edge for the sake of emotional gratification.
- The final layer of risk architecture involves acknowledging the inherent limitations of any quantitative model, understanding that unprecedented tail-risk events can and will occur, demanding an unbreakable adherence to hard structural invalidation levels.
Based on the concepts previously discussed, the GARCH Volume Volatility indicator was developed to reflect the academic and technical principles outlined in this article.
● ⚠️ Professional Risk Warning
- The financial markets are inherently chaotic, and engaging in speculative trading involves a significant probability of capital loss, requiring absolute discretion and rigorous risk management protocols.
- Keep your language real when evaluating potential setups; it is imperative to remember that the future is fundamentally unknowable, and past results in no way guarantee future performance.
- No mathematical model, regardless of its autoregressive complexity or volumetric depth, can accurately predict unforeseen macroeconomic shocks or sudden liquidity vacuums.
- Ensure that capital deployment is strictly limited to funds that can be lost without impacting your primary livelihood, as the true nature of risk is ever-present and entirely unforgiving.
- Never infer past results will repeat in the future, and always base final execution decisions on a holistic confluence of independent technical and fundamental variables. Education 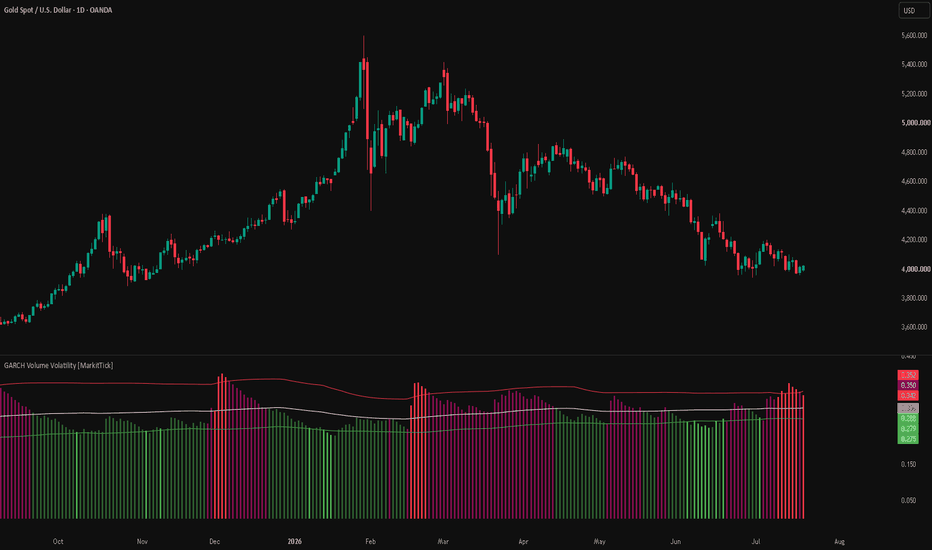
US 100 - Bubble Fears Are Back Driving SentimentA sell off in previously high-flying chip stocks was a key reason why the US 100 index dropped 3.9% last week from opening levels at 29800 on Monday down to a close of 28566 on Friday. Sentiment has turned down at the start of July as fears of an AI bubble resurface once more, repeating a pattern of risk on then off again that has been witnessed by traders in this very popular area of financial markets since the middle of last year.
Looking forward, the huge capital expenditure being committed to artificial intelligence by several of the world biggest companies and whether it’s generating commensurate revenue returns is once again being questioned just days before Tesla and Alphabet report their latest earnings on Wednesday (after close), and 10 days before Microsoft, Meta and Amazon provide their next updates. These stocks carry a large index weighting meaning their actual results, future revenue growth predictions and capital expenditure forecasts could contribute to outsized directional moves in the US 100 across this crucial two week period into the end of July.
The technical outlook is potentially flagging an interesting dynamic that may also be worth monitoring.
Technical Update: Downside Focus Potentially Shifting to Last Low at 28206
Since posting the all‑time high at 30776 on June 3rd, the US 100 index has traced out a period of choppy sideways activity, as a decision‑making process appears to have formed between buyers and sellers. The lower limits of this sideways pattern could be marked by 28206, the June 9th low, which has held throughout the recent consolidation pattern.
However, as the chart above shows, price weakness is currently emerging after a failure to breach previous session highs on a closing basis. This price action has created a series of lower highs, which could leave traders wondering if this type of price activity is an indication of negative sentiment emerging.
Within this backdrop, being aware of potential key support and resistance levels may prove useful to establish where the next directional risks could lie this week as the key risk events play out.
Potential Support Levels:
In technical analysis, if there is a suspicion of potentially negative weak tests of previous price highs, it is often the last correction low of the previous uptrend that becomes the key support focus for traders, as closing breaks below this level can lead to further price weakness.
In the case of the US 100 index, this dynamic could bring 28206, the June 9th downside extreme into play as this level may represent the last correction low and therefore may be the first key support focus for the coming week.
While not a guarantee of continued price declines, closing breaks below 28206 could open the way for further downside momentum to emerge. Such moves, if seen, could suggest scope toward 27696, which is the 38.2% retracement, possibly then the deeper 50% level at 26753.
Potential Resistance Levels:
Of course, the support at the 28206 low is currently still intact, and while this remains the case, it’s possible the choppy sideways range can extend further. If this is the case, closing breaks back above 29239, which is equal to the 38.2% Fibonacci retracement of the latest decline, may be required to open potential for a push to higher levels.
Closing breaks above 29239 could be viewed as an indication of upside re‑emerging. If this is the case, risks may shift toward further price strength to test the next resistance at 29434, the current level of the Bollinger mid‑average, and if this is also breached, on toward 29791, the higher 61.8% retracement level.
The material provided here has not been prepared accordance with legal requirements designed to promote the independence of investment research and as such is considered to be a marketing communication. Whilst it is not subject to any prohibition on dealing ahead of the dissemination of investment research, we will not seek to take any advantage before providing it to our clients.
Pepperstone doesn’t represent that the material provided here is accurate, current or complete, and therefore shouldn’t be relied upon as such. The information, whether from a third party or not, isn’t to be considered as a recommendation; or an offer to buy or sell; or the solicitation of an offer to buy or sell any security, financial product or instrument; or to participate in any particular trading strategy. It does not take into account readers’ financial situation or investment objectives. We advise any readers of this content to seek their own advice. Without the approval of Pepperstone, reproduction or redistribution of this information isn’t permitted. Long 
 Long
Long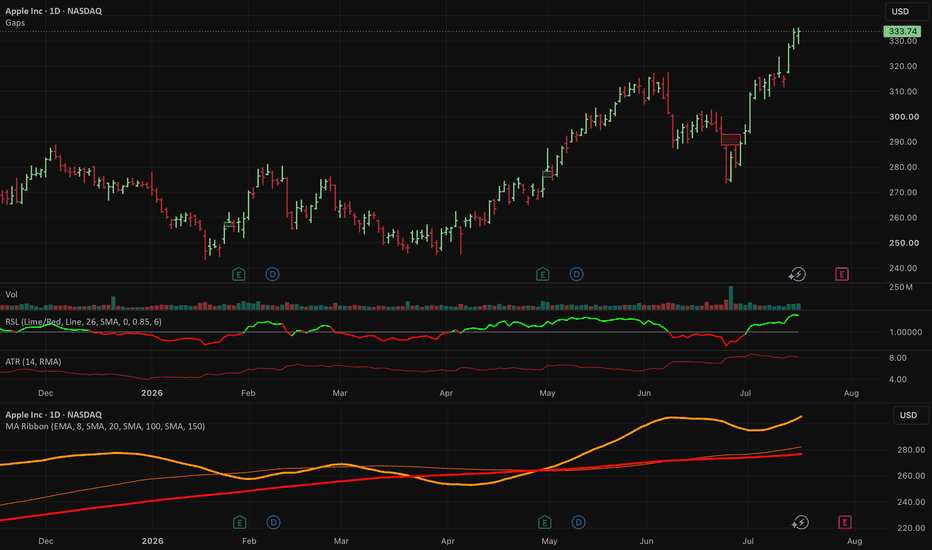
Weekly Review: Acceptance (with emerging short-term stress)--- TradingView Chart Processed by TradeSentinel AI ---
The primary regime remains Acceptance, but this week introduced the first meaningful signs of internal pressure after several weeks of healthy participation.
The evidence is not yet consistent with structural deterioration, but it is no longer a one-sided expansion.
1️⃣ What is it today?
The market remains in an Acceptance regime, but this week introduced the first meaningful signs of internal fatigue. Price pulled back, volatility picked up, and short-term participation narrowed, while the long-term structure remains intact.
2️⃣ Thesis
This looks more like a healthy cooling phase than a structural breakdown. Long-term breadth remains strong and volatility is still below the stress threshold, but momentum has become more selective. Leadership is narrowing, particularly within the Nasdaq.
3️⃣ What validates the thesis?
VIX/VIX3M remains below 1.0, indicating no confirmed stress regime.
Around two-thirds of S&P 500 stocks remain above their 200-day moving averages, supporting the longer-term trend.
NYSE new highs continue to outnumber new lows.
The broader uptrend is still intact despite the weekly decline.
4️⃣ What invalidates the thesis?
VIX/VIX3M rising above 1.0 and remaining there.
Continued contraction in stocks above their 20-day averages.
Nasdaq leadership deteriorating further, with expanding new lows.
Multiple weeks where price advances but breadth continues to weaken.
-----
Trade Implications
Lean Into
Existing leaders that continue holding above key moving averages.
Stocks showing independent relative strength despite the broader pullback.
Strong trends that are consolidating rather than breaking.
Watch Closely
Whether Nasdaq breadth begins repairing over the coming week.
Whether VIX/VIX3M falls back below ~0.85, indicating renewed volatility normalization.
Expansion in new highs after this pullback.
Risk Signals
A sustained move of VIX/VIX3M above 1.0.
Continued deterioration in % of stocks above the 20-day moving average.
Nasdaq new lows continuing to expand while price attempts new highs.
Current Bias
This remains a buy-the-pullback environment, but with greater selectivity than in recent weeks. Position sizing should reflect the increase in short-term uncertainty until breadth begins to improve again. Short 
Bitcoin Rebounds off Long Term Support, can the Rally continue?Bitcoin has risen 1.16% this week, keeping the world’s biggest cryptocurrency on course to register its third weekly gain in a row, something it hasn’t achieved since April. This price action could be an on-going response to its test of long-term technical support at 57,866 (see main chart) in early July, from which dip buyers reappeared taking the price up 12.5% from its low at 57699 (July 1st) to the current level around 64,900 at the time of writing (0645 BST).
From a macro perspective this week, Bitcoin prices may have found support from a recovery in general risk sentiment as cooler than expected US inflation prints on Tuesday and Wednesday, have seen market concerns regarding a Federal Reserve rate hike at their next meeting on July 29th reduce significantly, despite Fed Chair Kevin Warsh commenting in his testimony to Congress on Tuesday that one month of lower US inflation prints is not enough to confirm the Fed’s job to cap rising prices is done.
Looking forward, traders may be focusing on the direction geopolitical risks in the Middle East take moving into early next week. Assessing these developments against the current technical backdrop, which is outlined below, to determine whether the current Bitcoin rally has further to run.
Technical Update: Back to Important Long Term Technical Support:
Bitcoin has fallen more than 54% from the October 2025 all‑time high at 126,304 into the June 2026 low of 57,699, leaving a negative momentum backdrop and pattern of lower highs and lower lows. Traders tend to view this as a downtrend in price, with risks for further extension if sellers remain evident. However, as the weekly chart below highlights, the decline has recently tested what may be an important longer‑term support area.
This potential support sits at 57,866, which is the 61.8% Fibonacci retracement of the rise from September 2023 to October 2025. In technical analysis, the 61.8% level is often viewed as the most important Fibonacci retracement, because if prices close below the identified retracement level, it may lead to an extended period of price weakness, possibly moving all the way down to where the price strength began. In the case of Bitcoin, it’s perhaps not surprising that a bounce has materialised after 57,866 was tested.
Looking forward, traders could now be trying to establish where key support and resistance levels sit to gauge whether the Bitcoin rally could extend, or if the downtrend may resume.
Potential Support Focus:
We have suggested that the 61.8% retracement level at 57,866 could be a key long‑term support, however moving to the daily chart (see below) shows closer support levels that may need to give way on a closing basis if prices are to eventually retest 57,866 again.
While uncertainty amongst traders regarding the Iran conflict on Monday did bring renewed selling pressure for Bitcoin this week, it was the rising Bollinger mid‑average, currently at 62,497, that held and helped to spark the latest phase of price strength. This may mean that closes below 62,497 could open potential tests of the next support at 61,254, which is the July 6th low and rally point. If that level were also broken, risks could shift again toward the 57,866 retracement level. Ultimately, it may prove to be closes below 57,866 that lead to further price declines.
Potential Resistance Focus:
While short term support at 62,497 remains intact, Bitcoin could keep trying to extend its current recovery. However, the latest price strength has been capped by resistance at 65,558, which is the June 22nd high. If Bitcoin is going to build fresh upside momentum, traders could be watching this level, as breaks above it may be viewed as a sign the market may be attempting to move higher again.
Breaks above 65,558, as the daily chart above shows, could see focus shift to 67,425, which is the 38.2% Fibonacci retracement of the decline from May 5th to July 1st. If Bitcoin closes above 67,425, it may then have room to move toward 70,259, the 50% retracement, and possibly even 73,236, the higher 61.8% Fibonacci level.
The material provided here has not been prepared accordance with legal requirements designed to promote the independence of investment research and as such is considered to be a marketing communication. Whilst it is not subject to any prohibition on dealing ahead of the dissemination of investment research, we will not seek to take any advantage before providing it to our clients.
Pepperstone doesn’t represent that the material provided here is accurate, current or complete, and therefore shouldn’t be relied upon as such. The information, whether from a third party or not, isn’t to be considered as a recommendation; or an offer to buy or sell; or the solicitation of an offer to buy or sell any security, financial product or instrument; or to participate in any particular trading strategy. It does not take into account readers’ financial situation or investment objectives. We advise any readers of this content to seek their own advice. Without the approval of Pepperstone, reproduction or redistribution of this information isn’t permitted.