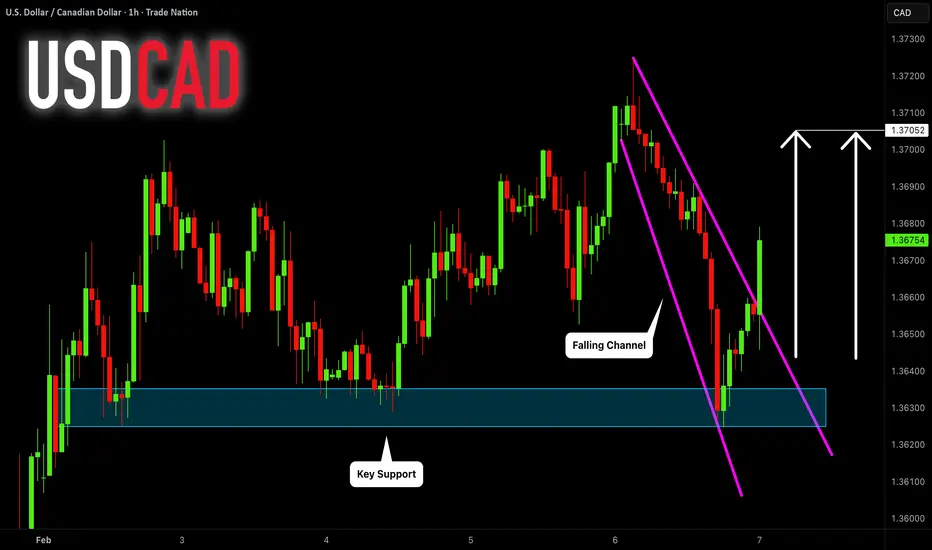
USDCAD: Bullish Outlook Explained 🇺🇸🇨🇦
USDCAD will likely continue rising on Monday, following
a confirmed breakout of a resistance line of a falling channel.
The violation occurred after a test of a strong intraday support.
Expect a rise at least to 1.704 level.
❤️Please, support my work with like, thank you!❤️
I am part of Trade Nation's Influencer program and receive a monthly fee for using their TradingView charts in my analysis.
Wedge
EURJPY: Bullish Trend Continuation 🇪🇺🇯🇵
EURJPY will like continue rising, following a confirmed breakout
of a resistance line of a bullish flag pattern.
Next goal is 185.8
❤️Please, support my work with like, thank you!❤️
I am part of Trade Nation's Influencer program and receive a monthly fee for using their TradingView charts in my analysis.
02/04 OKLO Long - Possible reversal Hello everyone
Hope you’re holding up well amid the current market volatility.
We’re near a market top, so risk management has to come before profits. In my recent posts, I focused mainly on individual stocks' technicals and didn’t fully account for the broader market—fair point.
That said, OKLO currently offers a solid risk-reward setup with a very tight stop. It’s down about 17% today, and we could see a technical rebound from here. If it breaks the current level (the wedge trendline), I’ll
Coiling Like a CobraBeen tracking this textbook distribution since November and it appears that the market is coiling its way toward an explosive move. I personally have successfully traded the past few months like a protracted “short every bounce” opportunity and will continue to execute on my bearish corrective thesis until proven otherwise.
As a newer retail trader without decades of experience in weathering myriad market conditions, I did not possess the insight that I now have when the 2022 correction occurre
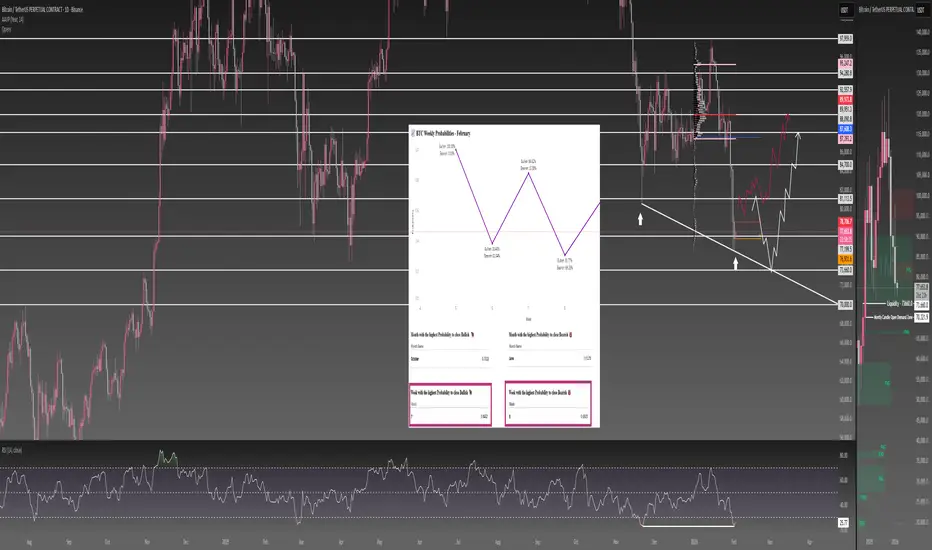
Bitcoin - Last drop, then a huge pump! (watch this wedge)Bitcoin is currently trading at around 78,000 at the time of writing this article, and I expect the price to go down to 71k - 72k in the short term. Why? As we can see on the chart, there are many reasons why Bitcoin should go down. The first reason is that whales (banks, institutions) still didn't sweep liquidity below the April 2025 swing low. This is a huge point of interest because a lot of retail traders have their stop losses exactly below this swing low. The second reason is that the pric
DOW JONES INDEX (US30): Consolidation Completed?!
Dow Jones Index violated a resistance line of a symmetrical
triangle pattern on a daily time frame.
It indicates a highly probable completion of a bullish accumulation.
The market may continue rising now and reach 50000 level soon.
❤️Please, support my work with like, thank you!❤️
I am part of Trade Nation's Influencer program and receive a monthly fee for using their TradingView charts in my analysis.
GBPCHF: Bulls Are Back 🇬🇧🇨🇭
GBPCHF finally looks bullish after a deep retest
of a recently broken daily structure.
A breakout of a resistance line of a falling channel/flag
on an hourly time frame leaves strong bullish clues.
We can expect a rise at least to 1.0654
❤️Please, support my work with like, thank you!❤️
I am part of Trade Nation's Influencer program and receive a monthly fee for using their TradingView charts in my analysis.
Top 3 Forex Gold Setups I Will Be Trading in 2026
Among the different strategies and signals that I relied on in 2025, there were 3 exceptional setups that showed the highest accuracy and profitability.
In this article, I will explain the structure and price model of these setups and equip you with the best entry signals for trading in 2026.
Discover what worked best in Forex and Gold trading in 2025.
The first powerful setup that showed great results last year is based on an old-school price action chart pattern - double top & b
February Overview – BTCJanuary closed below 80K, something that did not happen in any monthly candle during 2025.
This shift opens two main scenarios:
*A potential bear market
*Or a broader consolidation year
As long as we do not get a monthly close below 70.5K, the base case remains consolidation, not a clear bear market.
Additionally, during 2025 we did not fully fill the monthly Fair Value Gap (FVG), located around 73.6K.
This keeps that level technically open, making it a valid level to revisit and a strong dem
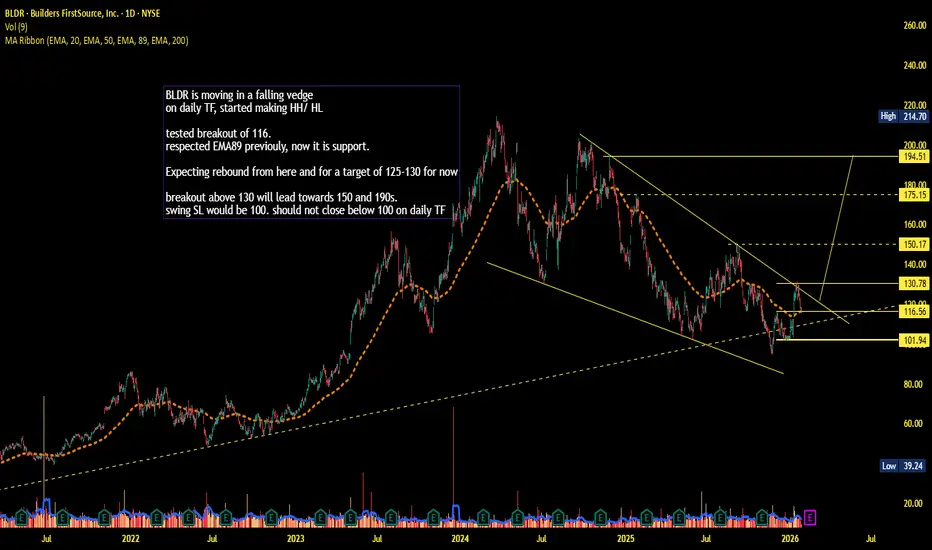
BLDR - HH-HL Pattern BLDR is moving in a falling vedge
on daily TF, started making HH/ HL
tested breakout of 116.
respected EMA89 previouly, now it is support.
Expecting rebound from here and for a target of 125-130 for now
breakout above 130 will lead towards 150 and 190s.
swing SL would be 100. should not close below 100 on daily TF
JKCEMENT – Coiled inside a big wedgeMarkets rarely explode without building tension — this wedge might be that tension.
JK cement's long-term support zone broadly intact, but short/medium-term trend has seen pressure. Recent weeks show lower highs , forming a downward sloping upper trendline. But there's a wider, long-term rising trendline at the bottom — forming a potential large contracting triangle / wedge-like structure on daily chart (as I marked).
So, we are in a coil / compression phase. Price consolidating inside a
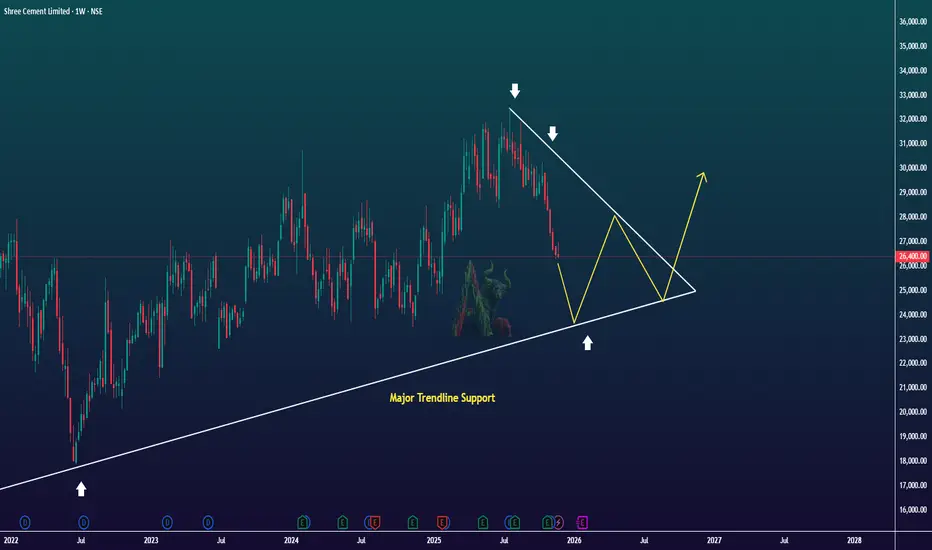
SHREECEM – Weekly ChartPrice is approaching a broad trendline support while forming a descending triangle on the upper side. Weekly structure shows compression. We can expect a possible strong move ahead once it reaches the major support zone. As of now watch the trendline.
Break down = momentum shift in the downward direction
Bounce = continuation to the upside
The Anatomy of a Trap: Why Structure Alone Isn’t EnoughMarkets often look their most convincing right before they become the most deceptive. Clean chart patterns, widely recognized levels, and textbook formations can create a powerful sense of certainty — especially when many traders are seeing the same thing at the same time. Yet, certainty in markets is often where risk quietly concentrates.
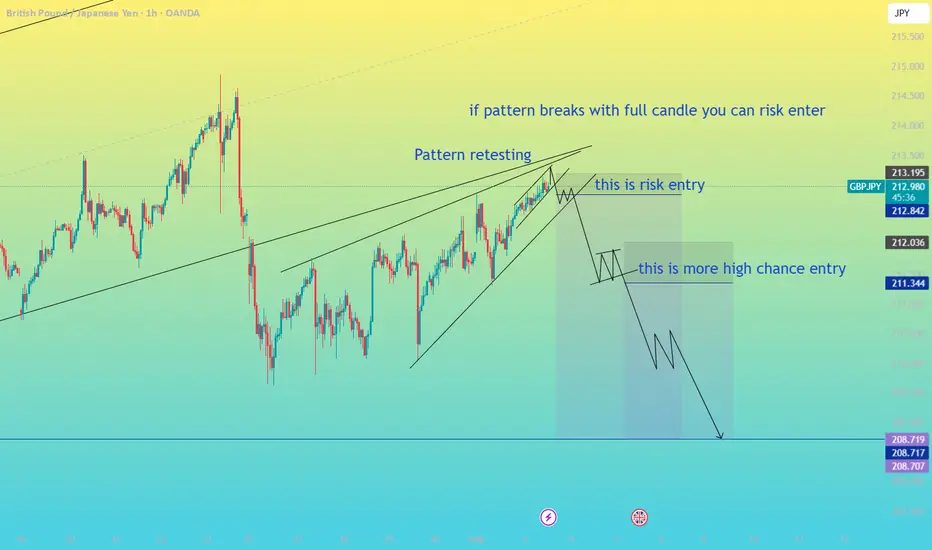
The current structure on E-mini Dow Jones futures offers a textbook example of this dynamic. A rising wedge on the daily timeframe, a retracement toward a pr
FET: Still hasn't decoupled from BTC. Trade may be invalidatedWith the dominance chart still showing its self in a topping phase, and FET showing repeat bear market bottom patterns, I was very excited to see what it may do.
As the counter-trend has developed and under-whelmed for BTC, altcoins still have not decoupled from BTC as you would have expected them to. BTC is on the verge of another big leg down if it follows historical TA, and altcoins will follow along in how they are behaving now.
FET recently tested the big picture RSI trendline on the we
$CRCL to $28-40 before higher?This is is a long term chart of CRCL. You can see that we've been consolidating in a falling wedge ever since the IPO. I think it's likely that we see a capitulation style move down to the lower supports at $28-40, and then we'll see a bounce after that will setup a long term bull market.
Don't get shaken out before the bull run.
I think you'll want to bid the lower support levels on the chart and hold for $300-500+.
$BBAI: From Hibernation to 4X AI rocket ship?🐻🐻🐻
BigBear.ai is no longer just a struggling SPAC; it is positioning itself as the "Palantir for the Rest of Us" in the defense and cargo security sectors.
(at least that is the narrative)
I'm looking at a 4X potential move on #BBAI as it coils at the bottom of a massive #HVF pattern
@TheCryptoSniper
The Move: A high-volume break of $6.62 targets the previous highs near $10.36, with an ultimate 'cycle' target in the mid $20s.
The Fuel: Debt is gone, and the company is now a 'Smart Trade' p
Falling wedge pattern on zillow!OptionsMastery:
🔉Sound on!🔉
📣Make sure to watch fullscreen!📣
Thank you as always for watching my videos. I hope that you learned something very educational! Please feel free to like, share, and comment on this post. Remember only risk what you are willing to lose. Trading is very risky but it can change your life!