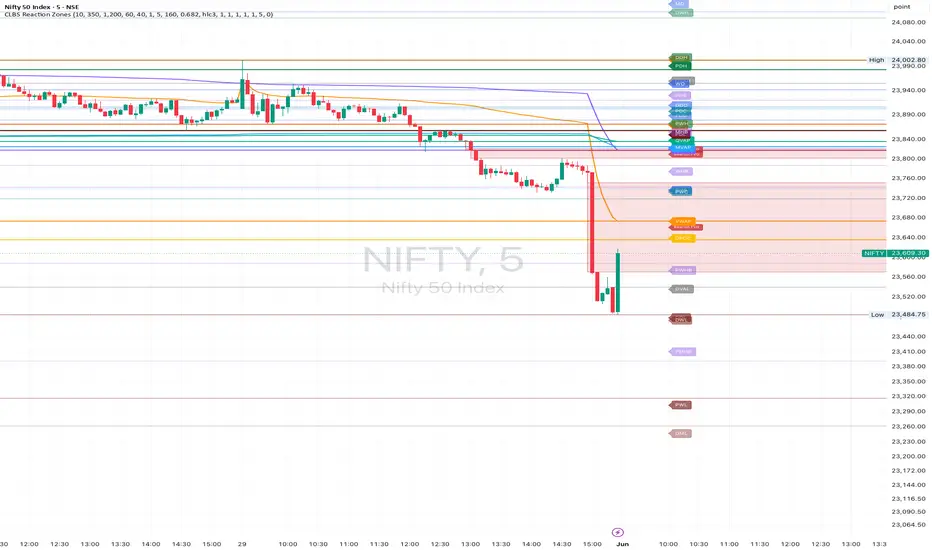
VWAP ReclaimVWAP Reclaim–Retest Created by Claude — User Guide
A mechanical TradingView indicator (Pine Script v6) for trading VWAP reclaims and rejections. It is built for a 5-minute chart but will run on any timeframe. It does not place trades — it identifies setups, marks entry/stop/target levels, and can fire alerts.
---
What it does
The indicator watches price relative to a daily-anchored VWAP and only signals when a specific three-step sequence completes. The point of the sequence is to stop you entering on the raw cross (which gets chopped to pieces) and instead wait for price to prove it can hold the level.
Long sequence
Reclaim — price closes above VWAP (a crossover).
Retest — within a set number of bars, price pulls back to VWAP but closes back above it. This is the "does it hold?" test. The candle that does this becomes the retest candle, and its high is recorded.
Trigger — a later candle breaks above the retest candle's high. That break is the entry.
Short sequence is the mirror image: price closes below VWAP, pops back up to VWAP but closes back below, then a later candle breaks below the retest candle's low.
A setup is abandoned (reset to idle) if price closes back through VWAP before the trigger, or if too many bars pass without a retest or trigger. This is what keeps stale setups from firing late.
---
The regime filter (why this matters most)
Reclaims only pay on directional days. On a chop/range day, price ping-pongs across VWAP and every reclaim fails. The regime filter ties each direction to VWAP's slope:
Longs only fire when VWAP is flat-to-rising.
Shorts only fire when VWAP is flat-to-falling.
Slope is measured by comparing the current VWAP to its value N bars ago (the slope lookback). This single filter removes most of the counter-trend losers. You can turn it off to see every raw setup, but leaving it on is the recommended default.
---
Reading the chart
Element Meaning
VWAP line Daily-anchored VWAP. Green = rising, red = falling, gray = flat. The color is the regime.
Shaded bands Optional ±standard-deviation bands around VWAP. Useful as context: price stretched to the outer band is extended.
LONG / SHORT triangle A confirmed trigger. Appears on the close of the trigger bar.
Entry / Stop / Target lines Drawn at each signal. Entry = the break level. Stop = beyond the retest swing plus an ATR buffer. Target = entry ± (R multiple × risk).
Background tint Faint green or red while a setup is building (reclaimed or armed) but not yet triggered — your early warning.
Status panel (top-right) Live state of each side and the current VWAP direction. States: Idle → Reclaimed → await retest → Retest → ARMED. "ARMED" means a valid retest is in place and the next break will trigger.
---
Settings, group by group
Direction
Trade long reclaims / Trade short reclaims — turn each side on or off independently. Disable one to focus, e.g. longs only on a strong up day.
VWAP
VWAP source — the price the VWAP is built from. Default `hlc3` (the standard). Change to `close` if you prefer a close-based VWAP.
Show ±SD bands — toggle the standard-deviation bands.
Band multiplier — how many standard deviations the bands sit at (1.0 default). Raise for wider context bands.
Regime filter (VWAP slope)
Only trade with VWAP slope — the regime filter described above. On by default. The single biggest filter against chop.
Slope lookback (bars) — how far back to measure slope. Lower = more sensitive (reacts fast, more flips); higher = smoother (only strong trends qualify). 10 is a reasonable 5-minute default.
Reclaim / Retest mechanics
Retest proximity (ticks to VWAP) — how close the pullback must get to VWAP to count as a retest. `0` = price must actually touch VWAP. Increase to allow near-misses where price pulls back toward VWAP but doesn't quite tag it. This is tick-based, so the right value differs by instrument (ES ticks are 0.25; a stock might be 0.01) — calibrate per symbol.
Max bars: reclaim → retest — how long after a reclaim the indicator will wait for a retest before giving up. Too low misses slow pullbacks; too high lets stale setups linger.
Max bars: retest → trigger — same idea for the window between a valid retest and the breakout trigger.
Stop / Target
ATR length — lookback for the ATR used to pad the stop.
ATR buffer beyond level — how far past the retest swing the stop sits, in ATR multiples. 0.5 = half an ATR of breathing room. Raise it if you're getting wicked out, lower it for tighter risk.
Target (R multiple) — where the target line is drawn, as a multiple of risk. 1.5 means the target is 1.5× the distance from entry to stop. This sets the displayed reward, not a hard rule — you can still manage the trade manually.
Session filter
Restrict signals to a session — off by default. Turn on to ignore signals outside a chosen window.
Session — the time window, e.g. `0945-1130` to skip the open spike and lunch chop, or `0930-1600` for the full regular session.
Timezone — the timezone the session string is read in. Default `America/New_York`.
Visuals
VWAP rising / falling / flat colors — the three slope colors.
Entry / Stop / Target colors — the three level-line colors.
Level line length (bars) — how far to the right the entry/stop/target lines extend.
Level line width — thickness of those lines.
Label size — tiny / small / normal / large for the price labels.
Show status panel — toggle the top-right state table.
Tint background while a setup is forming — toggle the faint background shading during the reclaim/armed phase.
Alerts
Three `alertcondition`s are exposed when you create an alert in TradingView: Long, Short, and Any. Pick one, set it to "Once per bar close" so it matches how signals confirm.
---
A suggested workflow
Put it on a 5-minute chart of a symbol that has volume (VWAP needs volume to compute).
Leave the regime filter on. Watch the VWAP color — that tells you which direction the indicator will even consider.
When the background tints and the status panel shows ARMED, a break is imminent; that's your prep signal.
On the triangle, the entry/stop/target lines show you the trade's geometry. Check that the target isn't sitting right on top of an obvious level (prior day high/low, round number) that would cap the move.
Forward-test on paper for 30–50 signals before sizing up. Tune one setting at a time — retest proximity and slope lookback have the biggest effect on how many signals you get and how clean they are.
---
Honest caveats
Signals confirm on the close of the trigger bar. This is the non-repainting behavior, but it means the marker appears slightly after the intrabar break where a live stop order would actually fill. The entry line shows the real break level.
The retest proximity is tick-based and must be calibrated per instrument.
It's an analysis tool, not advice. A clean ruleset still has losing streaks; the value of mechanizing is consistent, small losses so a real edge can show over a sample — not the elimination of losers. Backtest and forward-test before risking size. Indicador

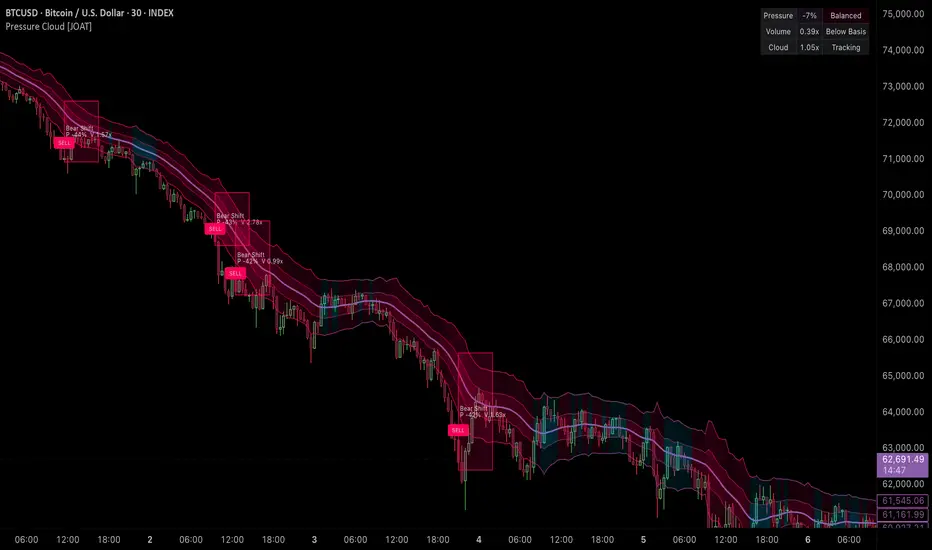
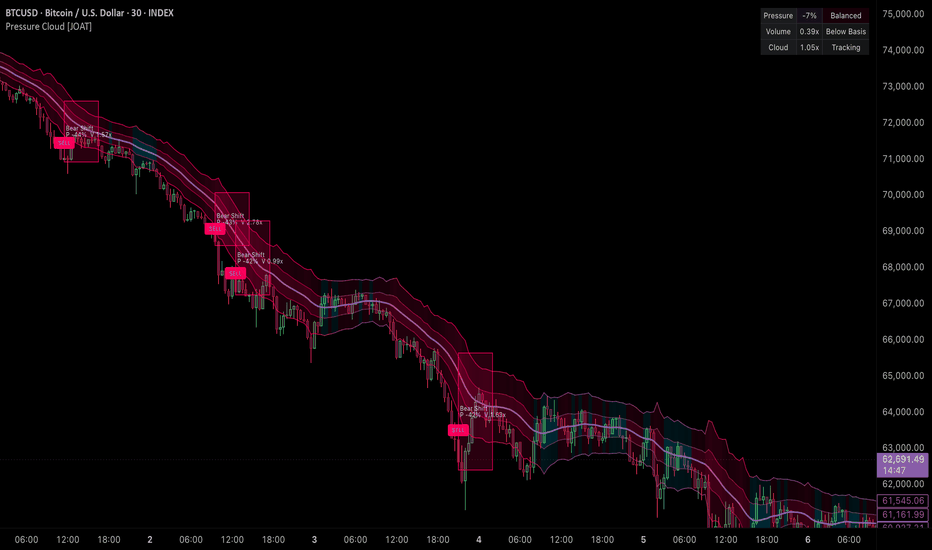
Order Pressure Cloud [JOAT]Order Pressure Cloud is an open-source Pine Script v6 overlay that estimates directional pressure from close location value, candle body bias, and volume participation. It then projects that pressure around an ALMA/EMA blended basis as a volatility-adjusted cloud.
The script is designed for pressure context. It does not read real order book data. Instead, it creates a transparent price-and-volume proxy that can show whether bars are closing toward highs or lows, whether volume is participating, and whether price is holding above or below the adaptive basis.
Core Concepts
1. Close Location Value
The close location value measures where the candle closes inside its high-low range. A close near the high produces positive pressure, while a close near the low produces negative pressure.
barRange = math.max(high - low, syminfo.mintick)
clv = ((close - low) - (high - close)) / barRange
2. Volume-Weighted Pressure
The script smooths CLV multiplied by volume and divides it by smoothed volume. This produces a normalized pressure ratio.
pressureNumerator = ta.ema(clv * volume, pressureLengthInput)
pressureDenominator = ta.ema(volume, pressureLengthInput)
pressureRatio = safeRatio(pressureNumerator, pressureDenominator)
3. Body Bias Component
Body direction is also included. The body component is weighted by a capped volume pulse so unusually large bars do not dominate the reading indefinitely.
4. Nonlinear Strength
The composite pressure is compressed with a nonlinear transform. This keeps extreme values readable and easier to display as a cloud strength score.
5. ALMA/EMA Basis Cloud
The basis blends ALMA and EMA. ATR, pressure strength, and volume pulse expand or contract the cloud width.
Features
CLV pressure proxy: Measures where price closes inside each candle range
Volume participation: Weights pressure by volume while normalizing by smoothed volume
Body pressure component: Adds candle body direction to the pressure model
Nonlinear strength scale: Converts pressure into a bounded -100 to +100 value
Adaptive cloud: Cloud width adjusts with ATR, pressure strength, and volume pulse
Basis blend: ALMA and EMA create a smoother central reference
Pressure zones: Confirmed pressure shifts and holds create clean boxes with pressure percentage and volume pulse data
Confirmed buy/sell labels: Compact labels mark pressure shifts and pressure-cloud holds after bar close
Strength gauge: Top-right dashboard shows pressure, volume, basis side, and cloud scale
Alerts: Pressure shifts, cloud holds, confirmed buy, and confirmed sell conditions
Input Parameters
Source: Price source for the basis
Pressure Length: Smoothing length for pressure calculations
Basis Length: Length for ALMA and EMA basis
ALMA Offset / ALMA Sigma: ALMA shape controls
ALMA Share: Blend weight between ALMA and EMA
ATR Length: Volatility length for cloud width
Cloud Multiplier: Base cloud distance
Signal Level: Strength threshold for pressure shifts
Paint Bars: Enables pressure candle tint
Strength Gauge: Shows dashboard
Pressure Zones: Toggles pressure data boxes
Buy/Sell Signals: Toggles compact confirmed labels
Zone Width: Bars each pressure box extends
Zone History: Maximum pressure boxes retained
Palette: Selects color pair
How to Use This Indicator
Step 1: Read the Gauge
The pressure row shows whether the current pressure score is above, below, or near neutral.
Step 2: Watch Basis Holds
A cloud hold means price interacted with the inner cloud while pressure remained directional.
Step 3: Compare Pressure With Price Location
Pressure is more meaningful when price is on the same side of the basis as the pressure reading.
Indicator Limitations
This is a price-and-volume proxy, not direct order book data
Volume availability differs between markets and symbols
Low-volume symbols can produce unstable pressure readings
Pressure shifts are reactive and can reverse during choppy conditions
Originality Statement
Order Pressure Cloud is original in how it combines CLV, body bias, volume pulse, nonlinear strength compression, and an adaptive ALMA/EMA cloud. It is built as original Pine v6 code from public market data fields.
Disclaimer
This script is provided for educational and informational use only. It is not financial advice or a recommendation to buy or sell any financial instrument. Trading involves substantial risk of loss. Pressure proxies can be inaccurate, especially where volume data is incomplete or irregular. Always use independent analysis and proper risk management.
-Made with passion by jackofalltrades Indicador
VWAP Gravity Bands [JOAT]VWAP Gravity Bands is an open-source Pine Script v6 overlay that builds an anchored VWAP field with a smoothed T3 basis and ATR ladder bands. It is designed to show how far price has traveled from a session, weekly, or monthly value anchor, then classify that distance as center pull, ladder drift, expansion, or outer-band reaction.
The script is useful when a trader wants the chart to show both location and behavior around VWAP. Instead of a single VWAP line, it creates a full distance map around the anchor, colors candles by their distance from the basis, and highlights confirmed outer reactions without using arrow-style signal clutter.
Core Concepts
1. Anchored VWAP Selection
The anchor can reset on the session, week, or month. The script uses timeframe.change() to produce the reset pulse and ta.vwap() to calculate the anchored value.
anchorTimeframe = anchorChoice == "Week" ? "1W" : anchorChoice == "Month" ? "1M" : "1D"
anchorPulse = timeframe.change(anchorTimeframe)
rawVwap = ta.vwap(sourceInput, anchorPulse)
2. T3 Basis Smoothing
Raw anchored VWAP can move sharply at the beginning of an anchor period. VWAP Gravity Bands runs that value through a T3-style smoother to create a cleaner basis while preserving responsiveness.
e1 = ta.ema(src, length)
e2 = ta.ema(e1, length)
e3 = ta.ema(e2, length)
basis = c1 * e6 + c2 * e5 + c3 * e4 + c4 * e3
3. ATR Ladder Bands
The band ladder is based on ATR, not fixed percentages. This lets the distance field expand and contract with the market's current movement range.
ladderUnit = atr * bandStep
upperOne = basis + ladderUnit
lowerOne = basis - ladderUnit
upperThree = basis + ladderUnit * 3.0
lowerThree = basis - ladderUnit * 3.0
4. Distance State Model
Distance from VWAP is normalized by the ladder unit. The script classifies large directional continuation as expansion and failed outer-band tests as reactions.
5. Gradient Candle Coloring
Candles can be colored by their normalized distance from VWAP. This helps identify when price is balanced around the anchor, drifting away from it, or stretched toward an outer band.
Features
Session, weekly, or monthly anchor: Select the VWAP reset period from inputs
T3-smoothed VWAP basis: Cleaner centerline for visual trend and location analysis
ATR ladder bands: Three upper and lower bands scale with current volatility
Expansion state detection: Highlights directional movement away from the basis
Outer reaction detection: Marks confirmed failed tests near the outer ladder
Distance candle mode: Optional gradient candles based on normalized VWAP distance
Dashboard: Shows anchor, state, distance, ATR step, and basis slope
Alert conditions: Upper reaction, lower reaction, upper expansion, and lower expansion
Input Parameters
Visual System:
Palette Preset: Selects color pair
Distance Candles: Enables candle coloring by VWAP distance
Dashboard: Shows top-right state panel
Raw VWAP: Displays the unsmoothed anchored VWAP
Outer Reaction Marks: Shows compact TP-style outer reaction markers
VWAP Gravity:
Anchor: Session, Week, or Month
Source: Price source used for VWAP
T3 Basis Length: Smoothing length for the VWAP basis
T3 Factor: Controls T3 smoothness
ATR Length: Volatility length used for ladder distance
ATR Step: Distance between ladder bands
Expansion Step: Threshold for expansion classification
Reaction Step: Threshold for outer reaction classification
How to Use This Indicator
Step 1: Choose the Anchor
Use Session for intraday context, Week for swing context, and Month for broader value location.
Step 2: Read Distance From Basis
The dashboard distance value shows how many ladder units price is away from the smoothed VWAP basis.
Step 3: Separate Expansion From Reaction
Expansion means price is moving away from VWAP with slope confirmation. Reaction means price tested an outer area and closed back inside.
Step 4: Use the Bands as Context
The bands are not automatic entry levels. They show location. Combine them with market structure, candle behavior, and risk planning.
Indicator Limitations
VWAP is volume-based and may behave differently on symbols with sparse volume
The first bars after a new anchor can be less stable because VWAP is starting a new sample
Reaction markers show a confirmed close back inside a zone, not a future reversal forecast
ATR bands adapt to volatility but can widen quickly after large bars
Originality Statement
VWAP Gravity Bands is original in how it combines anchored VWAP selection, T3 smoothing, ATR ladder geometry, distance-colored candles, and separate expansion/reaction states. It is built from public Pine v6 functions and original logic rather than copied indicator source.
Disclaimer
This script is provided for educational and informational use only. It is not financial advice or a recommendation to buy or sell any financial instrument. Trading involves substantial risk of loss. VWAP location and band reactions can fail in trending, news-driven, or low-liquidity markets. Always use independent analysis and proper risk management.
-Made with passion by jackofalltrades
Indicador

VV Control Levels AnalyzerVV Control Levels Analyzer
VV Control Levels Analyzer is a control-level analysis indicator designed to help traders evaluate where price is positioned relative to major volume and VWAP reference levels.
The indicator studies four main control references:
1. Daily POC
2. Weekly POC
3. Monthly POC
4. Anchored VWAP Gate Line
It then summarizes the relationship between price and those levels in a clean technical dashboard.
This script is an indicator, not a strategy. It does not place trades, does not calculate backtest results, and does not provide guaranteed buy or sell signals. Its purpose is to organize important control-level information on the chart so users can make their own analysis.
Overview
The main idea behind VV Control Levels Analyzer is that price location relative to high-volume control levels can provide useful market context.
When price is above most control levels, the chart may be showing stronger acceptance above value.
When price is below most control levels, the chart may be showing weaker acceptance below value.
When price is close to one or more control levels, the market may be testing an important decision area.
The indicator does not predict future price movement. It shows where price is trading relative to selected control references.
Main components
1. Daily, Weekly, and Monthly POC
The script calculates an approximate Point of Control for the previous completed Daily, Weekly, and Monthly periods.
POC means Point of Control. It represents the price area with the highest estimated volume within the selected period.
The indicator calculates POC internally by:
* storing period price and volume data,
* dividing the price range into volume rows,
* distributing volume into those rows,
* selecting the row with the highest accumulated volume.
The POC calculation is an approximation based on available chart data. It is not intended to exactly duplicate exchange-native or broker-native volume profile tools.
The Daily, Weekly, and Monthly POC values are shown in the dashboard. The active POC line can also be plotted on the chart if the user enables it from settings.
By default, the POC line is hidden to keep the chart clean. However, the POC logic remains active even when the line is hidden.
2. Active POC Line
The user can choose which POC period is displayed on the chart:
* Daily
* Weekly
* Monthly
The displayed POC line is optional. It can be enabled or disabled from the settings.
Bar coloring can still use the active POC even when the POC line itself is hidden.
The active POC is used to color candles as:
* above POC,
* below POC,
* crossing POC.
This is visual context only and should not be treated as a standalone entry or exit signal.
3. VWAP Gate Line
The indicator calculates a VWAP Gate from a selected anchor period:
* Daily
* Weekly
* Monthly
The main VWAP Gate Line is shown by default. It represents the central VWAP reference from the selected period.
The script also calculates optional upper and lower VWAP gates using standard deviation around the VWAP.
The optional gates are:
* Upper Gate 1
* Upper Gate 2
* Lower Gate 1
* Lower Gate 2
By default, only the main VWAP line is shown to reduce chart clutter. Users can disable “Show Only Main VWAP Line” to display the additional upper and lower gate levels.
4. VWAP Standard Deviation Gates
The upper and lower VWAP gates are calculated using the selected standard deviation multipliers.
First Gate Multiplier controls the first deviation band.
Second Gate Multiplier controls the second deviation band.
These levels can help users identify areas where price is stretched above or below the selected VWAP period.
These gates are reference levels only. They are not automatic reversal or breakout signals.
5. Smart Control Logic
The indicator evaluates price against four control references:
* Daily POC
* Weekly POC
* Monthly POC
* VWAP Gate Line
It counts how many of these levels price is currently above.
The result is displayed as Control Strength:
0/4 = price is below all four control references
1/4 = price is above one control reference
2/4 = price is above two control references
3/4 = price is above three control references
4/4 = price is above all four control references
This control count is used to create the dashboard status.
Dashboard status explained
Very Bullish
Price is above all four control references and is not too close to a control level.
Bullish
Price is above most control references and is not too close to a control level.
Neutral
Price is around the middle of the control structure or near a control level.
Recovery Watch
Price is near a control level after weakness. This may indicate that price is testing an area where recovery could be studied, but it is not a buy signal.
Breakout Watch
Price is near a control level and trading above or near the VWAP Gate. This may indicate that price is testing control resistance, but it is not a breakout confirmation by itself.
Breakdown Risk
Price is near a control area but below the VWAP Gate or important control references. This may indicate weakness around control levels, but it is not a short signal by itself.
Bearish
Price is below most control references.
Very Bearish
Price is below all four control references and is not too close to a control level.
Trend reading
The script also provides a simple trend reading:
Up
Price is above both Weekly POC and Monthly POC.
Down
Price is below both Weekly POC and Monthly POC.
Sideways
Price is mixed between Weekly and Monthly POC references.
This trend field is a broad context reading only. It should not be treated as a complete trend-following system.
Nearest Control
The dashboard identifies the nearest control level to current price among:
* Daily POC
* Weekly POC
* Monthly POC
* VWAP Gate
It also shows the distance from current price to that nearest control level as a percentage.
If price is within the selected Neutral Distance %, the dashboard treats price as being near a control area.
Volume Ratio
The script calculates a volume ratio by comparing current volume with a 20-period average volume.
Volume Ratio = Current Volume / 20-period Average Volume
The dashboard highlights volume strength based on the selected Strong Volume Ratio setting.
Strong volume means current volume is above the selected threshold.
Weak or normal volume means current volume has not reached that threshold.
Volume is used as context only. It does not validate a trade by itself.
Technical Analysis Dashboard
The dashboard displays:
Symbol
Shows the current ticker.
Current Price
Shows the latest close price.
Status
Shows the smart control state, such as Very Bullish, Neutral, Breakout Watch, or Breakdown Risk.
Trend
Shows Up, Down, or Sideways based on Weekly and Monthly POC position.
Current Volume
Shows the current chart volume.
Volume Ratio
Compares current volume with its recent 20-period average.
Daily POC
Shows the calculated Daily POC.
Weekly POC
Shows the calculated Weekly POC.
Monthly POC
Shows the calculated Monthly POC.
Upper Zone
Shows the first upper VWAP deviation gate.
VWAP Gate Line
Shows the main VWAP gate value.
Lower Zone
Shows the first lower VWAP deviation gate.
Control Strength
Shows how many of the four control references price is currently above.
Nearest Control
Shows the closest control reference to current price.
Distance
Shows percentage distance from price to the nearest control level.
Settings explained
Volume Profile / POC Settings
Show POC Line
Shows or hides the active POC line. The POC remains active in the dashboard and logic even when hidden.
POC Base Color
Controls the color of the active POC line.
POC Transparency
Controls how visible or soft the POC line appears.
POC Line Width
Controls the thickness of the active POC line.
Above POC Bar
Color used when price closes above the active POC.
Below POC Bar
Color used when price closes below the active POC.
POC Cross Bar
Color used when price crosses the active POC.
Displayed POC Period
Selects which POC period is displayed as the active POC line: Daily, Weekly, or Monthly.
Color Bars by POC
Colors candles according to price position relative to the active POC.
Volume Resolution Rows
Controls how many rows are used in the internal POC approximation. Higher values may provide more detail but can require more processing.
VWAP Gate Settings
Show VWAP Gate
Enables or disables VWAP gate plotting.
Show Only Main VWAP Line
When enabled, only the central VWAP Gate Line is shown. When disabled, upper and lower deviation gates are also shown.
Main VWAP Line
Controls the color of the main VWAP line.
Main VWAP Line Width
Controls the thickness of the main VWAP line.
Optional Gate Lines
Controls the color of the optional upper and lower VWAP gates.
Fill Optional Gate Zones
Fills the space between optional VWAP deviation gates. This is disabled by default for a cleaner chart.
VWAP Gate Period
Selects the anchor period used for the VWAP calculation: Daily, Weekly, or Monthly.
First Gate Multiplier
Controls the first standard deviation level around VWAP.
Second Gate Multiplier
Controls the second standard deviation level around VWAP.
Smart Control Logic
Neutral Distance %
Defines how close price must be to a control level to be treated as a neutral or control-test area.
Strong Volume Ratio
Defines the volume ratio threshold used to classify current volume as strong.
Use Volume in Optional Status Label
Adds volume context to the optional chart label.
Technical Analysis Table
Show Table
Shows or hides the technical dashboard.
Table Position
Controls where the dashboard appears on the chart.
Table Size
Controls the dashboard text size.
Show Optional Status Label
Shows a compact chart label with the current VV Analyzer status.
Optional Label Size
Controls the size of the optional status label.
Optional Label Distance
Controls how far the optional label is placed from the latest candle using ATR.
How to use this indicator
A practical workflow:
1. Check the dashboard Status.
2. Review Control Strength to see how many major control levels price is above.
3. Check the Trend field for broad context.
4. Identify the Nearest Control level and distance.
5. Watch price behavior around the VWAP Gate Line and the nearest POC.
6. Use Volume Ratio as supporting context.
7. Combine this information with your own market structure, risk management, and trading plan.
Example interpretation
If price is above Daily POC, Weekly POC, Monthly POC, and VWAP Gate, the dashboard may show Very Bullish. This means price is accepted above all selected control references. It does not mean price must continue upward.
If price is below most control references, the dashboard may show Bearish or Very Bearish. This means price is trading below important control levels. It does not mean price must continue downward.
If price is close to a POC or VWAP Gate, the dashboard may show Breakout Watch, Recovery Watch, Breakdown Risk, or Neutral. This means price is testing a control area and needs further confirmation from the user’s own analysis.
Alerts
The script includes alerts for:
VV Very Bullish
Price is above all control levels.
VV Bullish
Price is above most control levels.
VV Recovery Watch
Price is near a control level after weakness.
VV Breakout Watch
Price is testing control resistance.
VV Breakdown Risk
Price is below VWAP or a key control area.
VV Very Bearish
Price is below all control levels.
These alerts are classification alerts only. They do not instruct the user to buy or sell.
Important limitations
This indicator does not predict future price movement.
It does not provide buy or sell signals.
It does not place strategy orders.
It does not provide backtesting results.
POC values are internally approximated from available chart price and volume data.
VWAP gates are calculated from the selected period and may differ from other VWAP tools depending on method and data source.
Daily, Weekly, and Monthly values are based on completed periods and update when a new period begins.
Volume quality can differ between markets, symbols, and data providers.
The dashboard status is a contextual classification, not a trade recommendation.
Recommended use
VV Control Levels Analyzer is best used as a decision-support tool for traders who study:
* Point of Control
* VWAP
* volume-based control levels
* price acceptance above or below value
* distance from key control levels
* volume confirmation
* multi-timeframe control context
It is designed for visual market context, not automated trading, not guaranteed signal generation, and not financial advice.
Originality and purpose
VV Control Levels Analyzer combines multi-timeframe POC, anchored VWAP gates, volume ratio, nearest control distance, bar coloring, and a smart technical dashboard into one clean control-level framework.
The purpose of combining these components is to help traders quickly understand whether price is above, below, or testing important volume and VWAP reference levels.
The script is intended to reduce chart clutter by showing the main VWAP gate by default, hiding the POC line by default, and placing the detailed control information inside the dashboard.
Indicador

Indicador

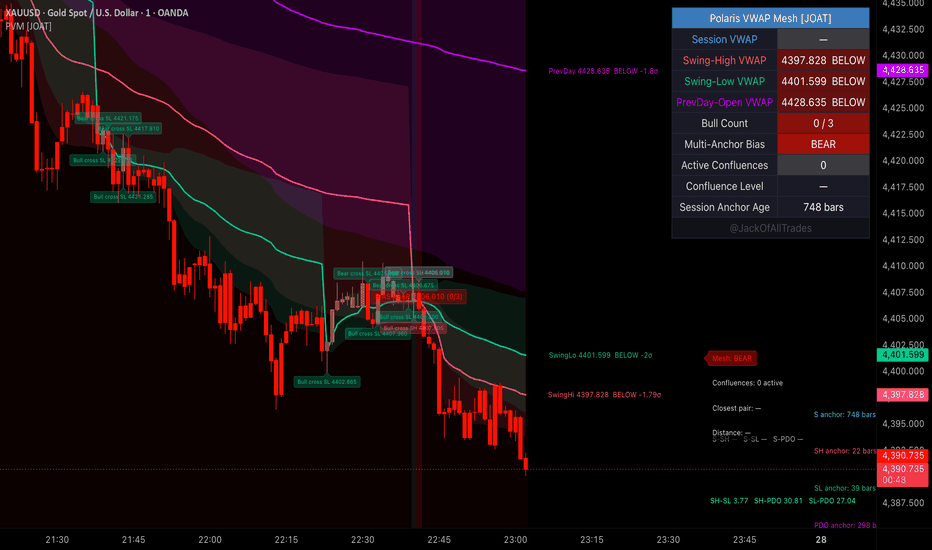
Dynamic Swing Anchored VWAP | Alpha S+Dynamic Swing Anchored VWAP
Dynamic Swing Anchored VWAP is a swing-based VWAP tool designed to help users study how price behaves around a dynamically anchored volume-weighted average price.
Instead of anchoring VWAP to a fixed session, date, or manually selected point, this script updates its anchor from detected swing changes. The result is a VWAP reference that follows the latest swing structure and adapts to changing market conditions.
The script does not provide entry or exit recommendations. Its purpose is to help users study swing direction, VWAP position, distance from VWAP, and context around swing-based support or resistance behavior.
────────────────────
Core Concept
────────────────────
VWAP is commonly used as a volume-weighted reference level.
Traditional VWAP often resets by session or uses a fixed anchor point.
This script uses a different approach.
It detects swing changes using recent high and low behavior, then recalculates a dynamic anchored VWAP from the latest swing anchor area.
The main concept is:
• detect the current swing direction
• anchor the VWAP calculation from the latest swing change
• smooth the VWAP tracking behavior
• optionally adapt the tracking speed to volatility
• compare current price with the swing-anchored VWAP
• visualize whether price is above, below, or near the VWAP reference
• use a compact chart label and context ribbon instead of relying on a large status panel
This makes the indicator useful as a visual swing-context VWAP reference rather than a simple static VWAP line.
────────────────────
What This Script Shows
────────────────────
The script can display:
• dynamic swing-anchored VWAP line
• VWAP glow line
• VWAP context ribbon
• bullish or bearish VWAP line color
• swing direction background
• optional swing point labels
• compact chart-based context label
• distance from VWAP in percentage
• swing flip anchor dots
• optional status panel
• alert conditions for VWAP crosses and swing flips
These elements are designed to help users identify whether price is holding above or below the current swing-based VWAP reference.
────────────────────
How It Works
────────────────────
1. The script scans recent highs and lows using the selected swing detection sensitivity.
2. The latest swing high and swing low areas are tracked.
3. Swing direction is determined by comparing the latest high and low swing locations.
4. When swing direction changes, the script updates the VWAP anchor.
5. The VWAP calculation uses price-volume accumulation with adaptive smoothing.
6. If volatility adaptation is enabled, tracking speed adjusts according to the ATR volatility ratio.
7. The script calculates the percentage distance between price and the swing-anchored VWAP.
8. Price above the VWAP with bullish swing direction is classified as bullish context.
9. Price below the VWAP with bearish swing direction is classified as bearish context.
10. Strong context is detected when price is far enough from VWAP using the selected distance threshold.
11. A context ribbon is drawn around the VWAP to make the active VWAP zone easier to read.
12. A compact chart label summarizes the current context and VWAP distance.
13. Optional anchor dots show where swing direction flips occur.
14. Optional alerts can notify VWAP crosses, swing flips, and strong context states.
This structure helps users study the relationship between price, swing direction, and volume-weighted reference behavior.
────────────────────
Inputs And Customization
────────────────────
Users can adjust:
• swing detection sensitivity
• base price tracking speed
• volatility adaptation
• volatility sensitivity
• ATR period
• strong distance percentage
• VWAP line thickness
• VWAP glow line visibility
• VWAP context ribbon visibility
• ribbon width based on ATR
• direction background visibility
• swing point label visibility
• anchor dot visibility
• bullish VWAP color
• bearish VWAP color
• neutral color
• swing point color
• compact context label visibility
• label offset
• label ATR offset
• status panel visibility
• panel position
• panel size
• alert settings
The default settings are designed to keep the chart clean while making the VWAP context readable directly on the price chart.
────────────────────
Visual Elements
────────────────────
The script includes:
• main VWAP line
• glow line
• VWAP context ribbon
• compact context label
• optional swing labels
• optional anchor dots
• optional status panel
The main VWAP line shows the active dynamic swing-anchored VWAP.
The glow line makes the VWAP reference more visible without adding extra signals.
The context ribbon creates a soft VWAP zone around the line, helping users see whether price is holding near or away from the swing-based VWAP reference.
The compact chart label summarizes the current context without requiring a large panel.
Anchor dots mark swing direction changes in a minimal way.
────────────────────
Reference States
────────────────────
Strong Above VWAP:
Price is above the swing-anchored VWAP, swing direction is bullish, and the distance from VWAP is above the selected threshold.
Above Swing VWAP:
Price is above the swing-anchored VWAP while the swing direction supports the bullish context.
Strong Below VWAP:
Price is below the swing-anchored VWAP, swing direction is bearish, and the distance from VWAP is below the negative threshold.
Below Swing VWAP:
Price is below the swing-anchored VWAP while the swing direction supports the bearish context.
Neutral VWAP:
Price position and swing direction are not aligned strongly enough to define a clear context.
Bullish Swing Flip:
Swing direction changed into a bullish swing state.
Bearish Swing Flip:
Swing direction changed into a bearish swing state.
These states are informational and should not be interpreted as trading instructions.
────────────────────
How To Use
────────────────────
Use this script as a swing-based VWAP context viewer.
General interpretation examples:
• When price holds above the dynamic swing-anchored VWAP, users can study whether the current swing structure is maintaining positive VWAP context.
• When price stays below the dynamic swing-anchored VWAP, users can study whether the current swing structure is maintaining negative VWAP context.
• A wider distance from VWAP can show stronger separation from the current swing-based volume reference.
• The context ribbon can help users identify whether price is interacting with the VWAP zone or moving away from it.
• Swing flip anchor dots can help users review where the VWAP anchor logic changed direction.
• The compact label can be used for quick context reading without adding a large status panel.
• The optional panel can be enabled for more detailed review, but the main interpretation is designed to happen directly on the chart.
This script is best reviewed together with price action, volume, volatility, support and resistance, trend structure, and higher-timeframe context.
────────────────────
Confirmation And Repainting Notes
────────────────────
The script uses recent high and low behavior to detect swing direction.
Swing direction and the VWAP anchor can update when new highs or lows appear inside the selected sensitivity window.
The dynamic VWAP line recalculates as price and volume update.
On realtime candles, values can change before the candle closes because price, volume, ATR, and swing conditions can update intrabar.
For more conservative analysis, users should evaluate context after candle confirmation.
The script does not use future price data to predict market direction.
────────────────────
Limitations
────────────────────
This script does not predict future price movement.
It does not provide entry or exit recommendations.
A price cross above or below VWAP does not guarantee trend continuation.
Strong distance from VWAP can represent strength, extension, or stretched conditions depending on broader context.
Swing detection sensitivity can materially change how often the anchor updates.
In choppy markets, swing direction and VWAP context may change frequently.
This script should not be used as a standalone trading system.
────────────────────
Disclaimer
────────────────────
This publication is for educational and informational chart analysis only.
It does not constitute financial advice, investment advice, or a recommendation to trade any financial instrument.
All trading and investment decisions are the responsibility of the user.
━━━━━━━━━━━━━━━━━━━━
Dynamic Swing Anchored VWAP
Dynamic Swing Anchored VWAP은 스윙 변화에 따라 동적으로 기준점이 갱신되는 VWAP 도구입니다. 가격이 현재 스윙 기반 volume-weighted average price 주변에서 어떻게 움직이는지 분석하는 데 사용됩니다.
이 스크립트는 고정된 세션, 날짜, 수동 앵커 지점에 VWAP을 고정하지 않습니다. 대신 감지된 스윙 변화에 따라 앵커를 갱신합니다. 그 결과 최신 스윙 구조를 따라가며 변화하는 시장 조건에 적응하는 VWAP 기준선을 제공합니다.
이 지표는 진입 또는 청산 추천을 제공하지 않습니다. 목적은 스윙 방향, VWAP 대비 가격 위치, VWAP과의 거리, 그리고 스윙 기반 지지·저항 컨텍스트를 분석하는 것입니다.
────────────────────
핵심 개념
────────────────────
VWAP은 거래량을 반영한 기준 가격으로 자주 사용됩니다.
일반적인 VWAP은 세션 기준으로 초기화되거나 고정된 앵커 지점을 사용합니다.
이 스크립트는 다른 접근 방식을 사용합니다.
최근 고점과 저점 행동을 사용해 스윙 변화를 감지하고, 최신 스윙 앵커 구간을 기준으로 dynamic anchored VWAP을 다시 계산합니다.
핵심 개념은 다음과 같습니다.
• 현재 스윙 방향 감지
• 최신 스윙 변화 구간에서 VWAP 계산 기준 갱신
• VWAP tracking behavior 평활화
• 선택적으로 변동성에 따라 tracking speed 조정
• 현재 가격과 swing-anchored VWAP 비교
• 가격이 VWAP 위, 아래, 또는 근처에 있는지 시각화
• 큰 상태 패널 대신 compact chart label과 context ribbon 중심으로 표시
이 구조는 단순 고정 VWAP 라인이 아니라, 스윙 컨텍스트 기반 VWAP 기준선을 시각적으로 보여주는 데 적합합니다.
────────────────────
이 스크립트가 보여주는 것
────────────────────
이 스크립트는 다음 요소를 표시할 수 있습니다.
• dynamic swing-anchored VWAP line
• VWAP glow line
• VWAP context ribbon
• bullish 또는 bearish VWAP line color
• swing direction background
• 선택 가능한 swing point labels
• compact chart-based context label
• VWAP과의 percentage distance
• swing flip anchor dots
• 선택 가능한 status panel
• VWAP cross 및 swing flip alert conditions
이 요소들은 가격이 현재 스윙 기반 VWAP 기준선 위 또는 아래에서 유지되고 있는지 확인하는 데 도움을 줍니다.
────────────────────
작동 방식
────────────────────
1. 선택한 swing detection sensitivity를 기준으로 최근 고점과 저점을 스캔합니다.
2. 최신 swing high와 swing low 구간을 추적합니다.
3. 최신 high swing과 low swing 위치를 비교해 swing direction을 판단합니다.
4. Swing direction이 바뀌면 VWAP anchor를 갱신합니다.
5. VWAP 계산은 price-volume accumulation과 adaptive smoothing을 사용합니다.
6. Volatility adaptation이 켜져 있으면 ATR volatility ratio에 따라 tracking speed가 조정됩니다.
7. 가격과 swing-anchored VWAP 사이의 percentage distance를 계산합니다.
8. 가격이 VWAP 위에 있고 swing direction이 bullish이면 bullish context로 분류합니다.
9. 가격이 VWAP 아래에 있고 swing direction이 bearish이면 bearish context로 분류합니다.
10. 가격이 선택한 distance threshold 이상으로 VWAP에서 멀어지면 strong context로 감지합니다.
11. VWAP 주변에 context ribbon을 표시해 활성 VWAP 구간을 쉽게 확인할 수 있게 합니다.
12. Compact chart label은 현재 context와 VWAP distance를 요약합니다.
13. 선택 가능한 anchor dots는 swing direction flip 지점을 표시합니다.
14. 선택 가능한 alerts는 VWAP cross, swing flip, strong context 상태를 알릴 수 있습니다.
이 구조는 가격, 스윙 방향, 거래량 기반 기준선 사이의 관계를 분석하는 데 도움을 줍니다.
────────────────────
입력값 및 설정
────────────────────
사용자는 다음 항목을 조정할 수 있습니다.
• swing detection sensitivity
• base price tracking speed
• volatility adaptation
• volatility sensitivity
• ATR period
• strong distance percentage
• VWAP line thickness
• VWAP glow line visibility
• VWAP context ribbon visibility
• ATR 기반 ribbon width
• direction background visibility
• swing point label visibility
• anchor dot visibility
• bullish VWAP color
• bearish VWAP color
• neutral color
• swing point color
• compact context label visibility
• label offset
• label ATR offset
• status panel visibility
• panel position
• panel size
• alert settings
기본 설정은 차트를 깔끔하게 유지하면서 VWAP 컨텍스트를 가격 차트 위에서 직접 읽을 수 있도록 설계되어 있습니다.
────────────────────
시각 요소
────────────────────
이 스크립트는 다음 시각 요소를 포함합니다.
• main VWAP line
• glow line
• VWAP context ribbon
• compact context label
• optional swing labels
• optional anchor dots
• optional status panel
Main VWAP line은 현재 활성화된 dynamic swing-anchored VWAP을 보여줍니다.
Glow line은 추가 신호 없이 VWAP 기준선을 더 잘 보이게 합니다.
Context ribbon은 VWAP 주변에 부드러운 구간을 만들어, 가격이 swing-based VWAP 기준선 주변에 머무는지 또는 멀어지는지 쉽게 확인할 수 있게 합니다.
Compact chart label은 큰 패널 없이 현재 상태를 요약합니다.
Anchor dot은 swing direction change를 최소한의 방식으로 표시합니다.
────────────────────
참고 상태
────────────────────
Strong Above VWAP:
가격이 swing-anchored VWAP 위에 있고, swing direction이 bullish이며, VWAP과의 거리가 선택한 기준값 이상인 상태입니다.
Above Swing VWAP:
가격이 swing-anchored VWAP 위에 있고, swing direction이 bullish context를 지지하는 상태입니다.
Strong Below VWAP:
가격이 swing-anchored VWAP 아래에 있고, swing direction이 bearish이며, VWAP과의 거리가 음의 기준값 이하인 상태입니다.
Below Swing VWAP:
가격이 swing-anchored VWAP 아래에 있고, swing direction이 bearish context를 지지하는 상태입니다.
Neutral VWAP:
가격 위치와 swing direction이 명확한 컨텍스트로 정렬되지 않은 상태입니다.
Bullish Swing Flip:
Swing direction이 bullish swing state로 바뀐 상태입니다.
Bearish Swing Flip:
Swing direction이 bearish swing state로 바뀐 상태입니다.
이 상태들은 정보 제공용이며, 매매 지시로 해석해서는 안 됩니다.
────────────────────
사용 방법
────────────────────
이 스크립트는 swing-based VWAP context viewer로 사용하는 것이 적절합니다.
일반적인 해석 예시는 다음과 같습니다.
• 가격이 dynamic swing-anchored VWAP 위에서 유지되면, 현재 스윙 구조가 positive VWAP context를 유지하는지 검토할 수 있습니다.
• 가격이 dynamic swing-anchored VWAP 아래에 머물면, 현재 스윙 구조가 negative VWAP context를 유지하는지 검토할 수 있습니다.
• VWAP과의 거리가 넓어질수록 현재 스윙 기반 거래량 기준선에서 가격이 더 크게 분리되어 있음을 보여줄 수 있습니다.
• Context ribbon은 가격이 VWAP zone과 상호작용하는지, 또는 그 구간에서 멀어지는지 확인하는 데 도움을 줍니다.
• Swing flip anchor dot은 VWAP anchor logic이 방향을 바꾼 지점을 복기하는 데 사용할 수 있습니다.
• Compact label은 큰 상태 패널 없이 빠른 컨텍스트 해석에 사용할 수 있습니다.
• Optional panel은 더 자세한 검토용으로 켤 수 있지만, 기본 해석은 차트 위에서 직접 이루어지도록 설계되었습니다.
이 스크립트는 가격 행동, 거래량, 변동성, 지지와 저항, 추세 구조, 상위 시간대 컨텍스트와 함께 검토하는 것이 좋습니다.
────────────────────
확인봉 및 리페인트 안내
────────────────────
이 스크립트는 최근 high와 low 행동을 사용해 swing direction을 감지합니다.
Swing direction과 VWAP anchor는 선택한 sensitivity window 안에서 새로운 고점 또는 저점이 나타날 때 갱신될 수 있습니다.
Dynamic VWAP line은 가격과 거래량이 업데이트됨에 따라 다시 계산됩니다.
실시간 캔들에서는 가격, 거래량, ATR, swing condition이 봉 마감 전까지 변경될 수 있으므로 값이 변할 수 있습니다.
보다 보수적인 분석을 원한다면 봉 마감 이후 context를 검토하는 것이 적절합니다.
이 스크립트는 미래 가격 데이터를 사용해 시장 방향을 예측하지 않습니다.
────────────────────
한계
────────────────────
이 스크립트는 미래 가격 움직임을 예측하지 않습니다.
진입 또는 청산 추천을 제공하지 않습니다.
VWAP 위 또는 아래로의 교차가 추세 지속을 보장하지 않습니다.
VWAP과의 강한 거리는 전체 컨텍스트에 따라 강세, 약세, 과확장 상태 중 하나로 해석될 수 있습니다.
Swing detection sensitivity는 anchor update 빈도에 큰 영향을 줄 수 있습니다.
Choppy market에서는 swing direction과 VWAP context가 자주 바뀔 수 있습니다.
이 스크립트를 단독 매매 시스템으로 사용해서는 안 됩니다.
────────────────────
중요 고지
────────────────────
본 게시물은 교육 및 정보 제공 목적의 차트 분석 자료입니다.
투자 자문, 특정 금융상품 거래 권유, 또는 수익 보장을 의미하지 않습니다.
모든 투자 판단과 그 결과에 대한 책임은 이용자 본인에게 있습니다. Indicador

Indicador

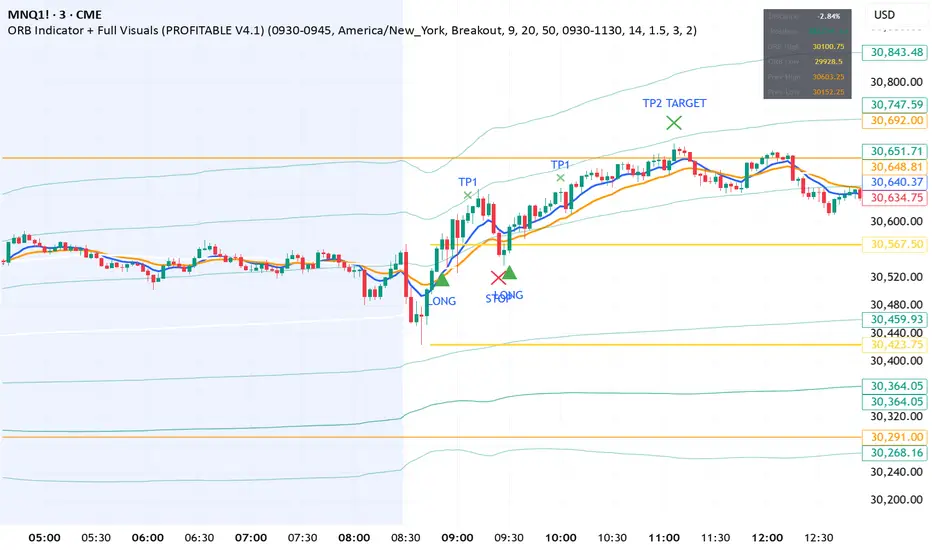
ORB Indicator + Full Visuals (PROFITABLE V4.1)Here is a clean, professional, and ready-to-use description you can copy and paste when publishing this script on TradingView.
ORB Strategy + Full Visuals (PROFITABLE V4.1) — Pure Indicator Edition
Overview
This script is a comprehensive conversion of the highly robust Opening Range Breakout (ORB) system into a fully visualized Indicator. Built specifically for active intraday traders targeting liquid instruments like Nasdaq-100 Futures (MNQ/NQ), Gold Futures (MGC/GC), and high-momentum equities, this tool handles complex mathematical tracking entirely on your chart without requiring the strategy tester.
Equipped with dual execution methodologies (Breakout and Mean Reversion), it features an intelligent, multi-target tracking state engine designed to scale out of positions and trail protection rules in real time.
Key Features
Intraday State Machine Tracking Engine: Automatically maps out dynamic, simulated trades directly from bar closes—calculating entry levels, profit targets, and trailing parameters seamlessly.
Multi-Target Scaling Logic:
Target 1 (1.5x ATR): Deployed as a high-probability scale-out marker. When achieved, the internal engine automatically trails the initial stop-loss to a strict breakeven level (entryPrice).
Target 2 (3.0x ATR): Stretched run target to maximize structural trends.
Dual Mode Architecture: Toggle instantly via inputs between asset classes and regimes:
Breakout Mode: Captures explosive volatility expansions when high/low thresholds cross along with supporting EMA and SMA alignment.
Mean Reversion Mode: Fades overextended moves targeting standard deviation extremes outside the Volume Weighted Average Price (VWAP).
Comprehensive Visual HUD & Dashboard: Built-in table tracking real-time asset distance from VWAP deviations, current ORB structures, and Yesterday's High/Low reference bands.
Capital Protection Guardrails: Fully restricted by a mandatory daily trade ceiling cap (maxTrades) preventing over-trading and emotional revenges during choppy distributions.
How to Trade It & Visual Legends
▲ LONG / ▼ SHORT: Clear entry signals plotted on the candle trigger.
TP1 Label (Small ✖): Confirms Target 1 was successfully scaled. Protection parameters for remaining units instantly snap to the entry price line.
TP2 TARGET Label (Large ✖): Confirms the final target was met and the trade has successfully completed.
STOP Label (✖): Highlights where either initial structural stop-loss or breakeven parameters were hit.
Inputs and Configurations
ORB Window: Default setup at 0930-0945 (First 15 minutes of the New York session).
Trading Hours: Default trading execution cutoff at 1130 to prevent trading into low-liquidity afternoon lunch doldrums.
Risk Metrics: Fully adjustable ATR multipliers for complete adaptability across volatile timeframes (1-minute, 3-minute, or 5-minute charts). Indicador

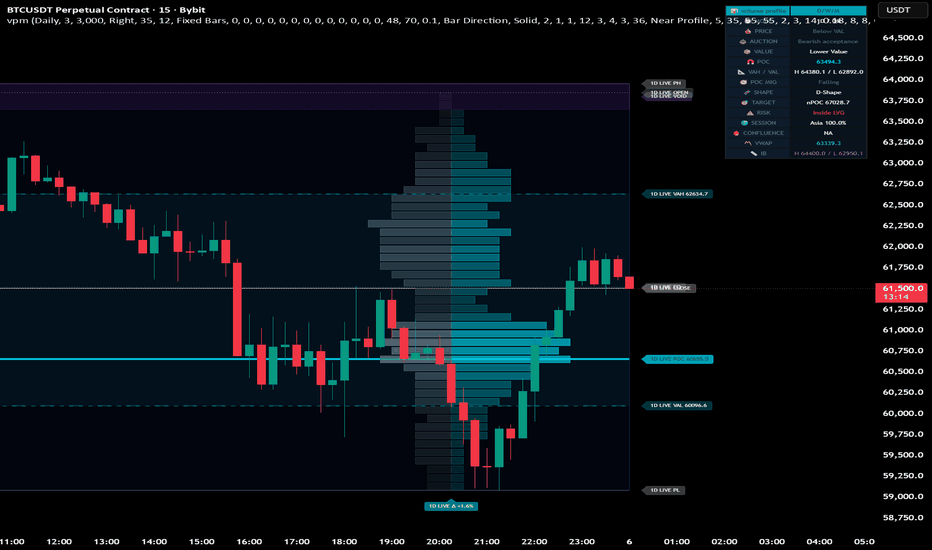
volume profil multitimeframe**Volume Profile D/W/M — Auction Map**
Volume Profile D/W/M is a visual auction-analysis indicator designed to display confirmed Daily, Weekly, or Monthly volume profiles on the chart. It focuses on value areas, volume concentration, auction structure, and important reaction zones. The script is intended for discretionary market analysis and does not generate automatic buy or sell signals.
---
## Overview
This indicator builds a volume profile from a selected confirmed period:
* Daily
* Weekly
* Monthly
Only one mode is active at a time. The goal is to keep the chart readable while still showing the most important auction levels.
The profile highlights where volume was concentrated during the selected period and displays key levels such as POC, VAH, VAL, HVN, LVN, VWAP, Initial Balance, naked POC levels, imbalance zones, confluence zones, and auction-state information.
---
## Main Features
### Confirmed Volume Profile
The script draws confirmed profiles from closed periods. This makes historical profiles stable and prevents them from constantly changing after the period has closed.
Available profile modes:
* Daily profile
* Weekly profile
* Monthly profile
The current developing profile can also be displayed with the dedicated option, but it should be understood as a live preview and not as a confirmed profile.
---
### POC, VAH and VAL
The script displays the main volume profile levels:
* POC: the price row with the highest volume
* VAH: upper boundary of the value area
* VAL: lower boundary of the value area
These levels are used to read market acceptance, rejection, rotation, and possible return-to-value behavior.
---
### HVN and LVN
The script can highlight:
* HVN: high-volume nodes, where the market accepted price
* LVN: low-volume nodes, where price often moved quickly or found less acceptance
HVN levels may act as areas of balance or reaction. LVN levels may act as rejection zones or acceleration zones depending on context.
---
### Bull / Bear Split and Delta Imbalance Rows
Each profile row can be split into bullish and bearish volume estimates. This helps visualize whether a price area was dominated by bullish or bearish pressure.
The indicator also includes imbalance rows, which highlight areas where one side strongly dominated the row volume.
To avoid label clutter, imbalance labels can be displayed as:
* a single multiplier label
* one label per row
* no label
The multiplier mode is recommended for normal use.
---
### Confluence Zones
The confluence module looks for clusters where several important levels are close to each other.
Examples of levels used in confluence:
* POC
* VAH / VAL
* HVN / LVN
* Period open / close
* Naked POC
* Profile high / low
* Poor high / poor low
* Composite levels
A confluence zone does not predict direction by itself. It simply marks an area where several auction references are grouped together.
---
### Naked POC Tracking
The script can track previous POC levels that have not yet been revisited. These levels are often watched as potential return-to-value or magnet zones.
Naked POC levels include status logic such as:
* Fresh
* Tested
* Respected
* Broken
* Dead
The extension distance can be adjusted so naked POC levels do not appear too far away from the rest of the profile.
---
### VWAP and Initial Balance
The indicator includes optional period VWAP and VWAP bands.
It can also display Initial Balance levels:
* IB High
* IB Low
* IB Mid
* 1x / 2x IB extensions
These tools are useful for reading whether price is rotating inside value, expanding away from balance, or failing an attempted breakout.
---
### Auction Dashboard
The dashboard summarizes useful auction information such as:
* selected mode
* current price location
* auction state
* value relation
* POC migration
* profile shape
* nearest target
* risk zone
* dominant session
* confluence score
* POC, VAH, VAL, VWAP and IB information
The dashboard is only a reading aid. It should not be used as a standalone trading system.
---
## Beginner Tutorial
### Step 1 — Choose the Profile Mode
Start with Daily mode.
Daily mode is usually the easiest to understand because each profile represents one completed trading day.
Once you are comfortable, you can test Weekly and Monthly modes to read the larger market structure.
---
### Step 2 — Read the Main Levels
Start with three levels:
* POC
* VAH
* VAL
A simple way to read them:
* Price above VAH: market is trading above accepted value
* Price below VAL: market is trading below accepted value
* Price around POC: market is rotating near the main accepted price
* Price between VAH and VAL: market is inside value
---
### Step 3 — Look for Reaction Areas
After the basic value area is understood, check:
* HVN zones
* LVN zones
* naked POC levels
* confluence zones
* VWAP
* Initial Balance
Do not use every line as a trade signal. The goal is to identify areas where price may react, pause, reject, or accelerate.
---
### Step 4 — Use the Dashboard
The dashboard helps summarize the profile state.
For example:
* If price is above VAH and POC migration is rising, the market may be accepting higher prices.
* If price rejects above VAH and returns inside value, it may indicate a failed auction.
* If price is near a confluence zone, the area may deserve more attention.
---
## Example Use Cases
### Example 1 — Return to Value
Price trades above VAH, fails to hold, and returns inside the value area.
A trader may watch for a rotation back toward POC.
This is not a direct entry signal. Confirmation should come from price action, market structure, or another method.
---
### Example 2 — POC Magnet
Price moves away from the previous POC but later returns toward it.
A naked POC or composite POC may act as a reference level where traders expect a reaction or pause.
---
### Example 3 — LVN Acceleration
Price approaches an LVN zone.
Because LVN zones represent low acceptance, price may either reject quickly or move through the area with speed.
The direction depends on context, not on the LVN alone.
---
### Example 4 — Weekly Context, Daily Execution
A trader can use Weekly mode to identify larger auction levels, then switch back to a lower chart timeframe to observe how price reacts near those levels.
This helps separate macro context from execution timing.
---
## Recommended Timeframes
The script is not designed for very low timeframes with heavy settings.
Recommended chart timeframes:
* 5 minutes and above for Daily mode
* 15 minutes and above for Weekly mode
* 15 minutes, 30 minutes, or 1 hour for Monthly mode
Using the script on a 1-minute chart is not recommended, especially with Weekly or Monthly mode, developing profile enabled, high profile rows, many historical profiles, or multiple visual modules active.
Very low timeframes may require too many historical bars or too many drawing objects, which can cause TradingView limits to be reached.
---
## Performance Recommendations
For stable use, start with these settings:
* Profiles History: 3
* Profile Rows: 48
* Current Developing Profile: Off
* Imbalance Labels: Multiplier
* Composite Display: Near Profile
* Naked POC extension: short distance
If the chart becomes heavy, reduce:
* profile rows
* history count
* developing profile
* imbalance zones
* VWAP bands
* Initial Balance extensions
* confluence labels
---
## Important Notes
This indicator is an analytical tool, not a trading system.
It does not predict the market and does not provide guaranteed results. All levels should be interpreted with market context, price action, risk management, and the trader’s own strategy.
Volume profile analysis is most useful when combined with structure, trend, volatility, session behavior, and confirmation from price action.
Use the script to build a map of important auction areas, not as a standalone reason to enter or exit a trade.
Indicador
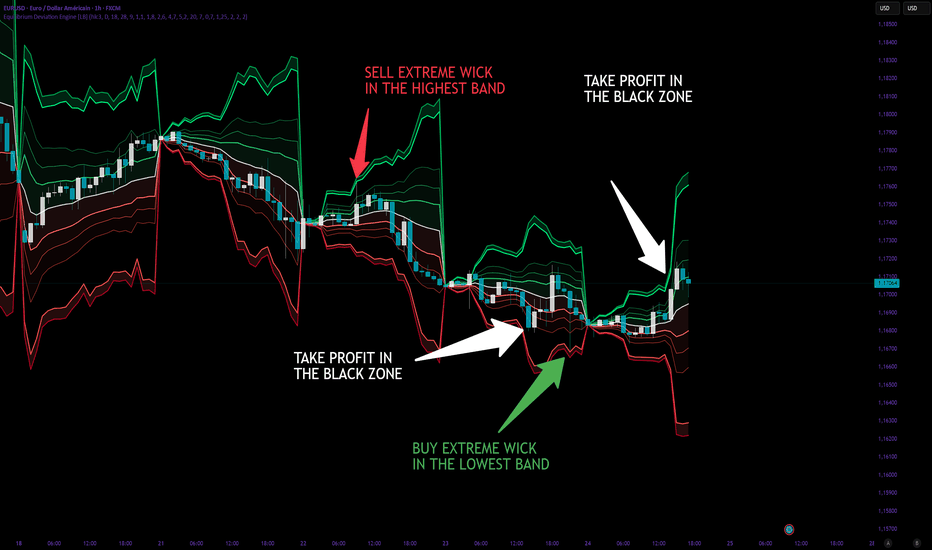
Equilibrium Deviation Engine [LB]
Concept
The Equilibrium Deviation Engine is a session-resetting, volume-weighted equilibrium model that builds a dynamic fair value basis from accumulated price and volume since the last anchor point (daily by default). Around this basis, it constructs multiple deviation bands and an independent extreme contrarian channel whose width varies inversely with short-term volatility — expanding during quiet markets and contracting during turbulent ones.
Mathematical Foundation
At each new session (e.g., daily open), the engine resets three accumulators and recalculates them bar by bar :
PV = SUM(Price * Volume)
V = SUM(Volume)
P2V = SUM(Price^2 * Volume)
The equilibrium basis is the volume-weighted average price since reset :
Basis = PV / V
The standard deviation of price around this basis is derived from the variance :
Var = max( (P2V / V) - Basis^2 , 0 )
Dev = sqrt(Var)
Three main bands are then computed by applying adaptive multipliers to this deviation. The adaptation uses two independent weights :
TWAP Weight — compares the basis to a hidden TWAP. The larger the gap relative to the deviation, the more the bands widen, capturing potential mean-reversion targets.
HV Weight — compares current historical volatility (HV) to its own smoothed baseline. When HV expands, bands widen ; when HV contracts, bands narrow.
The final band width for level k is :
D_k = Dev * Mult_k * TWAP_Weight * HV_Weight
The Extreme Contrarian Channel
A separate channel is built using an inverse volatility weight. Instead of expanding with rising HV, it contracts :
InvWeight = clamp( 1 / (HV_contrarian / HV_contrarian_baseline) , min, max )
This creates a structural envelope that is widest during low-volatility regimes (where price tends to range) and tightens during high-volatility regimes (where price breaks through normal boundaries). The inner and outer levels use user-defined sigma multipliers.
What Problem Does It Solve ?
Traditional deviation bands (Bollinger, Keltner, VWAP bands) use fixed lookback windows and a single volatility metric. They do not reset at session boundaries, nor do they distinguish between different volatility regimes for mean-reversion versus breakout scenarios. The Equilibrium Deviation Engine solves this by :
- Resetting accumulators at each session (e.g., daily), producing a true volume-weighted equilibrium for the current period.
- Adapting band width to both the TWAP gap (directional drift) and HV regime (market excitement).
- Adding a separate contrarian channel using inverse volatility, specifically designed to identify exhaustion zones where low volatility precedes expansion, or where extreme HV signals climax conditions.
How To Interpret
Basis line (white) — the real-time volume-weighted fair value for the current session. Price above basis signals session bullishness ; price below signals session bearishness.
Deviation bands 1, 2, 3 — graduated zones of overextension from the basis. Price reaching Band 3 represents an extreme statistical deviation from the session's equilibrium, often preceding reversion.
Extreme contrarian channel — a separate envelope that behaves inversely to short-term HV. When this channel is wide (low HV, quiet market), price tends to oscillate within it, making the boundaries attractive mean-reversion levels. When the channel narrows sharply (high HV, excited market), it signals compression before a potential breakout.
Band expansion vs contraction — widening bands indicate increasing dispersion and adaptive uncertainty ; narrowing bands indicate consolidation and equilibrium tightening.
Parameters
LB Engine
Source — price field used for calculations (default HLC3).
Reset TF — timeframe at which accumulators reset (default Daily).
Hidden TWAP Length — period for the TWAP used in the TWAP gap weight.
Historical Volatility Length — period for HV calculation (main bands).
HV Smoothing — smoothing period for the HV baseline.
LB Bands
Deviation 1, 2, 3 — base multipliers for the three main deviation levels.
LB Contrarian Channel
Extreme Channel Inner/Outer — sigma multipliers for the contrarian channel.
Use Main HV Weight — applies the main HV weight to the contrarian channel.
Use Hidden TWAP Weight — applies the TWAP gap weight to the contrarian channel.
Contrarian Inverse HV Length — period for the HV used in the inverse weighting.
Contrarian Inverse HV Smooth — smoothing period for the contrarian HV baseline.
Contrarian Inverse HV Min/Max — clamping limits for the inverse weight.
LB Style
Show Basis, Show Main Fills, Color Bars — visual toggles.
Basis Width, Band Width, Extreme Channel Width — line thickness controls.
Reference
This indicator is a proprietary design by Luis Barlier. It synthesises concepts from session volume-weighted average price (VWAP), adaptive volatility bands, and inverse volatility regime detection. It does not correspond to a single academic publication. Indicador
Anchored VWAP ChannelAnchored VWAP Channel — Regime, Confluence & Reversals
What it is
This is a single overlay that builds a complete read of price around one Anchored VWAP. Instead of just drawing a VWAP line, it wraps the VWAP in a volatility channel and then layers the context a discretionary trader normally checks by eye — where price sits versus fair value, whether the move is trending or stretched, where high-volume and Fibonacci levels line up, and where the edges are getting rejected. Everything is derived from the same anchor and measured in the same volatility unit (one standard deviation, σ), so the pieces describe one structure rather than competing with each other.
It runs on any asset class and any timeframe. On instruments that carry real volume (stocks, futures, crypto, etc.) the VWAP, the channel, and the volume profile are fully volume-weighted; on feeds without real volume it falls back gracefully and flags the change in the table (see "Notes and limitations").
Why these components are combined (and how they work together)
This is intentionally a mashup, and the parts are chosen because they answer different questions about the same reference point:
• The Anchored VWAP is the fair-value anchor — the volume-weighted average price since a chosen pivot.
• The channel turns dispersion around that anchor into a measurable unit: the bands are the AVWAP ± k·σ, where σ is the volume-weighted standard deviation of price about the VWAP. This converts "how far is price from fair value" into a number (σ-distance) every other module can reuse.
• The regime read uses that σ-distance together with the VWAP slope and the band behaviour to label continuation vs reversal — so the same channel that draws the bands also tells you whether to trust a band tag or fade it.
• The volume profile (Point of Control + Value Area) is computed over the same anchored window, so the high-volume price and the value range are measured on exactly the data the VWAP is built from — not an arbitrary separate lookback.
• The Fibonacci grid is drawn on the active swing leg and is only emphasised where a level coincides with the VWAP, a band, or the POC. The channel and profile are what make a fib level meaningful here; on their own the fib levels would be just lines.
• The reversal signals fire on outer-band rejections, and the optional confluence filter suppresses them while the regime is strongly trending (when band tags tend to continue) — i.e. one module gates another.
In short: the channel produces a σ-distance, and the regime, profile, fib confluence, reversal logic, divergence and squeeze modules all consume that single shared measurement. That shared plumbing is the reason these are bundled into one script instead of run as six separate indicators.
What it plots
• Anchored VWAP centerline with a glow halo, colored by slope direction.
• Channel bands at ±1σ and ±2σ. The fill can be a "reversion heat" gradient (denser toward the outer band, red above the VWAP, green below) or a neutral glow, or off.
• Volume profile drawn as a translucent Value Area box (VAL→VAH) with a distinct POC line — kept visually and positionally separate from the fib lines so the two are never confused.
• Fibonacci grid (active-leg retracement, plus optional swing-to-swing), with confluence levels marked by a star and a brighter tone.
• Signals: trend-shift triangles on VWAP reclaim/loss; solid reversal labels on band rejections; diamonds and connecting lines for σ-distance divergence; a marker on volatility-squeeze release.
• Status table (single panel): regime, bias, σ-distance, AVWAP, POC, Value Area, squeeze state, divergence, a reversion stop/target/RR template, a data-health row, multi-timeframe regime agreement, and a built-in legend.
• Optional forward projection cone and an optional self-calibration panel that scores how past signals resolved.
Anchor modes
Rolling (fixed bar window), Swing Low, Swing High, or Dual (auto — anchors to the more recent significant pivot). Pivot detection uses bar-count lookbacks (8/13/21/34/55/89), so the entire tool self-scales to any timeframe.
How to use it
1. Read the table first: regime + σ-distance tell you whether price is trending or stretched, and how far from fair value it is.
2. Use the bands as context — near the centerline is fair value; the ±2σ edge is where reversion risk is highest (and the heat fill shades it).
3. Treat reversal labels as fade-the-stretch signals, strongest when the regime is not trending and when a divergence diamond agrees.
4. Use trend-shift triangles (VWAP reclaim/loss) for continuation context.
5. Use fib-confluence stars and the Value Area box / POC as the levels most likely to react.
6. Check multi-timeframe agreement in the table before acting.
7. Optionally turn on the calibration panel to see, on your own symbol and timeframe, how often each signal type has historically followed through.
What makes it original
• A single shared σ framework: bands, regime, divergence, reversals and risk template all read from one volume-weighted standard-deviation measurement around one anchor, rather than bolting unrelated indicators together.
• Reversion-heat channel fill that encodes reversion risk as color density.
• Confluence-filtered reversals — band rejections gated by regime/divergence.
• Volume profile rendered as a separated zone so it never blends into the fib levels.
• A transparent self-calibration panel that scores the script's own signals against a follow-through threshold (descriptive, not a backtest).
Key settings
• Calculation Source — works on any asset/market; default hlc3, switchable to close, hl2, ohlc4, etc.
• Anchor mode and pivot/rolling length.
• Inner/outer band multipliers and fill style.
• Signal sensitivity, session-open filter, reversal-confirmation strictness.
• Table position / text size / legend, and toggles for every module.
Notes and limitations
• Signals are evaluated on closed bars; the σ-distance divergence confirms a few bars after a pivot by design, so it prints late (this is normal for pivot-based divergence and is not repainting of confirmed history).
• Last-bar drawings (profile, fib, projection cone) are redrawn on each new bar and will shift forward — that is expected.
• Asset classes / volume: runs on any market and any timeframe. On instruments that carry real volume (stocks, futures, crypto, etc.) the Anchored VWAP, the volume-weighted σ channel, and the Volume Profile (POC / Value Area) are all fully volume-weighted as intended. On feeds with no real volume (e.g. spot forex, some indices / CFDs) the script still works but degrades gracefully: the VWAP becomes a simple anchored mean, the channel uses an unweighted standard deviation, and the profile becomes a time-at-price distribution. The Data row in the table flags this state as "no-vol / DEGRADED" so you always know which mode you are in.
• The multi-timeframe dashboard uses higher-timeframe requests; you can turn it off to reduce load.
• This is an analysis/visualization tool, not a strategy — it does not place orders and is not optimized or backtested for entries/exits.
Disclaimer
This script is provided for educational and informational purposes only and is not financial, investment, or trading advice. It does not predict future prices. Markets carry risk and you can lose money. Past behaviour of any signal (including the calibration panel) does not guarantee future results. Always do your own research and consider consulting a licensed financial professional before trading. You are solely responsible for your decisions and their outcomes.
Indicador

VWAP Anker: Time, ATH/ATL, Swings, Pivots & Dynamic AlertsVWAP Ultimate: Time, ATH/ATL & Bear-Market Swings
VWAP Ultimate combines multiple important VWAP anchors into a single indicator, helping traders identify institutional price levels, long-term market structure, and key support and resistance zones.
Instead of relying on a single traditional VWAP, this indicator provides several anchoring methods that offer different perspectives on market behavior.
Included VWAP Types
📅 Time-Based VWAPs
Daily VWAP
Weekly VWAP
Monthly VWAP
These VWAPs automatically reset at the beginning of each new period and are especially useful for:
Intraday trading
Swing trading
Trend identification
Dynamic support and resistance levels
🚀 All-Time High VWAP (ATH VWAP)
This VWAP is anchored from the asset's historical all-time high.
Use cases:
Evaluating market strength after major bullish moves
Identifying long-term resistance and support zones
Estimating institutional cost basis above historical highs
📉 All-Time Low VWAP (ATL VWAP)
This VWAP is anchored from the asset's historical all-time low.
Use cases:
Analyzing long-term accumulation phases
Identifying major support areas
Evaluating long-term market cycles
🐻 Bear Market Swing VWAPs
The indicator detects significant swing highs and swing lows using a 20/20 pivot structure.
Calculated levels:
VWAP anchored to the most recent significant swing high
VWAP anchored to the most recent significant swing low
These levels are particularly useful during:
Bear markets
Market corrections
Trend reversals
Identification of institutional entry and exit zones
Customization
Each VWAP category can be enabled or disabled independently:
✅ Time-Based VWAPs (D/W/M)
✅ ATH / ATL VWAPs
✅ Bear Market Swing VWAPs
This allows traders to tailor the chart to their specific trading style and analysis needs.
Markets & Use Cases
This indicator can be applied to:
Stocks
Cryptocurrencies
Indices
Futures
Forex
It is especially valuable for traders and investors who analyze multiple time horizons and want to combine key market anchors into a single tool.
Core Concept
VWAP levels are widely used by institutional market participants as a benchmark for fair value. By combining time-based, historical, and structural anchor points, this indicator provides a broader view of market structure than a standard VWAP alone.
A comprehensive tool for analyzing trend direction, market structure, and long-term support and resistance levels within a single indicator. Indicador

Indicador

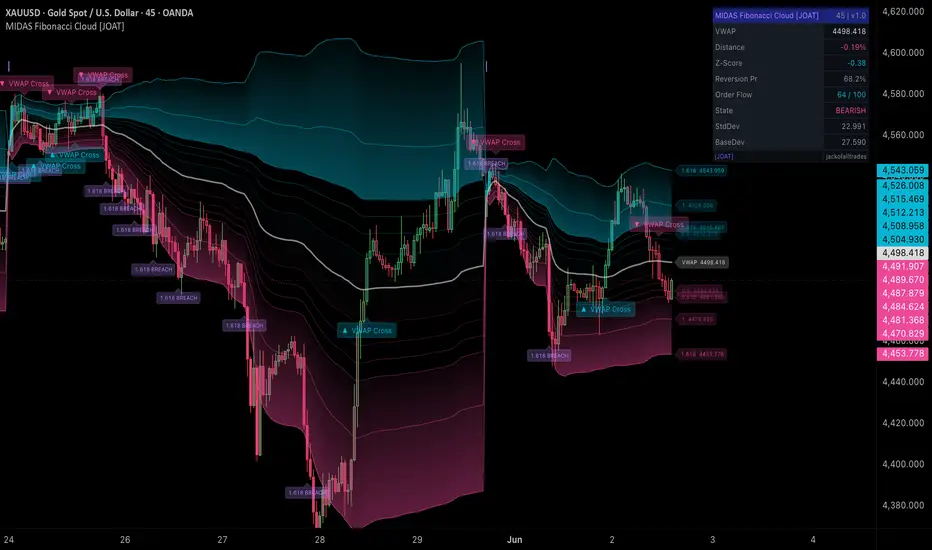
MIDAS Fibonacci Cloud [JOAT]MIDAS Fibonacci Cloud
Introduction
MIDAS Fibonacci Cloud is an open-source VWAP-based analytical tool that combines a MIDAS-anchored volume-weighted average price with six Fibonacci-scaled standard deviation bands, a Z-score probability engine, and a synthetic order flow score to produce an integrated picture of institutional value, statistical deviation, and directional pressure on a single overlay.
The problem this solves is band relevance. Standard VWAP deviations use fixed multipliers (1×, 2×, 3× standard deviation) that carry no structural meaning in market terms. Replacing those multipliers with Fibonacci ratios (0.236, 0.382, 0.5, 0.618, 1.0, 1.618) means the band levels correspond to proportional retracement relationships that institutional participants commonly reference. The 1.618 band in particular acts as an extreme extension zone where reversion probability, quantified by the built-in Z-score engine, typically exceeds 99.7%.
Core Concepts
1. MIDAS VWAP with Configurable Anchoring
The VWAP calculation uses the MIDAS method — cumulative volume-weighted price that resets at a user-selected anchor point rather than running as a continuous session VWAP. The anchor can be set automatically (based on the current timeframe), manually to a specific higher timeframe, or to a precise date. This allows the VWAP to be anchored to any significant market event.
The variance term used for standard deviation is computed directly from the volume-weighted sum of squared prices, producing a statistically correct VWAP standard deviation:
float midasVwap = sumVolPrice / sumVol
float variance = (sumVolSq / sumVol) - math.pow(midasVwap, 2)
float stdDev = math.sqrt(math.max(0, variance))
2. Fibonacci Deviation Bands
Six band pairs are computed above and below the VWAP anchor using the standard deviation scaled by a global sensitivity multiplier and each Fibonacci ratio. Upper bands are colored in the bull theme color with decreasing opacity from band 1 to band 6; lower bands in the bear theme color with the same gradient. A gradient fill connects the outer zone (fib4–fib6) to visually highlight the extreme deviation region.
3. Z-Score and Bell Curve Probability
Each bar's Z-score is computed as the signed distance from the VWAP in units of standard deviation. The dashboard converts this to a mean-reversion probability using standard normal distribution thresholds: within 1σ = 68.2%, within 2σ = 95.4%, within 3σ = 99.7%, beyond 3σ = 99.9%.
4. Synthetic Order Flow Score
A bar-level order flow score is computed from three components: candle body-to-range ratio (directional conviction), volume relative to the 20-bar average (institutional participation), and wick rejection percentage (price acceptance or rejection). These are weighted 40/35/25 and scored 0 to 100. VWAP crossover signals are gated by this score — crossovers with low order flow scores are filtered as noise.
5. Gradient Fill Zones
The two outer Fibonacci bands (fib4 and fib6) are connected with a gradient fill that creates a visual glow effect identifying the extreme deviation zones — the regions where price is statistically most likely to be overextended.
Features
MIDAS VWAP with three anchor modes: Auto (timeframe-adaptive), Timeframe (manual higher TF), Date (specific date anchor)
Six Fibonacci deviation band pairs: Levels at 0.236, 0.382, 0.500, 0.618, 1.000, 1.618 × standard deviation × global sensitivity
Gradient fill on extreme zones: Color-to-transparent gradient between fib4 and fib6 identifies overextension zones
Z-score and reversion probability: Computed every bar with bell curve probability output (68.2% / 95.4% / 99.7% / 99.9%)
Synthetic order flow gate: Body ratio, volume participation, and wick rejection combined into a 0-100 score that gates VWAP cross signals
Candle coloring by Z-score: Bar colors intensity-coded by distance from VWAP — neutral near center, saturated at extremes
Band labels at right edge: Each band level labeled with its Fibonacci ratio and price value, updated each bar
Anchor reset marker: Vertical marker in elite theme color at each VWAP reset point
Four color themes: Phantom, Neon, Classic, Solar
Non-repainting: VWAP and bands computed cumulatively from anchor; no future data referenced
Institutional dashboard: 8-row table showing VWAP price, distance %, Z-score, reversion probability, order flow score, and market state
Input Parameters
Anchor Settings:
Anchor Method: Auto / Timeframe / Date
Manual Timeframe: Timeframe to anchor to when method is Timeframe
Manual Date: Specific timestamp when method is Date
Fibonacci Multipliers:
Global Sensitivity: Scales all band widths proportionally (default: 1.2)
Fib Level 1 through 6: Individual Fibonacci ratios (defaults: 0.236, 0.382, 0.500, 0.618, 1.000, 1.618)
Visual Styles:
Color Theme: Phantom / Neon / Classic / Solar
Highlight Candles: Toggle candle coloring by Z-score
Show Band Labels: Toggle right-edge price labels on each band
Table Position and Size
How to Use This Indicator
Step 1: Choose Your Anchor
For intraday scalping, use Auto or Daily anchor. For swing trading, use Weekly or Monthly. For event-driven analysis, use Date and anchor to a specific earnings release, FOMC announcement, or major swing point.
Step 2: Read Band Levels as Statistical Reference
The 0.5 band is one half standard deviation from VWAP — a mild deviation typical of normal trending behavior. The 1.618 band is the extreme extension zone. Price at the 1.618 band has a statistical reversion probability above 99.7%, but this does not mean reversion is imminent or guaranteed.
Step 3: Check the Reversion Probability
Read the Reversion Prob row in the dashboard. As Z-score rises above 2, reversion probability exceeds 95.4%. This quantifies how unusual the current deviation is relative to the full history from the anchor point.
Step 4: Confirm with Order Flow Score
The Order Flow score reflects whether the current bar has institutional characteristics. A high score (above 60) during a VWAP cross suggests genuine participation. A low score (below 30) during a cross suggests a potentially false signal.
Indicator Limitations
The VWAP standard deviation widens significantly with the anchor period. Bands anchored to a six-month period will be very wide; bands anchored to one day will be tight. The global sensitivity parameter must be adjusted accordingly
The Z-score probabilities assume normally distributed returns, which markets do not produce. Fat tails mean extreme Z-scores occur more frequently than the percentages suggest
The synthetic order flow score uses tick volume as a proxy for actual order flow. On assets with low tick frequency, this approximation is less reliable
VWAP-based analysis is most relevant for liquid instruments
This indicator does not generate entry or exit signals. It provides statistical deviation context
Originality Statement
Replacing standard deviation band multipliers with Fibonacci ratios (0.236 through 1.618), scaled by a volume-weighted standard deviation from a MIDAS anchor, is not replicated in existing open-source Pine Script v6 VWAP publications
The combination of Z-score computation, bell curve probability quantification, and a synthetic order flow score as a gate for VWAP cross signals within a single indicator is an original integration
The candle coloring gradient driven by Z-score intensity provides real-time deviation awareness directly on price bars without requiring a separate oscillator panel
Disclaimer
This indicator is provided for educational and informational purposes only. It is not financial advice. Trading involves substantial risk of loss. Statistical deviation probabilities are based on a normal distribution assumption that financial markets do not satisfy. Past VWAP behavior does not predict future price action. The author accepts no responsibility for trading losses resulting from use of this indicator.
Made with passion by jackofalltrades
Indicador

SXA: Super Xtation Amplitude | MTF FrameworkSXA (Super Xtation Amplitude) is a multi-timeframe market positioning framework designed to provide a complete visual overview of price location within the broader market structure.
Rather than focusing on entry signals, SXA combines trend context, volatility, session activity, anchored VWAPs, prior-day reference levels, Fibonacci projections, and higher-timeframe moving averages into a single environment. The objective is to help traders understand where price is currently trading relative to statistically and structurally significant areas.
The indicator was built around a simple principle:
"Price behaves differently depending on where it is located within the market."
By integrating multiple forms of context into one view, SXA allows traders to quickly identify premium and discount zones, trend alignment, session-driven liquidity areas, and potential reaction levels without switching between multiple indicators.
FEATURES
• Smart Trend Engine
Multi-timeframe moving average framework designed to visualize short, intermediate, and macro directional bias.
• Dynamic Trend Clouds
Visual cloud structures help identify trend alignment and potential transition zones between bullish and bearish conditions.
• Higher Timeframe Context
Daily 50 SMA and 200 SMA provide broader market structure and long-term directional references.
• Prior Day Reference Levels
Automatic plotting of previous day's Open, High, Low, and Close.
• Fibonacci Expansion Grid
Extended Fibonacci projections derived from the previous day's range to identify potential reaction zones and liquidity targets.
• Anchored Session VWAPs
Includes:
* Daily VWAP
* European Session VWAP
* Pre-New York VWAP
* New York Session VWAP
* Post-European Session VWAP
These levels provide institutional-style references for price acceptance and value.
• Weekly Structure Levels
Dynamic weekly Open, High, and Low levels update in real time throughout the trading week.
• Session Mapping
Visual session boxes highlight important market periods, including the Asian session and Pre-New York range.
INTENDED USE
SXA is designed as a contextual decision-support tool rather than a standalone trading system.
The indicator can be used to:
* Assess overall market positioning.
* Identify trend alignment across multiple timeframes.
* Locate potential support and resistance zones.
* Track session-driven liquidity.
* Monitor volatility expansion and contraction.
* Build discretionary trade narratives.
* Enhance existing trading systems.
SXA does not generate buy or sell recommendations. Instead, it seeks to answer a more fundamental question:
"Where is price currently located within the broader market landscape?"
By providing that context at a glance, traders can make more informed decisions while reducing chart clutter and indicator overload.
Created by @Peter_n_n
Indicador

Ribbon Conviction SystemRibbon Conviction System — Trend, Flow, Value and Adaptive Stop
Overview
This is a single decision-support system for intraday traders. It answers three questions on one chart: which way is the trend, how much conviction is behind the current move, and where a logical trailing stop sits. A moving-average ribbon defines direction, a conviction score from 0 to 100% grades every signal, and an adaptive volatility stop marks risk. The components are designed to work together as one filtered signal, not as a loose collection of separate indicators.
Why these components are combined
A moving-average crossover on its own fires constantly in sideways markets and gives no sense of whether a cross is meaningful. Each part added here exists to fix a specific weakness of the part before it, so the result is one filtered signal rather than several indicators stacked on a chart.
Ribbon (direction). Five Fibonacci-length averages — 8, 13, 21, 34, 55 — using a mix of Hull, EMA and Kaufman Adaptive Moving Average (KAMA). The KAMA anchors deliberately flatten in choppy conditions, so the ribbon stops giving direction when there is no trend. Weakness it leaves open: a crossover can still fire on a weak, low-conviction move.
Conviction score (filter). Instead of taking every crossover, each signal is graded 0–100% by blending four independent readings of the same bar, chosen because they measure different things rather than repeat each other:
Buy/sell flow — net buying versus selling pressure, inferred from lower-timeframe price-and-volume behaviour.
Effort vs move — how far price travelled for the volume spent; absorption and churn are penalised.
Trend quality — Kaufman Efficiency Ratio: directional travel divided by total path, separating trend from noise.
Price location — is price on the right side of value? Blends session VWAP slope, a swing-anchored VWAP, the session volume-profile value area (VAH/VAL/POC), and the prior session's VWAP and unfilled POC.
A flow-toxicity proxy (VPIN-style) then lowers the score when flow looks one-sided and unstable. Weakness it leaves open: all four readings come from the chart timeframe, so they can agree for the wrong reason.
Higher-timeframe agreement (independent confirmation). The same volatility-stop direction is computed on 3×, 5× and 15× the chart timeframe and folded in as a multiplier, not a fifth blended input. It is kept separate precisely because it is the one genuinely independent check on the chart-timeframe score: full agreement raises conviction, disagreement lowers it.
Adaptive volatility stop (risk). A Chande-style volatility stop whose ATR period and multiplier adapt through the Efficiency Ratio, so the stop tightens in clean trends and widens in chop. This turns the tool from "where is the signal" into "where is my risk if I take it."
How they work together
Direction (ribbon) decides the side. The conviction score decides whether a crossover on that side is worth showing and how strongly. Higher-timeframe agreement scales that conviction up or down. The adaptive stop shows the exit reference. Every signal is the product of all four stages working in sequence.
What it plots
The five-average ribbon with shaded bands; the 55 line is the bold trend-reference band.
Signal badges at qualifying crossovers, labelled with the band crossed and the conviction percent (for example "21 65%").
Optional value references: session VWAP, swing-anchored VWAP with bands, volume-profile VAH/VAL/POC, and the prior session's VWAP and POC.
The adaptive volatility stop as a step line with a live distance label.
A compact dashboard summarising trend, conviction and each component, higher-timeframe agreement, the stop, and the data mode.
A small higher-timeframe agreement ribbon.
How to use
Add it to an intraday chart. The defaults suit index futures, but direction works on any symbol.
Spot vs futures: many spot indices publish no real volume, which the flow, value-area and toxicity parts depend on. Under "Data source" the script auto-detects this and switches the volume-based parts to a time-at-price method so everything still works; you can also set the mode manually. The dashboard "Data" row shows which mode is active.
Trade in the ribbon's direction. Prefer signals with a higher conviction percent and higher-timeframe agreement, and treat low-conviction crosses as noise. Use "Hide signals weaker than" to suppress them.
Use the adaptive stop as a trailing-risk reference, sized to your own plan.
The "Look & size" group controls signal size, dashboard size and position, a "Minimal" preset (ribbon + signals + stop only), and band lightness.
Originality
The individual techniques — adaptive moving averages, the Efficiency Ratio, effort-versus-result, VWAP, volume profile and volatility stops — are publicly documented. What is original here is the integration: a single conviction score that fuses chart-timeframe flow, effort, efficiency and value, damps it by flow toxicity, and scales it by independent higher-timeframe agreement, then gates an adaptive-stop-aware signal on that score. The components were selected so each covers a distinct weakness, and redundant filters were deliberately left out to keep one clear signal.
Credits
Perry Kaufman — Adaptive Moving Average and Efficiency Ratio. Tushar Chande — Volatility Stop concept. The effort-versus-result component is an original, compact reimplementation inspired by the publicly described effort-versus-result method from the volume-spread-analysis lineage.
Disclaimer
This script is for education and information only. It is not financial, investment or trading advice and does not guarantee any outcome. Signals describe current conditions; they do not predict the future. Markets carry substantial risk of loss. Volume-based readings depend on the data feed and are unreliable on instruments without real volume. Always test on your own market and timeframe, and manage risk with your own stops and position sizing. The author is not a licensed financial advisor; consult a qualified professional before making financial decisions. You are solely responsible for your own trading decisions. Indicador

CLBS Reaction ZonesCLBS Reaction Zones is an educational market-structure indicator designed to map important reaction areas on the chart.
CLBS stands for Context, Levels, Behavior and Strategy.
This script combines multiple market reference concepts into one structured visual map. The purpose is not to generate buy or sell signals, but to help traders observe where price may react, accept, reject, rotate or expand.
Main components:
• Developing day levels
• Previous day levels
• Developing week levels
• Previous week levels
• Developing month levels
• Previous month levels
• Initial Balance High and Initial Balance Low
• Initial Balance range projection
• Developing day Point of Control, Value Area High and Value Area Low
• Daily, Weekly, Monthly, Quarterly and Yearly VWAP
• Optional VWAP bands
• Fair Value Gap zones using three-candle imbalance logic
VWAP logic:
The VWAP hierarchy uses anchored VWAP calculations for different periods. Daily VWAP resets at the start of each new day. Weekly VWAP resets at the start of each new week. Monthly VWAP resets at the start of each new month. Quarterly VWAP resets every three months. Yearly VWAP resets at the start of each new year.
VWAP is calculated using cumulative price multiplied by volume divided by cumulative volume for the selected period.
Value area logic:
The developing day value area uses a simple volume distribution model. Price is divided into buckets, volume is accumulated inside those buckets, and the highest-volume bucket becomes the developing Point of Control. Value Area High and Value Area Low are calculated around the Point of Control using the selected value area percentage.
Fair Value Gap logic:
Fair Value Gap zones are based on a three-candle imbalance model. A bullish gap is detected when the high from two candles back is below the current low. A bearish gap is detected when the low from two candles back is above the current high. Filled gaps can be removed automatically.
How to use:
Use this indicator as a market reading map. Watch how price behaves around VWAP, Initial Balance, previous session references, value area levels and fair value gaps. Reaction, acceptance and rejection around these levels can help traders build context.
This script is for educational and analytical use only. It does not provide financial advice, investment advice, trading recommendations, buy signals or sell signals. Traders should use their own analysis, risk management and decision-making.
Indicador

Indicador

VWAP SD2 Reversion (Long)A patient, momentum-confirmed dip buyer that fades stretches below the session VWAP and targets a return to the mean.
The idea
Intraday price tends to oscillate around its volume-weighted average price (VWAP). When price extends a full two standard deviations below the session VWAP, it is statistically stretched and often springs back toward the average. This strategy is built to capture that snap-back, but it deliberately does not buy the dip blindly. A stretched market can keep falling, so the strategy waits for two independent momentum tools to confirm that the down-move has actually turned before it commits.
The result is a sequential, time-boxed setup: a volatility filter, a price stretch, and then two momentum confirmations that must all line up within a short window. If they do not, the setup is discarded and the strategy stays flat.
How a trade is built
Each long requires the following to occur in order, with every step happening at or after the initial dip and within the confirmation window:
Volatility filter: the lower 2-SD band must sit at least a minimum distance from VWAP (default 10 pips). This skips quiet, low-range conditions where there is little room to revert and the costs would dominate.
Step 1, the stretch: price closes below the lower 2-SD band.
Step 2, RSI confirms: RSI recovers back above its level (default 30), confirming the oversold push is fading.
Step 3, MACD confirms: the MACD line turns bullish over its signal line (or over zero, if you prefer), confirming momentum has flipped up.
Entry: a market long is taken on the bar that completes Step 3.
Why a state machine
Real momentum turns are messy. RSI and MACD often flip within a bar or two of each other, and sometimes on the very same bar. A naive rule that demands three separate single-bar crossovers in strict order misses most of these clusters. This strategy instead tracks the setup through a small state machine that:
anchors both confirmations to the first dip bar, so a momentum cross that happened before the dip cannot be borrowed to validate the trade;
accepts confirmations that arrive in either order or on the same bar, as long as both are recent and post-dip;
keeps the setup alive while price continues to hug the band, and expires it cleanly once the confirmation window passes without a trigger.
A Strict toggle is provided for those who want the original behaviour, where each step must be a fresh crossover on a later bar.
How the exit works
Because the thesis is reversion to the mean, the natural profit target is the mean itself. By default the take-profit is the live VWAP, re-evaluated every bar so it tracks the line as it moves, set a small buffer in front so the order fills on the approach rather than waiting for an exact touch. A minimum-profit floor prevents a falling VWAP from dragging the target back through the entry.
A fixed-pip take-profit mode is available as an alternative. The stop-loss is a fixed pip distance below entry in both modes. Targeting the mean rather than a fixed number of pips tends to produce variable, often larger winners, which also dilutes the impact of fixed spread costs.
Settings
Setup
SD band multiplier — standard-deviation width of the bands (default 2.0).
Min VWAP to SD2 distance — the volatility filter, in pips (default 10).
Confirmation window — how many bars each step has to confirm (default 5).
Strict cross — require a fresh crossover on a bar after the prior step.
RSI and MACD
Standard RSI length and cross level.
Standard MACD fast, slow and signal lengths, with an optional zero-line cross instead of a signal-line cross.
Risk and pips
TP at VWAP, with a front-run buffer and a minimum-profit floor, or a fixed-pip take-profit.
Stop loss in pips.
Auto pip size (mintick × 10), which resolves correctly for 5-decimal FX and 3-decimal JPY pairs, plus a manual override.
Reading the chart
Orange line: session VWAP (the reversion target).
Red and green lines: the lower and upper 2-SD bands.
Markers: 1 marks a close below the band, 2 marks the RSI confirmation, and the triangle marks the MACD confirmation and entry trigger.
Intended use
This is an intraday strategy, developed and tuned on 5-minute FX majors, with a daily VWAP anchor that resets each session. In the author's testing it has behaved most consistently on AUDUSD, and it is also designed for pairs such as EURUSD and USDJPY. As always, behaviour varies by pair, broker feed and period, so test it on your own data before relying on it.
On backtest settings: tight intraday targets are sensitive to execution costs. Before drawing conclusions from the Strategy Tester, set a commission and slippage that match your broker, and choose a position size that reflects the risk you would actually take. Results shown with unrealistic costs can look far better than anything achievable live.
This script is published for educational and research purposes only and is not financial advice or a recommendation to trade. Backtested and hypothetical results do not guarantee future performance, and trading leveraged instruments such as FX carries substantial risk of loss. You are responsible for your own testing, risk management and decisions. Estrategia

Multi Timeframe ProMulti Timeframe Pro — HTF Levels + Anchored VWAP
Two indicators in one clean overlay: previous-candle ranges from up to 3 timeframes, plus a fully customizable anchored VWAP with bands.
▌ Features
• Boxes for the LAST CLOSED candle of up to 3 timeframes (High, Low, dashed Mid)
• Anchored VWAP with 2 standard-deviation bands — no background fills
• Live countdown table — see when the next candle of each TF closes
• Per-TF in-indicator alerts (line crossing / bar closes outside)
• Clean line labels — e.g. "1D High", "4h Low"
• Auto-warning if a non-standard chart (Heikin Ashi, Renko, …) is used
▌ Defaults
TF 1 1D yellow
TF 2 4H aqua
TF 3 15m off
VWAP Session-anchored
Mid white, solid
Band 1 white, dashed, ±1 StDev
Band 2 gray, dashed, ±2 StDev
▌ Quick Start
1. Add to any chart (TF ≤ your highest configured TF)
2. Boxes update automatically when the higher-TF candle closes
3. For alerts: enable toggles in the Alerts section, then add ONE TradingView alert with
Condition: Multi Timeframe Pro
Function: Any alert() function call
Trigger: Once Per Bar Close
▌ Notes
• Pine v5
• Use standard candle charts (a red warning appears in the table otherwise)
• VWAP requires a symbol with volume — disable it for FX if needed Indicador

Multi Timeframe ProMulti Timeframe Pro — HTF Levels + Anchored VWAP
Two indicators in one clean overlay: previous-candle ranges from up to 3 timeframes, plus a fully customizable anchored VWAP with bands.
▌ Features
• Boxes for the LAST CLOSED candle of up to 3 timeframes (High, Low, dashed Mid)
• Anchored VWAP with 2 standard-deviation bands — no background fills
• Live countdown table — see when the next candle of each TF closes
• Per-TF in-indicator alerts (line crossing / bar closes outside)
• Clean line labels — e.g. "1D High", "4h Low"
• Auto-warning if a non-standard chart (Heikin Ashi, Renko, …) is used
▌ Defaults
TF 1 1D yellow
TF 2 4H aqua
TF 3 15m off
VWAP Session-anchored
Mid white, solid
Band 1 white, dashed, ±1 StDev
Band 2 gray, dashed, ±2 StDev
▌ Quick Start
1. Add to any chart (TF ≤ your highest configured TF)
2. Boxes update automatically when the higher-TF candle closes
3. For alerts: enable toggles in the Alerts section, then add ONE TradingView alert with
Condition: Multi Timeframe Pro
Function: Any alert() function call
Trigger: Once Per Bar Close
▌ Notes
• Pine v5
• Use standard candle charts (a red warning appears in the table otherwise)
• VWAP requires a symbol with volume — disable it for FX if needed Indicador

Reverse AVWAP: Institutional Anchor DiscoveryStop guessing your anchors. Let the algorithm find them for you.
Most traders use the Anchored VWAP (AVWAP) the same way: they pick an obvious swing high, swing low, or earnings gap, anchor a line to it, and wait to see if price reacts. But what if we flipped the script? What if we took a significant current price level and mathematically scanned history to find exactly which hidden dates are defending it?
Introducing the Reverse AVWAP.
This indicator acts as an investigative tool for market structure and volume memory. By targeting a specific date or your current real-time chart bar, the script calculates backward, scanning thousands of bars to find the exact historical anchor points where an AVWAP drawn from them converges perfectly with your target price.
How It Works
Instead of projecting forward, this script reverse-engineers the volume profile:
Dynamic Target Selection: Choose to run the calculation from a fixed Target Date or toggle Use Last Chart Bar as Target to dynamically track live, real-time convergence on your current candle.
Historical Matrix Scan: The algorithm searches back in time, calculating the exact AVWAP from every single historical bar up to your target.
Threshold Matching: If a historical AVWAP lands within your custom proximity threshold (e.g., ±2.5% or ±3.5%) of the target price, it flags that date as a valid "Anchor."
Stitched Curve Generation: It draws the historical VWAP curves connecting those hidden anchors directly to your target.
Key Features
Macro First vs. Micro First Scanning: Choose your search direction. Macro First scans from the oldest historical data forward, prioritizing dominant multi-year structural pivots (like All-Time Highs or major cyclical bottoms). Micro First scans from recent data backward, focusing on short-term accumulation zones.
Smart Anti-Clustering: Includes a "Minimum Bars Between Anchors" filter. If the market forms a major rounded peak or flat consolidation, this prevents the script from grabbing 5 consecutive days on the same structure. It forces the algorithm to find distinct, uniquely significant pivot origins.
Up to 15 Historical Curves: Automatically color-codes and plots multiple unique historical AVWAP curves that converge on your target price.
Precision Divergence Labels: Drops clean visual tags on the discovered anchors, showing you exactly how close the historical AVWAP came to your target price down to the decimal percentage.
Under the Hood (Engine Optimizations)
Calculating thousands of historical AVWAPs iteratively would normally trigger a Pine Script timeout or cause massive lag. This indicator utilizes a heavily optimized architecture to bypass TradingView's native limitations:
O(1) Time Math: It uses rolling arrays to track the cumulative sums of Volume and Price × Volume. By subtracting cumulative historical values from current ones, it solves the AVWAP equations instantly in constant time per bar.
Bulletproof Line-Chain Renderer: TradingView’s standard polyline engine frequently suffers from canvas rendering drops when drawing long curves across thousands of bars. This script implements a custom, lightweight rendering engine that segments standard lines into roughly 80 dynamically downsampled links per anchor. The result is a buttery-smooth curve that never fails to render, no matter how far back the anchor sits.
Memory Management: Includes a dedicated garbage-collection routine that wipes and redraws canvas objects on live ticks, keeping your chart clean, responsive, and completely free of visual flickering.
Usage Tips
The History Loading Shortcut: Pine Script can only analyze data that is actively loaded into your browser session. If you are looking for a macro anchor from years ago, use the TradingView "Go to" shortcut (Alt + G on Windows, Option + G on Mac) and enter a past date. This forces the servers to load the historical bars instantly, allowing the script to find the anchor immediately.
Validation: If you see a breakout, run the Reverse AVWAP. If multiple historical volume anchors perfectly align with your current price, you have high-conviction proof of a major institutional volume node. You can then use those newly discovered anchor dates to project standard AVWAPs forward into the future. Indicador
Polaris VWAP Mesh [JOAT]Polaris VWAP Mesh
Polaris VWAP Mesh tracks four anchored VWAPs simultaneously — Session, Swing-High pivot, Swing-Low pivot, and Previous-Day-Open — and detects pairwise confluence whenever two or more of them are within an ATR-scaled proximity of each other. Each VWAP carries a plus-or-minus 1-sigma deviation band. Confluence zones become full-chart-width persistent bands. A multi-anchor bias score counts how many VWAPs price is currently above.
What makes it different
Most VWAP scripts plot a single anchor (session or daily). Polaris simultaneously runs four independent anchored-VWAP engines and surfaces their interactions as confluence zones.
Confluence detection uses an ATR-scaled proximity threshold rather than a fixed percentage, so it adapts to the instrument's volatility automatically.
A multi-anchor bias counter aggregates the four VWAPs into a single 0-to-4 score. Full-chart-width tints apply when three or more VWAPs are above (or below) the close.
Swing-anchored VWAPs reset at confirmed pivot points and start fresh from the moment of pivot confirmation (forward-only, non-repainting). The Previous-Day-Open VWAP is anchored to the open of the prior daily bar so it captures yesterday's reference.
A pairwise distance matrix is displayed in plain text at the right edge — six pair distances, with the two tightest pairs highlighted.
How it works
An anchored VWAP function maintains three cumulators per anchor — price-times-volume, volume, and price-squared-times-volume — to deliver both the VWAP and its rolling standard deviation since the anchor.
Anchor reset conditions: Session start of the user-defined session window. Swing-High on confirmed ta.pivothigh. Swing-Low on confirmed ta.pivotlow. Previous-Day-Open on ta.change(time("D")), capturing the open of the new day, then locking after a day passes.
Pairwise distance check: for each of the six possible pairs, if the absolute distance between VWAPs is less than proximityThreshATR times ATR(14), an active confluence is flagged. The mid-price between the two VWAPs becomes the confluence level.
Multi-anchor bias counts how many of the four VWAPs the close is above.
Reading the chart
Four VWAP lines, each in its own color (session blue, swing-high red, swing-low mint, prev-day-open purple, all user-configurable).
Plus-or-minus 1-sigma deviation band shading per VWAP.
Full-chart-width confluence zones (persistent bordered boxes) at each active confluence level, with right-edge labels naming the contributing pair.
Anchor reset markers: small vertical lines per anchor at the bar of reset (capped at 20 per anchor type).
A multi-anchor bull / bear bgcolor tint (very faint) when three or more VWAPs are on one side of the close.
Iridescent candle recolor by bull-count.
Right-edge VWAP labels with plus-or-minus sigma deviation tags.
Pairwise distance matrix label cluster.
Anchor-age label cluster.
Bias-flip timeline labels and VWAP-cross event labels.
Signals
Bull / bear VWAP cross (any anchor)
Session VWAP bull / bear cross (dedicated alerts)
Previous-Day-Open VWAP bull / bear cross (dedicated alerts)
Confluence touch (price entered an active confluence zone)
Multi-anchor bull / bear bias activation
All gated on barstate.isconfirmed or barstate.ishistory. No future references.
Inputs
Anchors : session window string, swing pivot length.
Bands : standard deviation multiplier, band shading toggle.
Confluence : proximity threshold in ATR units, confluence zones toggle.
Visuals : bullish / bearish colors, per-anchor color overrides, per-anchor visibility toggles, candles, labels.
Dashboard : position, size.
How traders use this
Confluence trading : confluence zones are price magnets. Reactions to them (touches with rejections) are tradable. Clean breaks through with volume can be trend signals.
Multi-anchor bias : when three or four of the four VWAPs are on the same side of price, the trend is well supported across multiple anchors. Counter-trend trades in this regime are lower probability.
VWAP rotation : the previous-day-open VWAP is a frequently respected institutional reference. Crosses of it often coincide with bias shifts.
Plus-or-minus 1-sigma bands : extensions to plus-or-minus 1 sigma from a fast-moving anchor often coincide with short-term mean-reversion zones.
Limitations
Swing-anchored VWAPs begin tracking only after pivot confirmation, so they lack history before that pivot was confirmed. This is by design (non-repainting), not a bug.
The session VWAP requires the user to set a session window matching the instrument's primary trading window.
The pairwise confluence test is O(1) per bar (six pairs). Confluence zones extend across the chart and use persistent box objects. They are capped at six active zones (the maximum number of pair combinations).
Confluence is a price-coincidence test, not a flow-direction test. Use other tools to gauge directional bias once confluence is identified.
Compatibility
Pine Script v6 open-source indicator (overlay). Any symbol with volume data. Designed for sessions in America/New_York by default. Change the session window for other markets. No request.security calls.
Defaults
0930-1600 EST session window, 10-bar pivot length, 0.5x ATR proximity threshold, mint / red brand colors plus blue / red / mint / purple anchor accents, top-right medium dashboard.
Indicador