
Alright—here’s the weekly diesel story, and yeah… it’s got teeth. 😄🌊
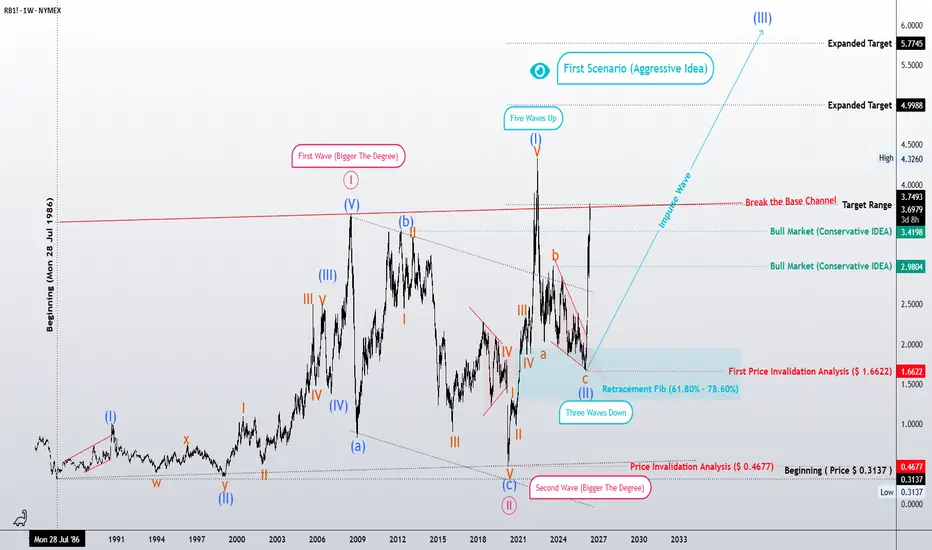
This whole move starts back on July 28, 1986 at about
0.3137
0.3137∗∗.From there, the market build sanearly∗∗5−waveimpulse∗∗,pushing the price to the∗∗
3.6481 area by June 14, 2008—clean, textbook, no questions asked. 🚀
Then the bigger picture gets more serious: we see a higher-degree complex correction, the kind that doesn’t just “pull back”… it resets the structure.
Next, the key invalidation level shows up around $0.4677 (from March 20, 2020)—and real talk? It’s very unlikely we’ll come back to that. That level is basically the market’s “don’t even try it” line. 🚦
After that, the market puts in another motive 5-wave run, climbing to the historic high near $4.3280 on May 31, 2022. And just when you think it’s done flexing… the correction arrives.
The recent pullback was a classic 3-wave zigzag, landing into the $1.6641 zone around January 5, 2026, finishing right inside the 61.8%–78.6% Fibonacci retracement pocket. That’s not luck—that’s structure doing its job. 🎯
Now the current setup? The motive wave in motion is strong, and it’s getting confirmation. This isn’t just a “maybe” move—price is behaving like it’s already passing through deeper corrective territory. The wave count is demanding respect. 🔥
Targets (Arithmetic Chart):
First resistance target at $3.7493 — already broken ✅
Next: $4.9988 (Expanded Target)
Then: $5.7745
And if you’re going for the longer-distance dream targets? Do yourself a favor and use the logarithmic chart—weekly long-term structure tends to make way more sense there. 🧠📈
So yeah… I’m “Mr. Nobody.”
But the market has a language—and the waves are whispering. I’m just listening… one step at a time. 😉🌊
Hey man, just wanted to give you a heads-up! Because of the internet situation here in Iran, I can’t always hop on TradingView. So while I can read all your awesome comments on the charts your friends share, sometimes my replies don’t send out. Just wanted you to know what’s up! 😉
This whole move starts back on July 28, 1986 at about
0.3137
0.3137∗∗.From there, the market build sanearly∗∗5−waveimpulse∗∗,pushing the price to the∗∗
3.6481 area by June 14, 2008—clean, textbook, no questions asked. 🚀
Then the bigger picture gets more serious: we see a higher-degree complex correction, the kind that doesn’t just “pull back”… it resets the structure.
Next, the key invalidation level shows up around $0.4677 (from March 20, 2020)—and real talk? It’s very unlikely we’ll come back to that. That level is basically the market’s “don’t even try it” line. 🚦
After that, the market puts in another motive 5-wave run, climbing to the historic high near $4.3280 on May 31, 2022. And just when you think it’s done flexing… the correction arrives.
The recent pullback was a classic 3-wave zigzag, landing into the $1.6641 zone around January 5, 2026, finishing right inside the 61.8%–78.6% Fibonacci retracement pocket. That’s not luck—that’s structure doing its job. 🎯
Now the current setup? The motive wave in motion is strong, and it’s getting confirmation. This isn’t just a “maybe” move—price is behaving like it’s already passing through deeper corrective territory. The wave count is demanding respect. 🔥
Targets (Arithmetic Chart):
First resistance target at $3.7493 — already broken ✅
Next: $4.9988 (Expanded Target)
Then: $5.7745
And if you’re going for the longer-distance dream targets? Do yourself a favor and use the logarithmic chart—weekly long-term structure tends to make way more sense there. 🧠📈
So yeah… I’m “Mr. Nobody.”
But the market has a language—and the waves are whispering. I’m just listening… one step at a time. 😉🌊
Hey man, just wanted to give you a heads-up! Because of the internet situation here in Iran, I can’t always hop on TradingView. So while I can read all your awesome comments on the charts your friends share, sometimes my replies don’t send out. Just wanted you to know what’s up! 😉

Publications connexes
Clause de non-responsabilité
Les informations et publications ne sont pas destinées à être, et ne constituent pas, des conseils ou recommandations financiers, d'investissement, de trading ou autres fournis ou approuvés par TradingView. Pour en savoir plus, consultez les Conditions d'utilisation.
Publications connexes
Clause de non-responsabilité
Les informations et publications ne sont pas destinées à être, et ne constituent pas, des conseils ou recommandations financiers, d'investissement, de trading ou autres fournis ou approuvés par TradingView. Pour en savoir plus, consultez les Conditions d'utilisation.