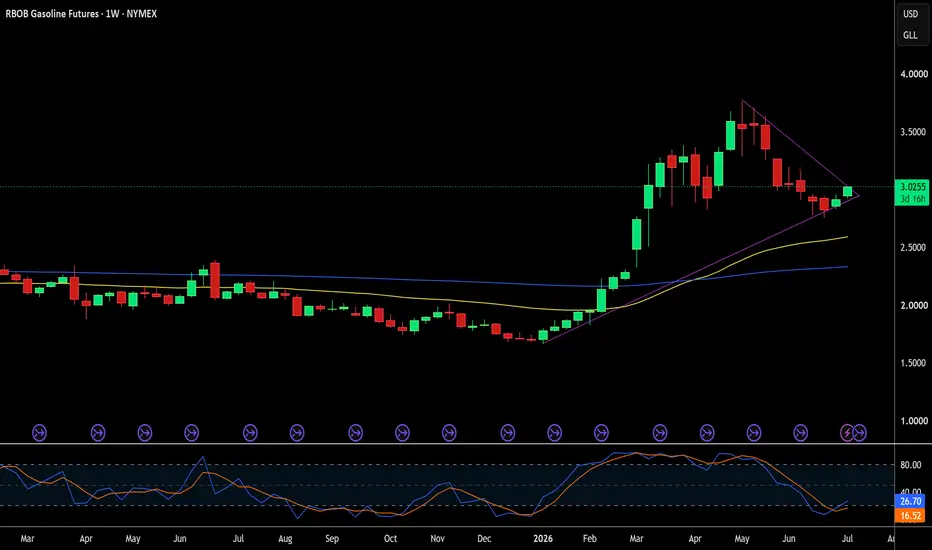
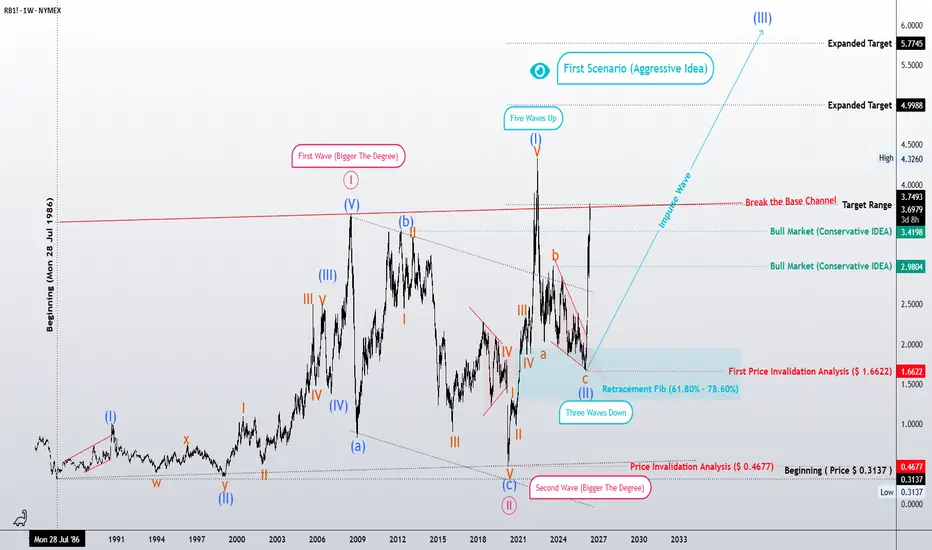
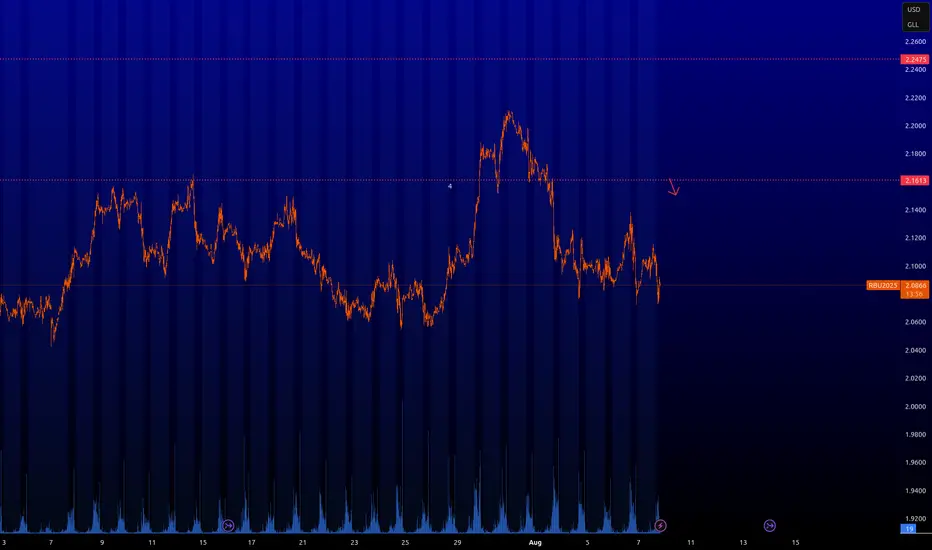
Weekly Chart – Elliott Wave Analysis | Final Supercycle Advance?RBOB Gasoline (RB1!) Weekly Chart – Elliott Wave Analysis | Final Supercycle Advance?
As one of crude oil's primary refined products, RBOB Gasoline has historically maintained a strong structural relationship with the broader oil market. Although its long-term historical data is less complete than
RBOB Gasoline Futures
No trades
No trades
Compare with Gasoline
Crack spread and crude oil priceHistorically, we have seen crack spreads drop without a recession in two specific ways:
The "Supply Shock" Reversal: If geopolitical bottlenecks ease—such as a resolution to the Strait of Hormuz tensions that heavily impacted 2026 energy markets—or if sanctioned Russian/Iranian products flow more e
Can RBOB Gasoline Futures Predict the Next Recession?RBOB gasoline futures serve as a critical economic pulse. Refiners, traders, and policymakers watch this CME Group benchmark closely. Sudden price shifts reverberate across the global financial system.
The Macroeconomic Illusion of Cheap Fuel
Falling pump prices often signal financial relief for
DINO carrying temporary idiosyncratic discountmarket temporarily treated DINO as:
a company-specific risk story,
not:
a pure refining-margin proxy.
So even though:
diesel strong,
crack spreads strong,
refining macro supportive,
DINO had:
refinery fire concerns,
CEO departure,
CFO uncertainty,
governance overhang.
sector economics are s
Betrakon: Weekly Diesel Elliott Wave BreakdownAlright—here’s the weekly diesel story, and yeah… it’s got teeth. 😄🌊
This whole move starts back on July 28, 1986 at about
0.3137
0.3137∗∗.From there, the market build sanearly∗∗5−waveimpulse∗∗,pushing the price to the∗∗
3.6481 area by June 14, 2008—clean, textbook, no questions asked. 🚀
Then th
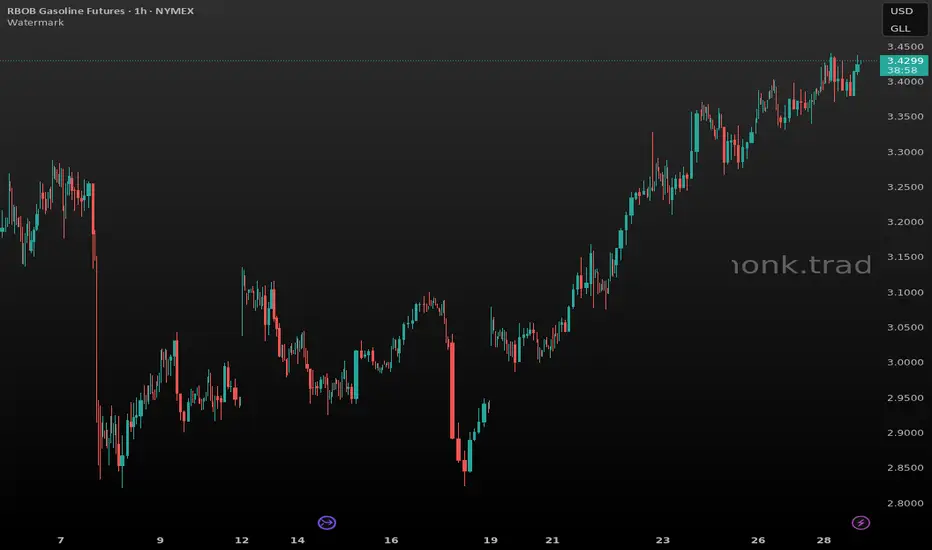
RB Long — $RBM26 pullback into breakout shelf as energy complex Setup: HTF (4h) shows a powerful impulsive leg from the ~2.80 April lows through 3.40+, making higher highs and higher lows — clear uptrend. The April 28 session opened with a spike to 3.44 then pulled back intraday to the 3.37-3.38 zone, which aligns with the prior day's consolidation shelf and the
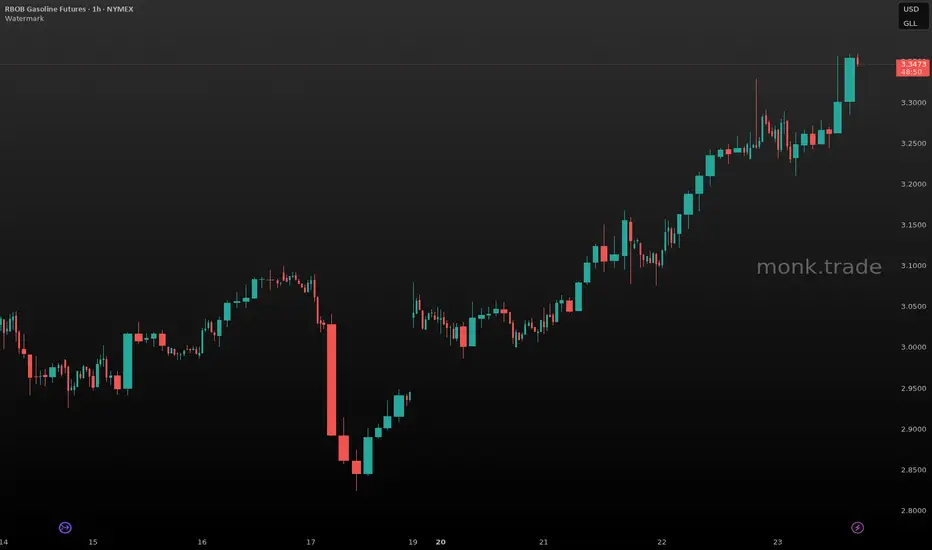
RB Long — RB breaking out to new multi-week highs on energy-specSetup: On the 4h, RB has been in a clear uptrend since the Apr 17 spike low near 2.84, printing higher lows and higher highs through the 3.00, 3.10, and 3.20 levels. The 1h shows an impulsive leg launching from the 3.10 consolidation zone on Apr 22, with successive breakout candles through 3.20, 3.2
GASOLINE targeting its 1W MA100. Buy.Gasoline (RB1!) has been trading within a 3-year Channel Down and is currently on the latest Bullish Leg that is about to test the 1W MA50 (blue trend-line). All previous Bullish Legs have hit at least the 0.618 Fibonacci retracement level and the 1W MA100 (green trend-line) at the same time.
As a
downtrend might be continuing : tight entry opportunity1->3 : number 2 proven sellers
3->4 : return to proven sellers
next ?
*downtrend continuation idea
* rsi 2nd degree h.divergence
*mfi 3rd degree h.divergence
* obv BB band upper 2nd standard
deviation predicting selling interest
*1st standard dev. vwap auto anchord on local high
See all ideas
Summarizing what the indicators are suggesting.
Neutral
SellBuy
Strong sellStrong buy
Strong sellSellNeutralBuyStrong buy
Neutral
SellBuy
Strong sellStrong buy
Strong sellSellNeutralBuyStrong buy
Neutral
SellBuy
Strong sellStrong buy
Strong sellSellNeutralBuyStrong buy
A representation of what an asset is worth today and what the market thinks it will be worth in the future.
Displays a symbol's price movements over previous years to identify recurring trends.
Frequently asked questions
The current price of RBOB Gasoline Futures is 3.2241 USD / GLL — it has fallen −0.71% in the past 24 hours. Watch RBOB Gasoline Futures price in more detail on the chart.
The volume of RBOB Gasoline Futures is 11.49 K. Track more important stats on the RBOB Gasoline Futures chart.
Open interest is the number of contracts held by traders in active positions — they're not closed or expired. For RBOB Gasoline Futures this number is 98.34 K. You can use it to track a prevailing market trend and adjust your own strategy: declining open interest for RBOB Gasoline Futures shows that traders are closing their positions, which means a weakening trend.
Buying or selling futures contracts depends on many factors: season, underlying commodity, your own trading strategy. So mostly it's up to you, but if you look for some certain calculations to take into account, you can study technical analysis for RBOB Gasoline Futures. Today its technical rating is strong buy, but remember that market conditions change all the time, so it's always crucial to do your own research. See more of RBOB Gasoline Futures technicals for a more comprehensive analysis.