
1. The Macro Perspective: The Brutal Washout and The Cup
I am taking a LONG bias on Rishabh Instruments Limited (RISHABH) on the weekly (1W) timeframe.
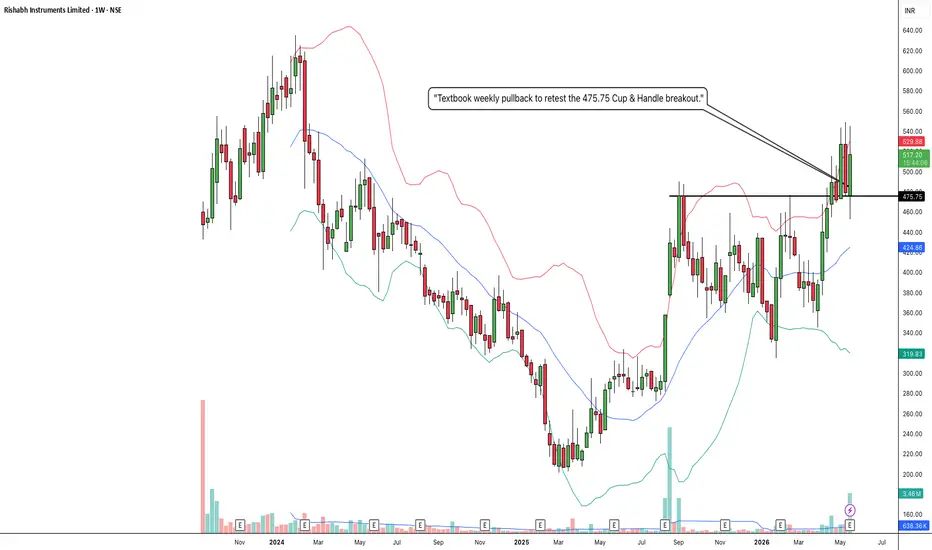
When analyzing pure market structure, the most lucrative macro trends are born from deep, exhausting accumulation phases. Look at the massive structural development spanning this chart. Following a steep and agonizing markdown phase throughout 2024, the stock crashed down into the 200-220 zone. This brutal correction successfully washed out weak hands and forced mass retail capitulation. However, instead of bleeding into a permanent downtrend, heavy institutional capital stepped in to establish a concrete floor. Over the last year, the stock has quietly carved out an enormous "Cup" (Rounding Bottom) accumulation phase, systematically marching right back up the right side of the chart to challenge historical supply.
2. The Educational Setup: The Neckline and The Handle
To understand the sheer technical validity of this current setup, look at how the price systematically transitioned from accumulation back into a markup phase:
The Concrete Ceiling: The stock's recovery was heavily capped by a formidable horizontal resistance line at 475.75. Sellers repeatedly defended this zone, swatting the price down and creating a clear macro neckline.
The Squeeze: Notice how the price behaved right below this ceiling. Instead of suffering a massive double-top rejection, institutional buyers aggressively defended the structure, chopping sideways to form a textbook "Handle." This high-level consolidation gracefully transferred shares from impatient retail traders to strong-handed institutional buyers, allowing the 20 SMA (the middle blue line of your Bollinger Bands) to catch up and act as a dynamic springboard.
3. Current Price Action: The Ultimate Confirmation
Look at the right side of the chart. That pressure cooker finally exploded, shattering the 475.75 ceiling with massive green momentum expansion candles. But in technical analysis, a breakout is only half the battle. The most lucrative entries occur when a stock proves it can defend its newly claimed territory. Look at the current weekly candles on the far right. After an explosive vertical run into the 530s, the stock is taking a healthy, necessary breather. To amateur traders, these red candles look like a failed rally. To structural traders, this is a textbook "Break and Retest." The stock has pulled back to perfectly test the 475.75 line from above. By holding its ground here, that old, heavy historical resistance is officially being flipped into a brand-new, indestructible structural launchpad.
4. The Trade Plan: Entries, Targets, and Risk Management
Entry Strategy: We are currently sitting right in the "golden entry" digestion zone. Chasing massive vertical green candles is dangerous, which is exactly why we wait for pullbacks like this. The highest-probability, lowest-risk entry involves stepping down to a daily timeframe and looking for bullish reversal confirmation as it bounces off the 470.00 to 490.00 zone. Letting that heavy historical resistance prove itself as a new support floor offers a phenomenal risk-to-reward ratio.
Take Profit (Targets): We use measured structural targets based on the depth of the macro base. By taking the depth of the massive Cup (roughly 260 points from the ~215 floor up to the 475.75 ceiling) and projecting it upward from the breakout line, our primary structural macro target sits comfortably in the 730.00 to 740.00 zone over the coming months.
Invalidation (Stop Loss): A break-and-retest thesis is only valid if the new floor holds. A hard stop loss should be placed safely below the 475.75 breakout line and the rising 20 SMA, around the 410.00 to 425.00 level. A definitive weekly close completely back inside the old accumulation base and breaking below the moving average would act as a massive warning sign of a failed macro breakout and a severe bull trap.
5. Time Horizon:
Because this technical setup is built on a 1-Week chart capturing a massive structural phase transition and a textbook macro retest, this is a medium-to-longer-term position trade designed to capture a secular markup phase. Let the macro trend run!
I am taking a LONG bias on Rishabh Instruments Limited (RISHABH) on the weekly (1W) timeframe.
When analyzing pure market structure, the most lucrative macro trends are born from deep, exhausting accumulation phases. Look at the massive structural development spanning this chart. Following a steep and agonizing markdown phase throughout 2024, the stock crashed down into the 200-220 zone. This brutal correction successfully washed out weak hands and forced mass retail capitulation. However, instead of bleeding into a permanent downtrend, heavy institutional capital stepped in to establish a concrete floor. Over the last year, the stock has quietly carved out an enormous "Cup" (Rounding Bottom) accumulation phase, systematically marching right back up the right side of the chart to challenge historical supply.
2. The Educational Setup: The Neckline and The Handle
To understand the sheer technical validity of this current setup, look at how the price systematically transitioned from accumulation back into a markup phase:
The Concrete Ceiling: The stock's recovery was heavily capped by a formidable horizontal resistance line at 475.75. Sellers repeatedly defended this zone, swatting the price down and creating a clear macro neckline.
The Squeeze: Notice how the price behaved right below this ceiling. Instead of suffering a massive double-top rejection, institutional buyers aggressively defended the structure, chopping sideways to form a textbook "Handle." This high-level consolidation gracefully transferred shares from impatient retail traders to strong-handed institutional buyers, allowing the 20 SMA (the middle blue line of your Bollinger Bands) to catch up and act as a dynamic springboard.
3. Current Price Action: The Ultimate Confirmation
Look at the right side of the chart. That pressure cooker finally exploded, shattering the 475.75 ceiling with massive green momentum expansion candles. But in technical analysis, a breakout is only half the battle. The most lucrative entries occur when a stock proves it can defend its newly claimed territory. Look at the current weekly candles on the far right. After an explosive vertical run into the 530s, the stock is taking a healthy, necessary breather. To amateur traders, these red candles look like a failed rally. To structural traders, this is a textbook "Break and Retest." The stock has pulled back to perfectly test the 475.75 line from above. By holding its ground here, that old, heavy historical resistance is officially being flipped into a brand-new, indestructible structural launchpad.
4. The Trade Plan: Entries, Targets, and Risk Management
Entry Strategy: We are currently sitting right in the "golden entry" digestion zone. Chasing massive vertical green candles is dangerous, which is exactly why we wait for pullbacks like this. The highest-probability, lowest-risk entry involves stepping down to a daily timeframe and looking for bullish reversal confirmation as it bounces off the 470.00 to 490.00 zone. Letting that heavy historical resistance prove itself as a new support floor offers a phenomenal risk-to-reward ratio.
Take Profit (Targets): We use measured structural targets based on the depth of the macro base. By taking the depth of the massive Cup (roughly 260 points from the ~215 floor up to the 475.75 ceiling) and projecting it upward from the breakout line, our primary structural macro target sits comfortably in the 730.00 to 740.00 zone over the coming months.
Invalidation (Stop Loss): A break-and-retest thesis is only valid if the new floor holds. A hard stop loss should be placed safely below the 475.75 breakout line and the rising 20 SMA, around the 410.00 to 425.00 level. A definitive weekly close completely back inside the old accumulation base and breaking below the moving average would act as a massive warning sign of a failed macro breakout and a severe bull trap.
5. Time Horizon:
Because this technical setup is built on a 1-Week chart capturing a massive structural phase transition and a textbook macro retest, this is a medium-to-longer-term position trade designed to capture a secular markup phase. Let the macro trend run!
Trade fermée: cible de profit atteinte
Target already achieved.
Clause de non-responsabilité
Les informations et publications ne sont pas destinées à être, et ne constituent pas, des conseils ou recommandations financiers, d'investissement, de trading ou autres fournis ou approuvés par TradingView. Pour en savoir plus, consultez les Conditions d'utilisation.
Clause de non-responsabilité
Les informations et publications ne sont pas destinées à être, et ne constituent pas, des conseils ou recommandations financiers, d'investissement, de trading ou autres fournis ou approuvés par TradingView. Pour en savoir plus, consultez les Conditions d'utilisation.