
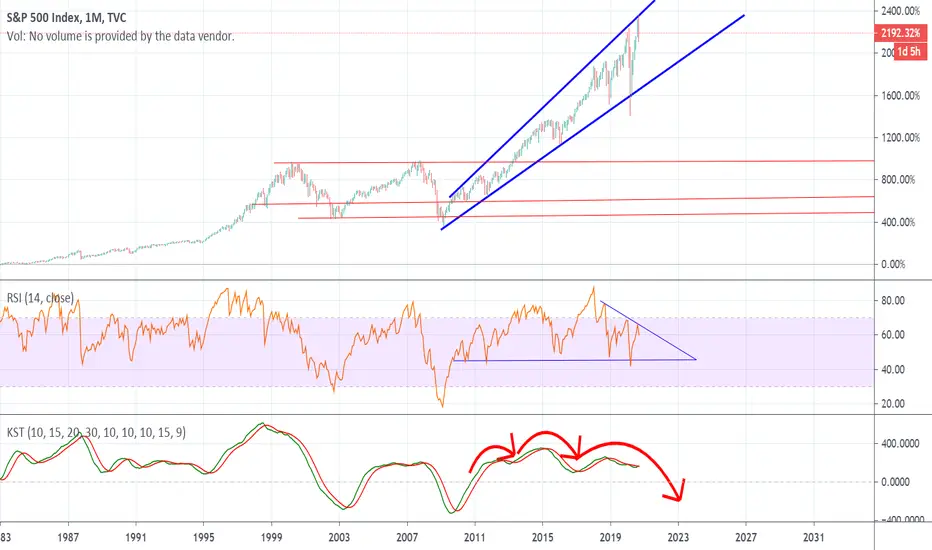
The S&P 500 is forming a rising channel or ascending channel marked by two blue parallel uptrend lines.
Most stocks typically continue to channel until either trend line is broken.
An upside break is a signal that buying intensity has increased, while a downside break indicates an end to the short-term uptrend.
On the RSI there's a noticeable divergence, the blue downward sloping line of resistance will need to be purged to the upside before the pattern finishes or there's likely going to be a heinous correction if the pattern finishes bearishly.
The KST is trying to cross bullishly over the red line but has been rejected multiple times upon close observation, I've outlined a possible H&S pattern that will occur unless we see a bullish cross on the KST.
Most stocks typically continue to channel until either trend line is broken.
An upside break is a signal that buying intensity has increased, while a downside break indicates an end to the short-term uptrend.
On the RSI there's a noticeable divergence, the blue downward sloping line of resistance will need to be purged to the upside before the pattern finishes or there's likely going to be a heinous correction if the pattern finishes bearishly.
The KST is trying to cross bullishly over the red line but has been rejected multiple times upon close observation, I've outlined a possible H&S pattern that will occur unless we see a bullish cross on the KST.

Clause de non-responsabilité
Les informations et publications ne sont pas destinées à être, et ne constituent pas, des conseils ou recommandations financiers, d'investissement, de trading ou autres fournis ou approuvés par TradingView. Pour en savoir plus, consultez les Conditions d'utilisation.
Clause de non-responsabilité
Les informations et publications ne sont pas destinées à être, et ne constituent pas, des conseils ou recommandations financiers, d'investissement, de trading ou autres fournis ou approuvés par TradingView. Pour en savoir plus, consultez les Conditions d'utilisation.