
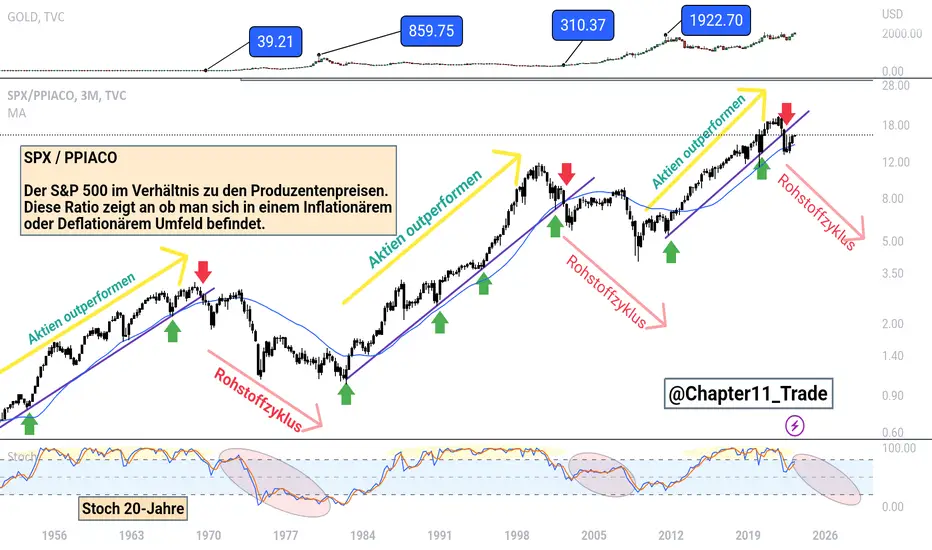
SPX / PPIACO
Das Aktien-zu-Rohstoff-Verhältnis misst den S&P 500 relativ zum Rohstoffmarktindex PPI (Erzeugerpreisindex). Wenn das Verhältnis steigt, schlagen Aktien die Rohstoffrenditen – und wenn es fällt, schlagen Rohstoffe die Aktienrenditen. Die y-Achse des Charts ist logarithmisch und langfristig schneiden Aktien deutlich besser ab als Rohstoffe.
Das Aktien-zu-Rohstoff-Verhältnis misst den S&P 500 relativ zum Rohstoffmarktindex PPI (Erzeugerpreisindex). Wenn das Verhältnis steigt, schlagen Aktien die Rohstoffrenditen – und wenn es fällt, schlagen Rohstoffe die Aktienrenditen. Die y-Achse des Charts ist logarithmisch und langfristig schneiden Aktien deutlich besser ab als Rohstoffe.

Clause de non-responsabilité
Les informations et publications ne sont pas destinées à être, et ne constituent pas, des conseils ou recommandations financiers, d'investissement, de trading ou autres fournis ou approuvés par TradingView. Pour en savoir plus, consultez les Conditions d'utilisation.
Clause de non-responsabilité
Les informations et publications ne sont pas destinées à être, et ne constituent pas, des conseils ou recommandations financiers, d'investissement, de trading ou autres fournis ou approuvés par TradingView. Pour en savoir plus, consultez les Conditions d'utilisation.