
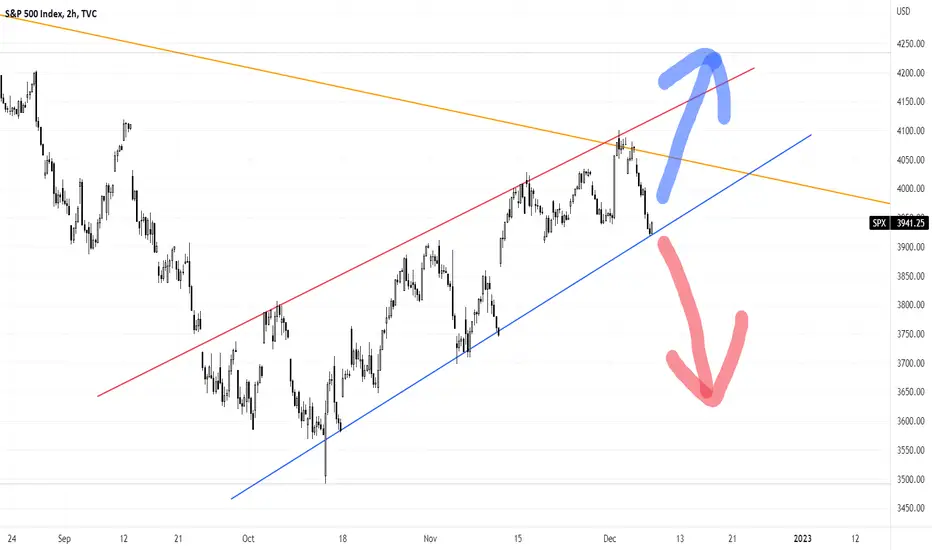
S&P 500 (2H chart) @ 6 December 2022
Drilling down to the more granular 2-hour chart, it's clear that the S&P 500 is at another make-or-break situation...
- Index is testing the strong support (blue line)
- Index previously rejected two strong resistances:- (i) mid-term trendline (red line) and (ii) long-term counter-trendline (orange line)
Drilling down to the more granular 2-hour chart, it's clear that the S&P 500 is at another make-or-break situation...
- Index is testing the strong support (blue line)
- Index previously rejected two strong resistances:- (i) mid-term trendline (red line) and (ii) long-term counter-trendline (orange line)

Publications connexes
Clause de non-responsabilité
Les informations et publications ne sont pas destinées à être, et ne constituent pas, des conseils ou recommandations financiers, d'investissement, de trading ou autres fournis ou approuvés par TradingView. Pour en savoir plus, consultez les Conditions d'utilisation.
Publications connexes
Clause de non-responsabilité
Les informations et publications ne sont pas destinées à être, et ne constituent pas, des conseils ou recommandations financiers, d'investissement, de trading ou autres fournis ou approuvés par TradingView. Pour en savoir plus, consultez les Conditions d'utilisation.