
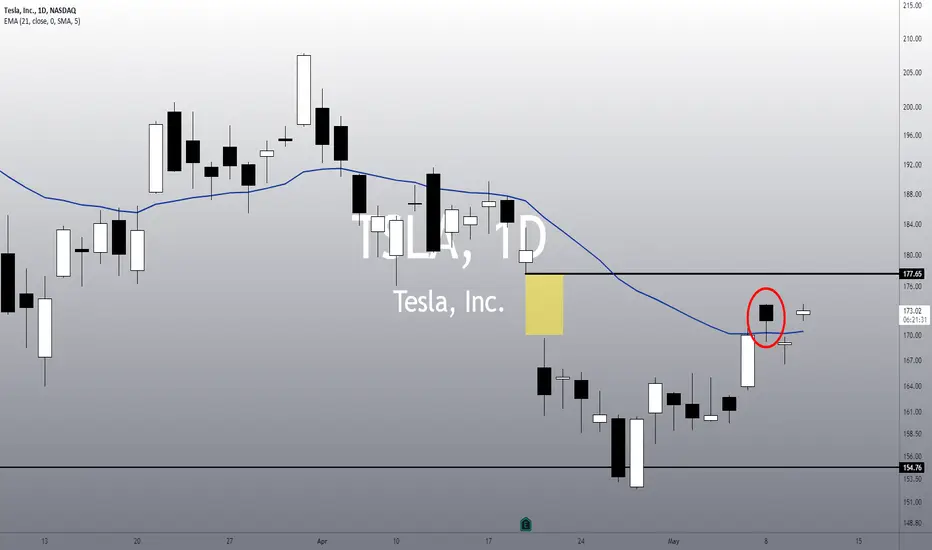
• TSLA stock looks impressive, as it is doing an important reaction today, trying to reject the Hanging Man candlestick pattern from Monday;
• In theory a Hanging Man pattern is a famous top signal, however, evidence suggests that this pattern acts as a bullish continuation roughly 59% of the time (BULKOWSKI, Thomas. Encyclopedia of Candlestick Patterns, p. 365);
• Now, TSLA is trying to resume the bullish momentum. To reject any possible top signal, it is important to see it breaking Monday’s high as soon as possible - otherwise, it might lose momentum;
• What’s more, it seems it is heading to its next technical target, the open gap at $177.

• The weekly chart suggests a bounce to higher levels, maybe to the purple trend line again;
• This thesis will be valid as long as the daily chart maintains its bullish bias, and keeps above its 21 ema;
I’ll keep you updated on this. Remember to follow me to keep in touch with my daily analysis.
• In theory a Hanging Man pattern is a famous top signal, however, evidence suggests that this pattern acts as a bullish continuation roughly 59% of the time (BULKOWSKI, Thomas. Encyclopedia of Candlestick Patterns, p. 365);
• Now, TSLA is trying to resume the bullish momentum. To reject any possible top signal, it is important to see it breaking Monday’s high as soon as possible - otherwise, it might lose momentum;
• What’s more, it seems it is heading to its next technical target, the open gap at $177.
• The weekly chart suggests a bounce to higher levels, maybe to the purple trend line again;
• This thesis will be valid as long as the daily chart maintains its bullish bias, and keeps above its 21 ema;
I’ll keep you updated on this. Remember to follow me to keep in touch with my daily analysis.

Clause de non-responsabilité
Les informations et publications ne sont pas destinées à être, et ne constituent pas, des conseils ou recommandations financiers, d'investissement, de trading ou autres fournis ou approuvés par TradingView. Pour en savoir plus, consultez les Conditions d'utilisation.
Clause de non-responsabilité
Les informations et publications ne sont pas destinées à être, et ne constituent pas, des conseils ou recommandations financiers, d'investissement, de trading ou autres fournis ou approuvés par TradingView. Pour en savoir plus, consultez les Conditions d'utilisation.