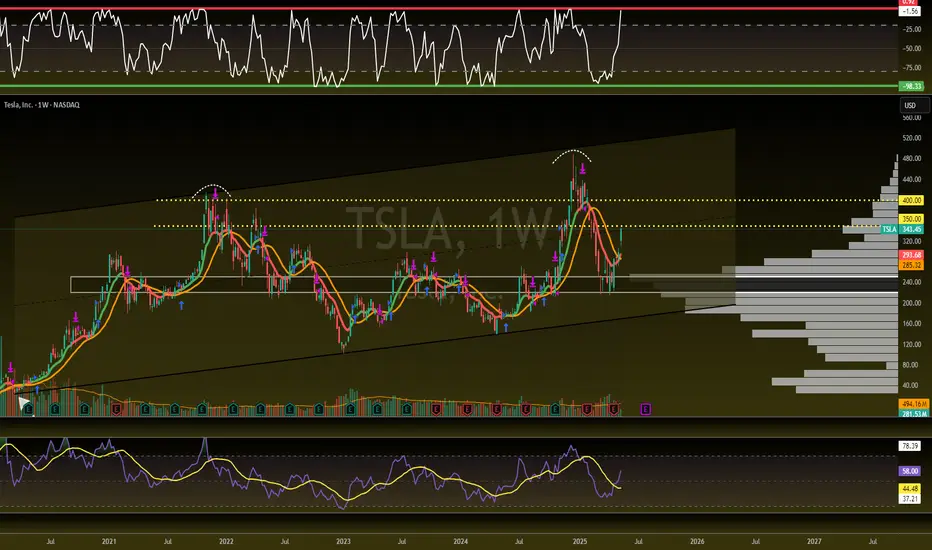
🚀  TSLA Weekly Chart Analysis
🔹 Strong Momentum: Launching off the volume shelf and cruising with the market’s bullish energy.
🔹 Room to Run: Approaching the red barrier, but not there yet—still has upside before a pullback.
🔹 Healthy RSI: Sitting at 56.60, meaning plenty of room for further gains.
🔹 Catalyst Ahead: Robotaxi event incoming! (Sell the news? You bought the rumor. 🤔)
🔹 Key Resistance: Watch levels at $350–$400.
Stay sharp—let’s see if TSLA keeps charging forward! ⚡📈
TSLA Weekly Chart Analysis 🔹 Strong Momentum: Launching off the volume shelf and cruising with the market’s bullish energy.
🔹 Room to Run: Approaching the red barrier, but not there yet—still has upside before a pullback.
🔹 Healthy RSI: Sitting at 56.60, meaning plenty of room for further gains.
🔹 Catalyst Ahead: Robotaxi event incoming! (Sell the news? You bought the rumor. 🤔)
🔹 Key Resistance: Watch levels at $350–$400.
Stay sharp—let’s see if TSLA keeps charging forward! ⚡📈

📈 Momentum Trader | Growth Investor
⚡ Trading A+ Matrix Setups
⏲️ 10+ Years of Experience
👇 Join the High Five Trading Collective
whop.com/highfivecollective
⚡ Trading A+ Matrix Setups
⏲️ 10+ Years of Experience
👇 Join the High Five Trading Collective
whop.com/highfivecollective
Clause de non-responsabilité
Les informations et publications ne sont pas destinées à être, et ne constituent pas, des conseils ou recommandations financiers, d'investissement, de trading ou autres fournis ou approuvés par TradingView. Pour en savoir plus, consultez les Conditions d'utilisation.
📈 Momentum Trader | Growth Investor
⚡ Trading A+ Matrix Setups
⏲️ 10+ Years of Experience
👇 Join the High Five Trading Collective
whop.com/highfivecollective
⚡ Trading A+ Matrix Setups
⏲️ 10+ Years of Experience
👇 Join the High Five Trading Collective
whop.com/highfivecollective
Clause de non-responsabilité
Les informations et publications ne sont pas destinées à être, et ne constituent pas, des conseils ou recommandations financiers, d'investissement, de trading ou autres fournis ou approuvés par TradingView. Pour en savoir plus, consultez les Conditions d'utilisation.