
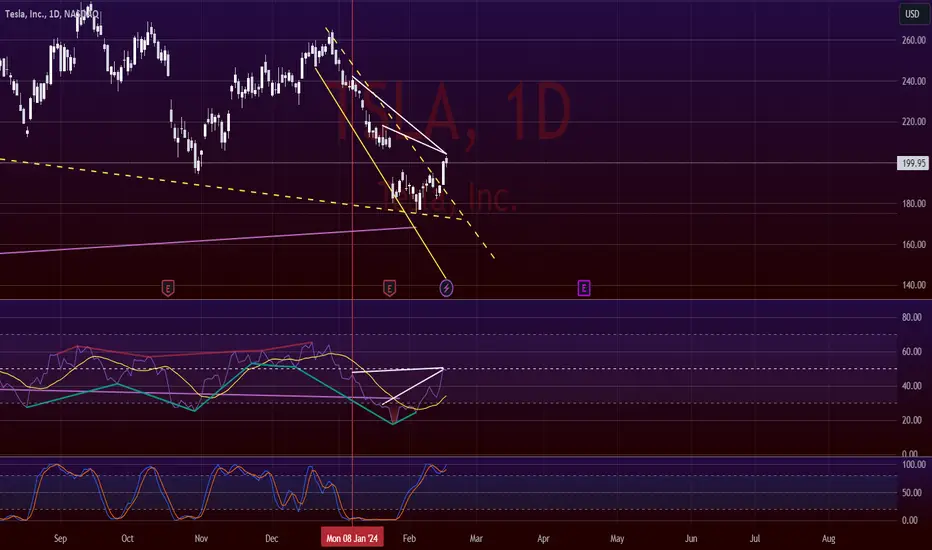
Looks like the RSI suggesting us that TSLA stock will go down to 140-150$ in upcoming week. Daily chart has bearish hidden divergence, also overbought on Stochastic RSI.
If we go down without breaking and holding 211$ the price will be rejected from 200EMA and that would be very bearish signs for Tesla.
Weekly chart looks better suggesting we will go back up fast and there shouldn't be much downside left. Putting my buy orders between 100$ to 155$
If we go down without breaking and holding 211$ the price will be rejected from 200EMA and that would be very bearish signs for Tesla.
Weekly chart looks better suggesting we will go back up fast and there shouldn't be much downside left. Putting my buy orders between 100$ to 155$

Clause de non-responsabilité
Les informations et publications ne sont pas destinées à être, et ne constituent pas, des conseils ou recommandations financiers, d'investissement, de trading ou autres fournis ou approuvés par TradingView. Pour en savoir plus, consultez les Conditions d'utilisation.
Clause de non-responsabilité
Les informations et publications ne sont pas destinées à être, et ne constituent pas, des conseils ou recommandations financiers, d'investissement, de trading ou autres fournis ou approuvés par TradingView. Pour en savoir plus, consultez les Conditions d'utilisation.