
Market Structure
• Medium-term trend remains bullish
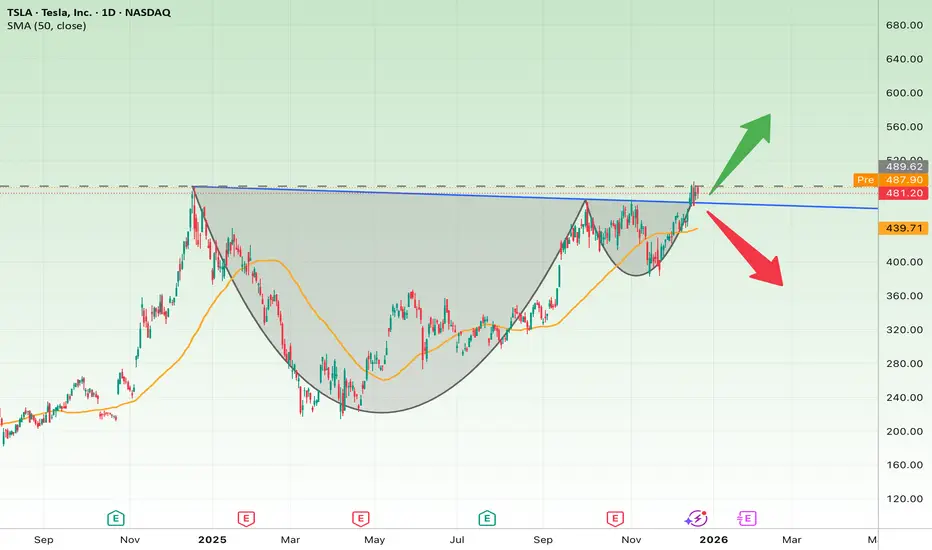
• Price is holding above the 50-day SMA (~$440) → trend is still valid
• TSLA is testing a major horizontal + dynamic resistance zone (480–490)
Key Pattern
• A clear Cup & Handle formation
• The rim of the cup aligns with current resistance
Bullish Scenario (Primary)
If TSLA:
• Breaks and holds above $490
• Confirms breakout with volume
Targets:
• 🎯 Target 1: $520–540
• 🎯 Target 2: $580–600
• Confirms continuation of the larger uptrend
Bearish / Pullback Scenario
If:
• Price gets rejected from the resistance zone
Key Supports:
• First support: $440–445 (50 SMA)
• Major support: $400–410
• Breakdown below → deeper correction toward ~$360 possible
Conclusion
• TSLA is at a critical decision level
• Breakout favors bulls
• Rejection leads to a healthy pullback within an uptrend

Clause de non-responsabilité
Les informations et publications ne sont pas destinées à être, et ne constituent pas, des conseils ou recommandations financiers, d'investissement, de trading ou autres fournis ou approuvés par TradingView. Pour en savoir plus, consultez les Conditions d'utilisation.
Clause de non-responsabilité
Les informations et publications ne sont pas destinées à être, et ne constituent pas, des conseils ou recommandations financiers, d'investissement, de trading ou autres fournis ou approuvés par TradingView. Pour en savoir plus, consultez les Conditions d'utilisation.