
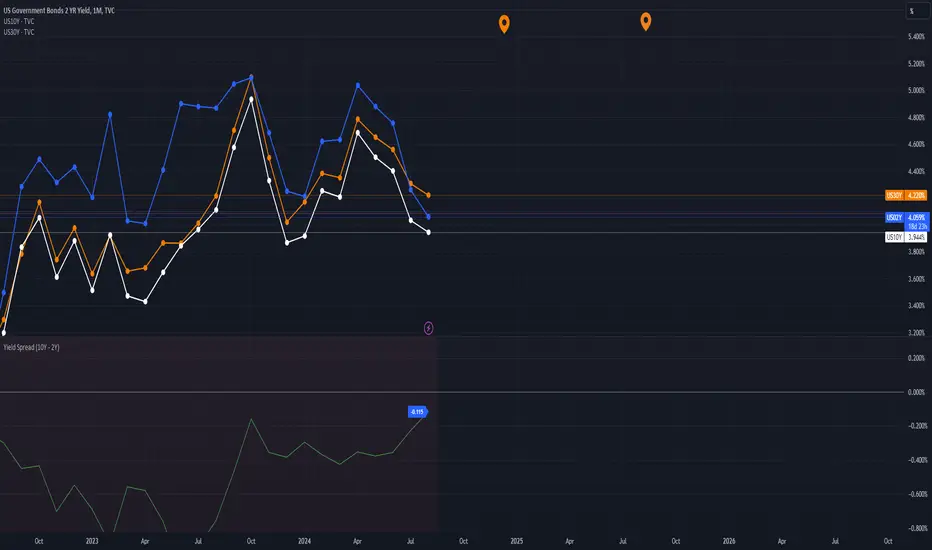
This chart tracks U.S. Treasury yields for 2-year (blue), 10-year (white), and 30-year (orange) bonds, along with the yield spread (green) between the 10-year and 2-year bonds. A positive spread suggests a normal yield curve and economic growth, while a negative spread (inversion) often signals a potential recession.

Clause de non-responsabilité
Les informations et publications ne sont pas destinées à être, et ne constituent pas, des conseils ou recommandations financiers, d'investissement, de trading ou autres fournis ou approuvés par TradingView. Pour en savoir plus, consultez les Conditions d'utilisation.
Clause de non-responsabilité
Les informations et publications ne sont pas destinées à être, et ne constituent pas, des conseils ou recommandations financiers, d'investissement, de trading ou autres fournis ou approuvés par TradingView. Pour en savoir plus, consultez les Conditions d'utilisation.