
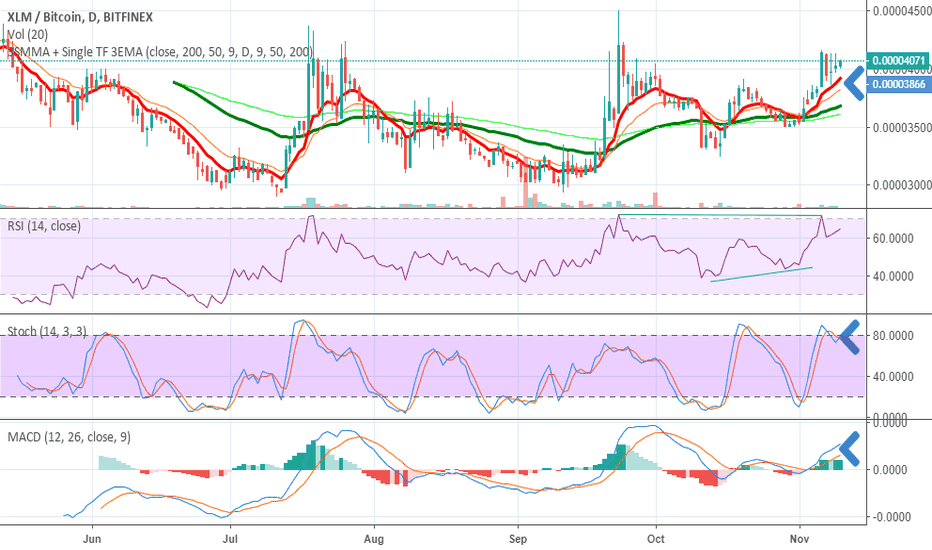
Yesterday after this post:
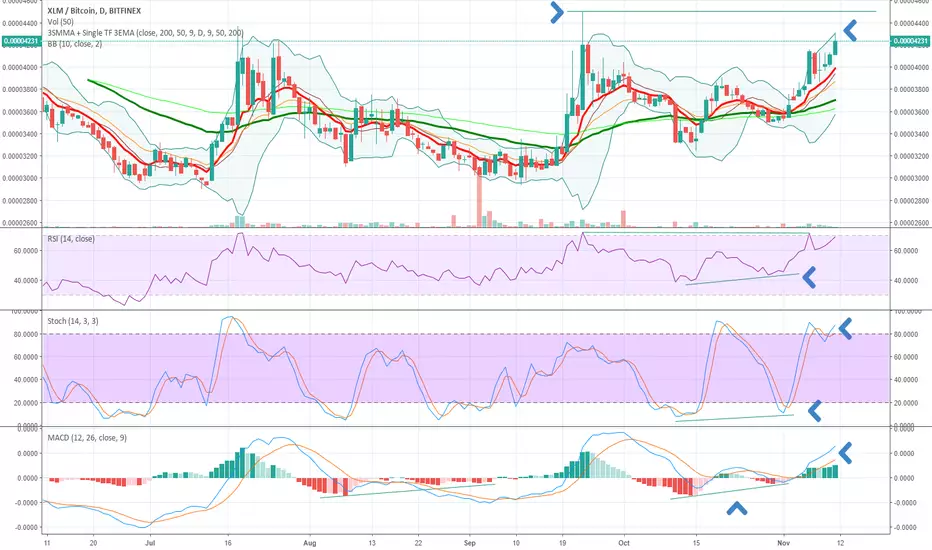
The price of XLM increases abit
From 0.00004071 (at the time of the post), to 0.00004231 (now)
Reasons to hodl?:
1. Stochastic still K>>D
2. Bullish divergence at all indicators as shown (RSI, stochastic, MACD)
When to sell? (when it does not reach last highest price):
1. Not being able to get through the last highest price (around 0.000045) and goes back
2. And then from the RSI / Stochastic / MACD it shows bearish divergence
3. And the stochastic indicator reversed (i.e. K<D)
And if it breaks 0.000045 we will have to analyse again.
The price of XLM increases abit
From 0.00004071 (at the time of the post), to 0.00004231 (now)
Reasons to hodl?:
1. Stochastic still K>>D
2. Bullish divergence at all indicators as shown (RSI, stochastic, MACD)
When to sell? (when it does not reach last highest price):
1. Not being able to get through the last highest price (around 0.000045) and goes back
2. And then from the RSI / Stochastic / MACD it shows bearish divergence
3. And the stochastic indicator reversed (i.e. K<D)
And if it breaks 0.000045 we will have to analyse again.

Publications connexes
Clause de non-responsabilité
Les informations et publications ne sont pas destinées à être, et ne constituent pas, des conseils ou recommandations financiers, d'investissement, de trading ou autres fournis ou approuvés par TradingView. Pour en savoir plus, consultez les Conditions d'utilisation.
Publications connexes
Clause de non-responsabilité
Les informations et publications ne sont pas destinées à être, et ne constituent pas, des conseils ou recommandations financiers, d'investissement, de trading ou autres fournis ou approuvés par TradingView. Pour en savoir plus, consultez les Conditions d'utilisation.