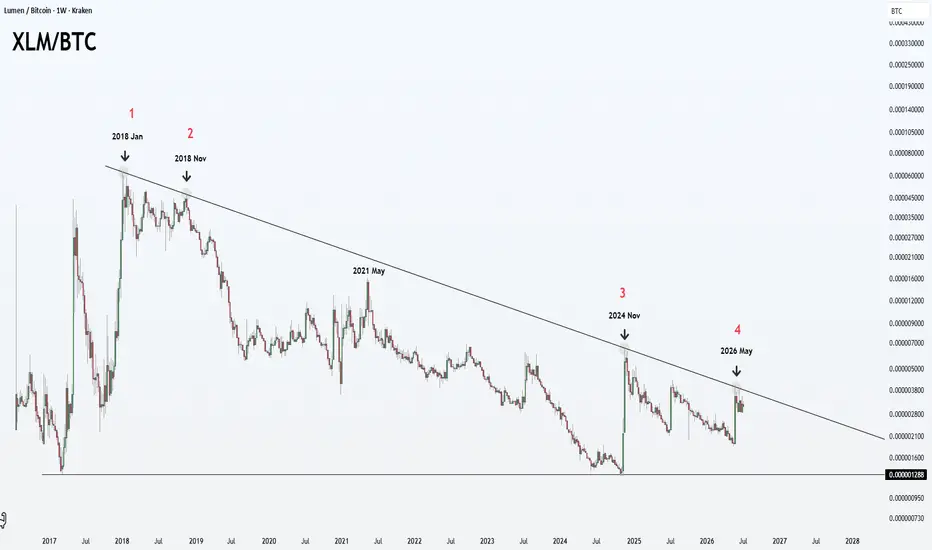
XLM/BTC: THE 5TH TESTFour rejections across nine years.
Same macro ceiling.
Same forgotten chart.
2018 rejected.
2018 rejected again.
2024 rejected.
2026 rejected.
Now the 5th attempt is coming. This is a 9year descending ceiling against Bitcoin.
When a structure tests the same macro line this many times and still re
Compare with XLM/BTC
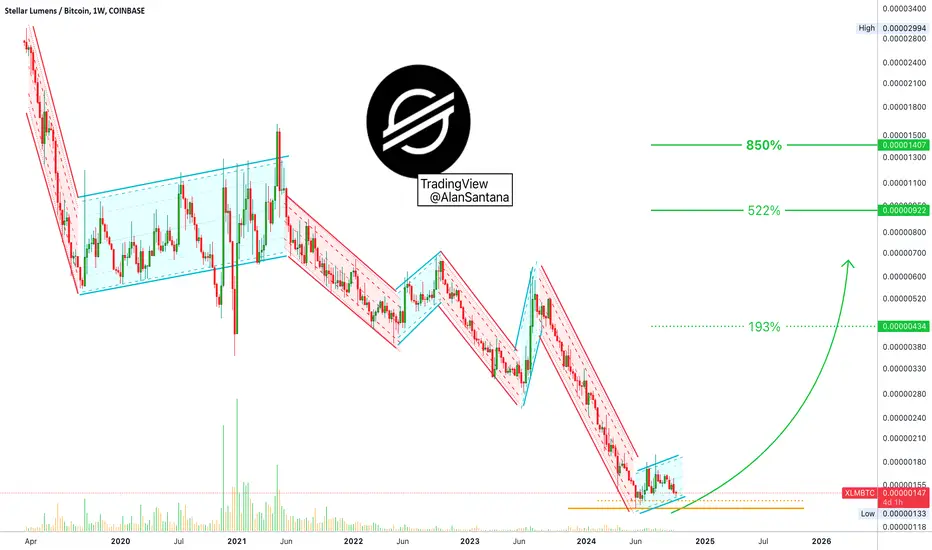
510% (723%) Stellar—XLMBTCThere are many good charts right now, great opportunities.
XLMBTC (Stellar) did a significant lower high in July 2025 vs November 2024. The high in November was 649 satoshis while in July it was 434. Yet, the chart's bullish potential remains intact.
The previous bear market bottom happened in Nov
XLMBTC To Enter Its Biggest Bull Market Ever · 4,855% In 2017Stellar. No bull market vs Bitcoin in 2021. You know what this means? We are due an ultra-strong bull market for XLMBTC in 2025 (and beyond).
The 2017 bull market lasted 308 days. Total growth reached 4,855% within this period. The bear market that followed was brutal. From January 2018 until Novem
Stellar Hit Bottom And I Will Explain Why (Huge Bu-Potential)The reason why we can know the bottom is in for XLMBTC (Stellar) is very simple, let me explain!
Look at the All-Time Low, it happened in early June while the rest of the market went on to crash in early August. XLMBTC was moving up in August and even produced a green session the 5-August week. The
See all ideas
Summarizing what the indicators are suggesting.
Oscillators
Neutral
SellBuy
Strong sellStrong buy
Strong sellSellNeutralBuyStrong buy
Oscillators
Neutral
SellBuy
Strong sellStrong buy
Strong sellSellNeutralBuyStrong buy
Summary
Neutral
SellBuy
Strong sellStrong buy
Strong sellSellNeutralBuyStrong buy
Summary
Neutral
SellBuy
Strong sellStrong buy
Strong sellSellNeutralBuyStrong buy
Summary
Neutral
SellBuy
Strong sellStrong buy
Strong sellSellNeutralBuyStrong buy
Moving Averages
Neutral
SellBuy
Strong sellStrong buy
Strong sellSellNeutralBuyStrong buy
Moving Averages
Neutral
SellBuy
Strong sellStrong buy
Strong sellSellNeutralBuyStrong buy
Displays a symbol's price movements over previous years to identify recurring trends.