GOLD XAUUSD LINE CHART STRATEGY.what to look for in buying and selling of gold
the US10Y???
THE DOLLAR INDEX PRICEACTION=?
The united states economic dockets=??
the market structure of DOLLAR INDEX should be paired with the price action of GOLD on the same time frame(example the 1hr chart of dollar index should be paired with 1 hour chart of GOLD ,DAILY dollar index vs daily gold ).note best trades come when you are selling gold to buy dollar on higher time frame structure.
what is GOLD ???
Gold as chemical element and symbol
AB=CD
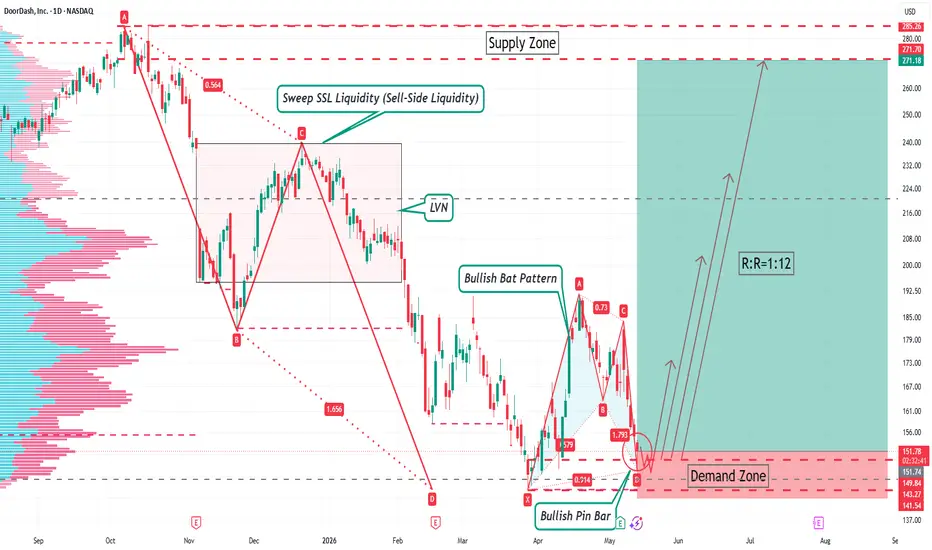
Trading Plan — DoorDash (DASH)Trading Plan — DoorDash (DASH)
Timeframe: Daily Chart
Direction: Long
Entry Price: $151.87 (Market entry directly)
Stop-Loss: $142.50
Profit Targets & Position Management
1. TP1: $173.70
• Reduce 50% of total position
• Move stop loss to breakeven for profit protection
2. TP2: $202.80
• Reduce 50% of the remaining position
• Adjust stop loss to $173.70 for profit lock
3. TP3: $230.00
• Reduce 50% of the remaining position
• Adjust stop loss to $202.80 for profit protection
4. TP4: $2
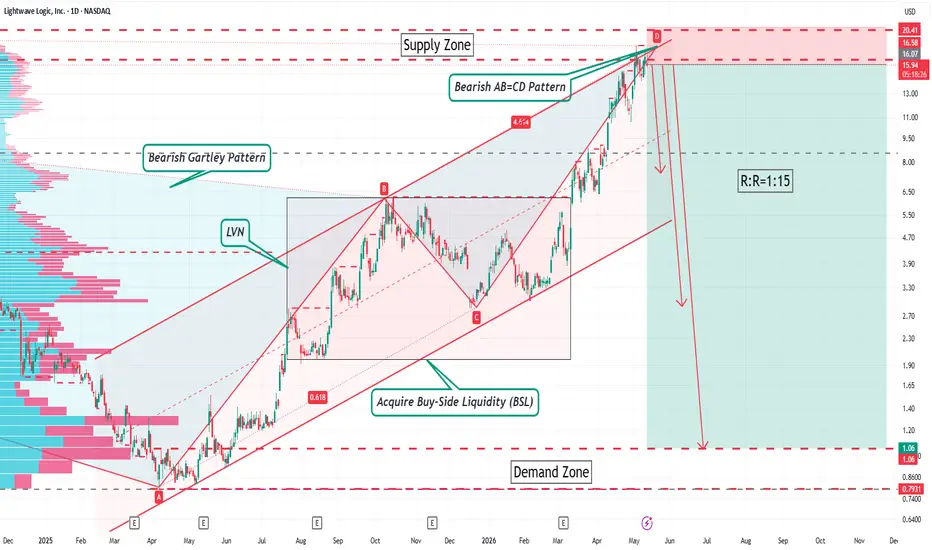
LWLG Daily Short Trading PlanLWLG Daily Short Trading Plan
Symbol: LWLG
Timeframe: Daily
Direction: Short
Entry Price: 16.07
Stop Loss: 20.50
Take Profit & Position Management
1. First Target: 7.30 - Reduce half position, move stop loss to breakeven
2. Second Target: 2.80 - Reduce half of remaining position, adjust protective stop loss
3. Third Target: 1.00 - Reduce half of remaining position, adjust protective stop loss
4. Final Position: Hold remaining position with trailing stop loss
Risk Disclaimer
US stock tra
NZD/USD 30-Minute Short Trading PlanNZD/USD 30-Minute Short Trading Plan
Trading Instrument: NZD/USD
Timeframe: 30 Minutes
Trading Direction: Short
Entry Level: Around 0.59658
Stop Loss: 0.59800
TP1: Around 0.59377
Close 50% position, move stop loss to breakeven.
TP2: Around 0.59125
Close another half of remaining position, trail stop loss to protect profits.
TP3: Around 0.58720
Reduce half of leftover position again, continue trailing stop loss.
Remaining position: Hold with trailing stop loss and exit following market pric
NZDUSD 4H Trading PlanNZDUSD 4H Trading Plan
Trading Instrument: NZDUSD
Timeframe: 4 Hours
Current Price: 0.59654
Long Trade Setup
1. Wait for price to break above 0.59915 and complete Sweep SSL Liquidity (sell-side liquidity sweep).
2. Enter long position after bullish confirmation, price must not break below 0.59539 to form a valid Structure Flip support.
3. Take Profit: Target at the completion zone of Bearish Gartley Pattern & Bearish AB=CD Pattern, near 0.60570.
Subsequent Short Trade Setup
After price re
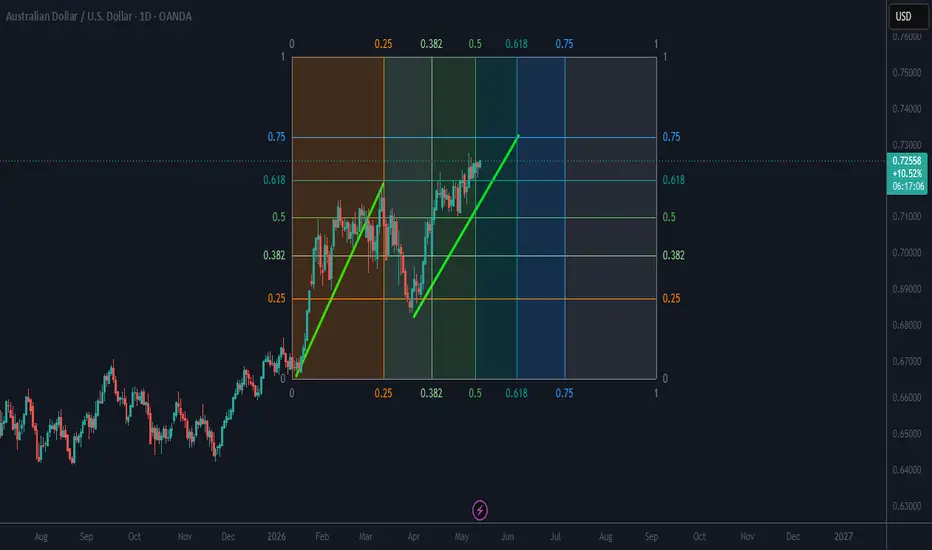
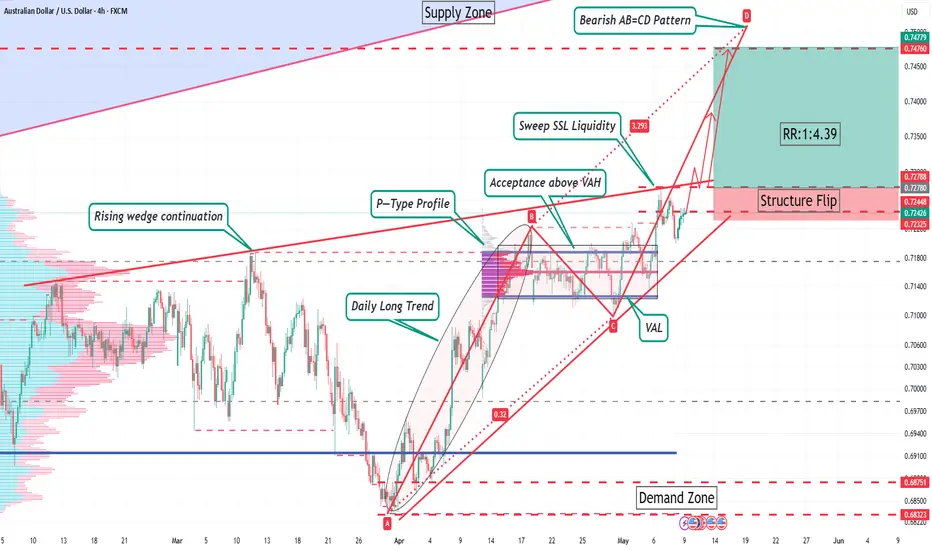
AUDUSD 4H Trading PlanAUDUSD 4H Trading Plan
Trading Instrument: AUDUSD
Timeframe: 4 Hours
Wait for price to break above previous high 0.72780, sweep sell-side SSL liquidity.
Enter long position on valid pullback candlestick confirmation, price must not break Structure Flip support level 0.72325.
Entry: Around 0.72780
Stop Loss: 0.72325
Take Profit 1: Near 0.73800
Partial close half position, move stop loss to break-even.
Take Profit 2: Near 0.74700
Partial close again, adjust trailing protection.
Remaining pos
AUD/USD 30-Minute Short Trading PlanAUD/USD 30-Minute Short Trading Plan
Trading Instrument: AUD/USD
Timeframe: 30 Minutes
Trading Direction: Short
Entry Level: Around 0.72350
Stop Loss: 0.72555
TP1: Around 0.72050
Close 50% position, move stop loss to breakeven.
TP2: Around 0.71790
Close another half of remaining position, trail stop loss to protect profits.
TP3: Around 0.71500
Reduce half of leftover position again, continue trailing stop loss.
Remaining position: Hold with trailing stop loss and exit according to market st
NZD/USD H1 Short Trade PlanNZD/USD H1 Short Trade Plan
Instrument: NZD/USD
Timeframe: H1 (1 Hour)
Trade Bias: Short Sell at market price
Entry: Around 0.59540
Stop Loss: 0.59750
TP1: 0.59170 → Close 50% position, move SL to break-even
TP2: 0.58828 → Reduce position again, adjust SL to lock profit
TP3: 0.58313 → Partial exit, trail stop loss for profit protection
Remaining position: Hold with trailing stop protection
Risk Disclaimer
Leveraged forex trading carries high volatility and unpredictable risks. News shocks and
AUD/USD H1 Short Trade PlanAUD/USD H1 Short Trade Plan
Instrument: AUD/USD
Timeframe: H1 (1 Hour)
Trade Bias: Short Sell at market price
• Entry: Around 0.72307
• Stop Loss: 0.72500
• TP1: 0.71980 → Close 50% position, move SL to break-even
• TP2: 0.71690 → Reduce position, adjust SL to lock profit
• TP3: 0.71199 → Partial exit, trail stop loss for profit protection
• Remaining position: Hold with trailing stop protection
Risk Disclaimer
Leveraged forex trading carries high market volatility and unexpected risk. News e
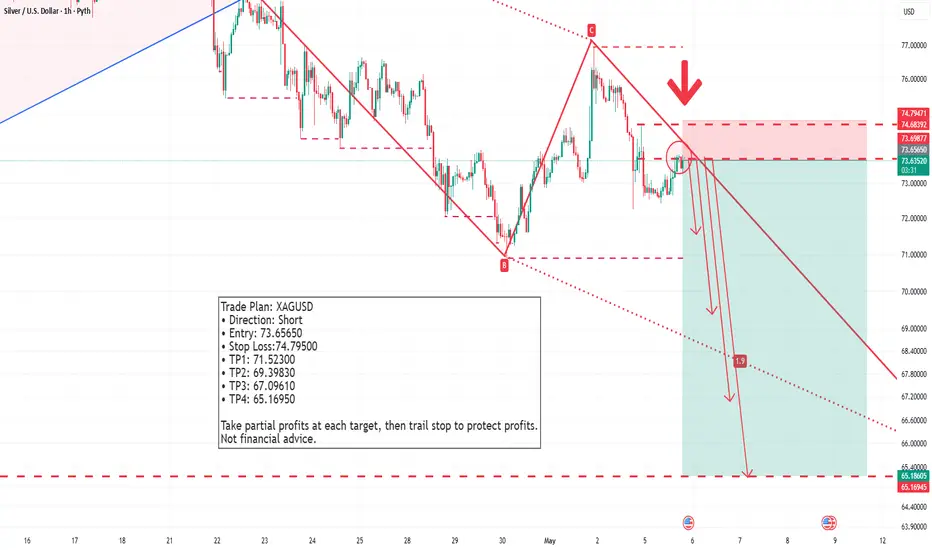
Trade Plan: BTCUSDTTrade Plan: BTCUSDT
• Direction: Long
• Entry: 75115.00
• Stop Loss: 70000.00
• TP1: 83800.00
• TP2: 96800.00
• TP3: 115000.00
Take partial profits at each target, then trail stop to protect profits.
Analysis based on market structure, volume profile and harmonic pattern.
Not financial advice.
EURCAD Bullish Setup | AB=CD Pattern & Higher Low Formation#EURCAD is currently trading in a healthy correction phase after forming clear Higher Highs (HHs), maintaining an overall bullish market structure.
On the 1D timeframe, price action indicates a high-probability AB=CD harmonic pattern. The C leg of the pattern has already formed, and the price is now positioned within a strong demand zone, suggesting a potential Higher Low (HL).
Key Factors Supporting the Setup:
Bullish market structure (HH → HL continuation)
AB=CD pattern development
Price r
Trade Plan: EURUSDTrade Plan: EURUSD
• Direction: Short
• Entry: 1.16940
• Stop Loss: 1.17500
• TP1: 1.16168
• TP2: 1.15460
• TP3: 1.14666
Take partial profits at each target, then trail stop to protect profits.
Analysis based on market structure, volume profile and harmonic pattern.
Not financial advice.
BTCUSD : Breaking freeBittcoin is currently exhibiting a historically unusual market dynamic: prices are stabilizing and beginning to rise while volatility (as measured by DVOL) remains low and is falling. This decoupling of price from explosive volatility marks a structural break from past cycles.
The Core Insight: This phenomenon strongly suggests that the "panic" phase of the recent sell-off has ended with a price bottom near $60,000. The market has not entered a speculative mania but has transitioned into a prof
Thoughts on EURUSDGood afternoon,
The market for EURUSD is looking at a retracement for going bearish in 4H and it was confirmed after a diamond pattern that hasn't reached yet the TP at 1.16631 approximately. The diamond pattern means change in the trend when in 30M has been somewhat bullish and consolidated until the appearance of the pattern. However, a ABCD pattern showed and bounced exactly as predicted at a fibonacci retracement and extension of 0.5:2.0 which is peculiar pair. This gives an opportunity for
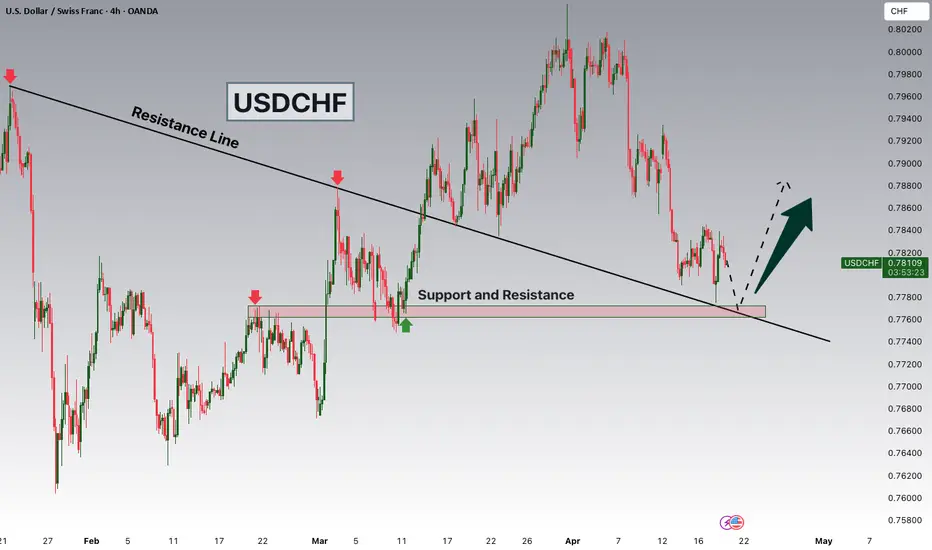
USDCHF Breakout and Potential Retrace!Hey Traders, in today's trading session we are monitoring USDCHF for a buying opportunity around 0.77700 zone, USDCHF was trading in a downtrend and successfully managed to break it out. Currently is in a correction phase in which it is approaching the retrace area at 0.77700 support and resistance area.
Trade safe, Joe.