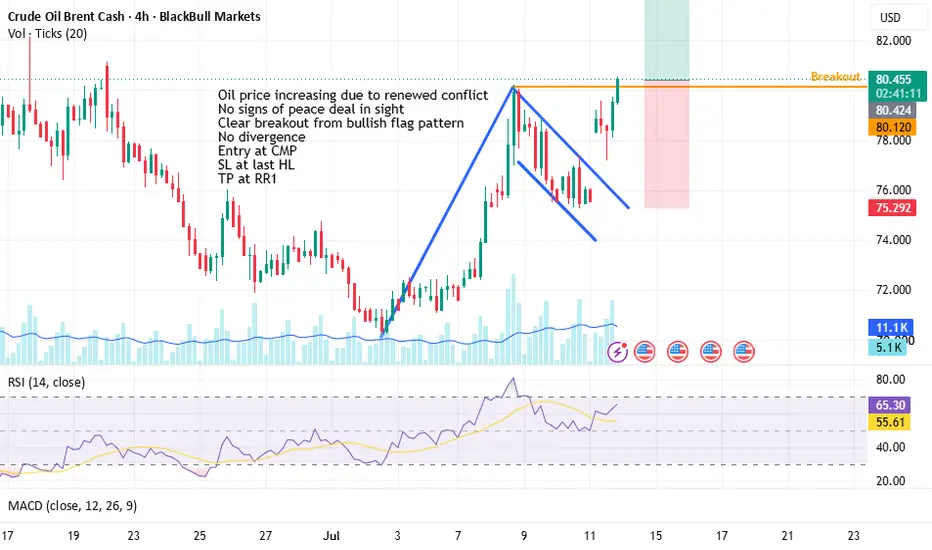
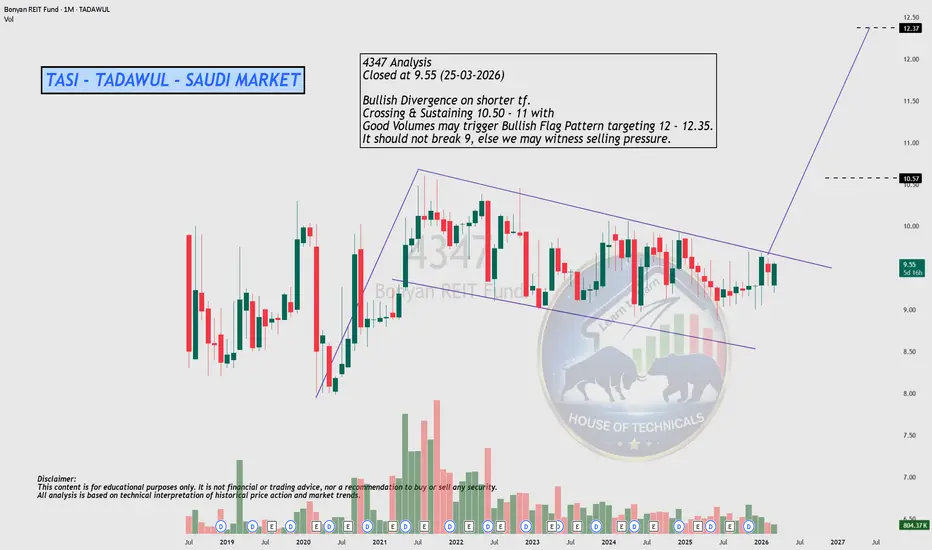
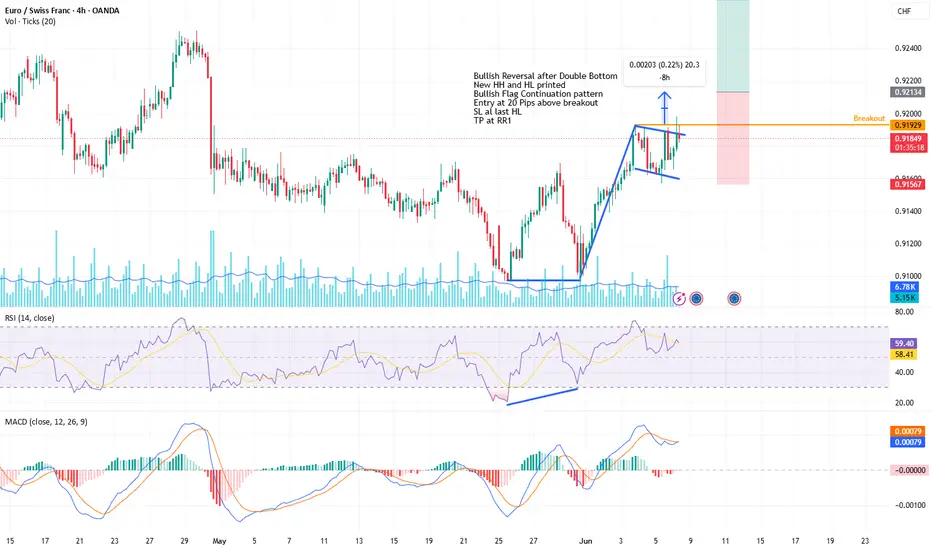
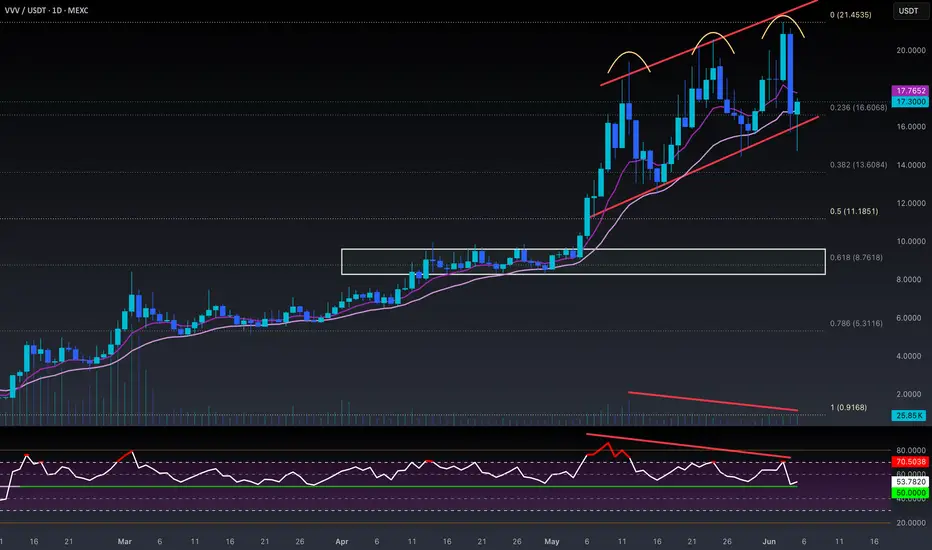
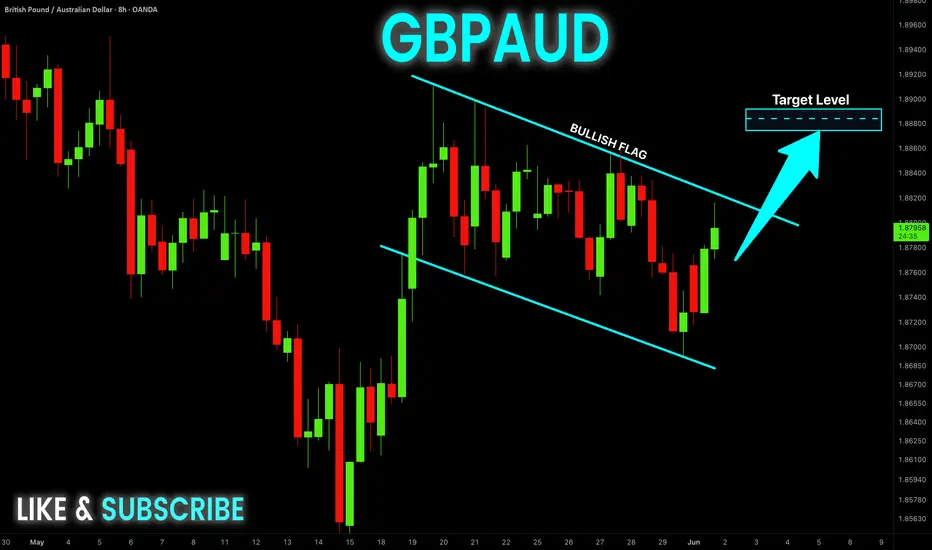
Long
Long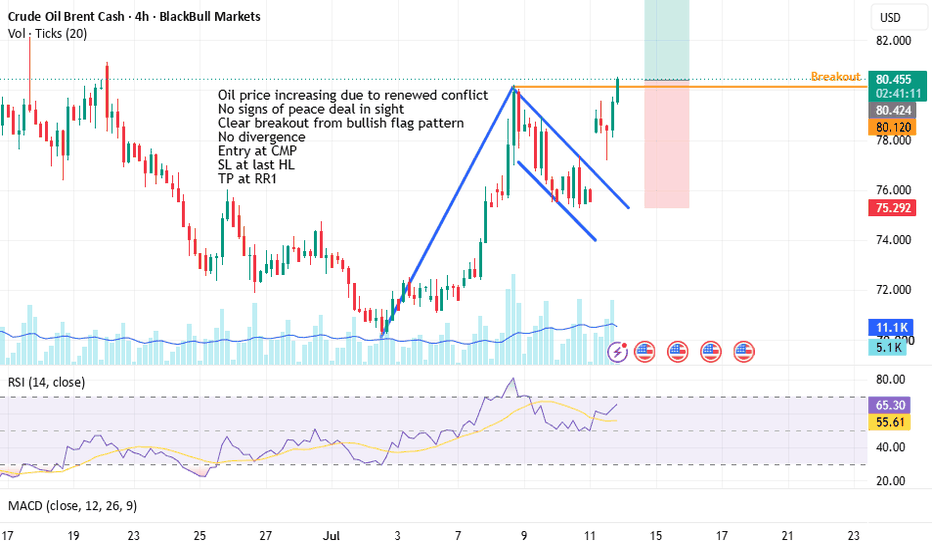
 Long
Long
The Bull Flag Pattern: Why Volume Decides Whether It HoldsMost traders treat a bull flag as a shape: sharp rally, small pullback, buy the breakout. The shape is the easy part, and it is why so many flag trades fail. What separates a genuine pause from a top is volume, the one thing most chart guides leave out of the drawing.
The bull flag pattern is one of the few continuation setups with real evidence behind it, but that evidence depends on a condition the textbook diagram rarely shows: read the volume and you read whether the trend is resting or being handed to someone else.
What Is a Bull Flag Pattern?
A bull flag is a continuation pattern inside an uptrend, built from two parts. The pole is a steep, almost vertical impulse driven by aggressive buying. The flag is a brief, shallow consolidation that drifts sideways or slightly down. The structure goes back to Edwards and Magee's 1948 classic Technical Analysis of Stock Trends , which first organized continuation patterns into a system.
On a bull flag pattern chart, the pole stands nearly vertical and the flag tilts gently against it. The bull flag chart pattern works because of who acts in each phase: the pole is fresh demand, and the flag is short-term holders taking profit while the trend's core buyers hold. Because that selling is light profit-taking, not new supply, volume should fall through the flag and surge on the breakout.
This is the part the diagrams skip. If volume stays heavy or climbs while the flag forms, you are not watching a pause but distribution: larger holders unloading into the rally. Falling volume is the lie detector, and a flag without it is not a flag.
The anatomy of a bull flag: an impulsive pole, a shallow flag, and a breakout. Volume contracts through the flag and expands on the breakout.
Same shape, opposite meaning. Volume stays heavy: that is selling into the rally, and the breakout is far more likely to fail.
How to Trade a Bull Flag Pattern
Three checks decide whether a consolidation is a real flag.
Shallow pullback. The flag should retrace no more than about half the pole. A deeper pullback erases the impulse and points to a reversal, not a rest.
Falling volume. Volume must decline as the flag develops and expand on the breakout. Flat or rising volume is the distribution warning.
Brief duration. A flag is a short pause relative to its timeframe. One that drags on becomes a directionless trading range.
Entry: a close above the flag's upper boundary, ideally on a clear jump in volume that confirms real buyers are pushing price out.
Stop loss: below the flag low. A close back inside the pole voids the setup. One tick under the breakout candle is too tight and gets swept by noise.
Target: the pole's height projected up from the breakout (flags fly at half-mast). Treat it as a tendency, not a promise: only about half of flags actually reach the full projection, so take partials along the way.
A complete bull flag trade: entry on the volume-backed breakout, stop below the flag low, target one pole-length above, with risk-to-reward fixed before entry.
Bull Flag vs Bear Flag
The cleanest way to frame bull flag pattern vs bear flag is the trend they pause. A bull flag forms in an uptrend and slopes down against it; a bear flag forms in a downtrend and slopes up. The geometry mirrors, but the evidence does not: the studies that confirmed the long side found much weaker results for the bear flag, so treat the short side with more caution.
Bull Flag
Prior trend: uptrend
Flag slope: down or sideways, against the trend
Volume in flag: falling
Trade: long on a break above the flag
Bear Flag
Prior trend: downtrend
Flag slope: up or sideways, against the trend
Volume in flag: falling
Trade: short on a break below the flag
An XRP Bull Flag Pattern in Practice
A textbook XRP bull flag pattern appeared during the sharp late-2024 rally. Price ran almost vertically to form the pole, then paused in a tight, slightly downward channel for a few daily candles while volume thinned out. That contraction signalled profit-taking, not a reversal, and when price closed above the flag on a volume surge, the trend resumed. Had volume stayed elevated, the same shape would have been a reason to stand aside.
An XRP bull flag during the late-2024 advance: pole, a flag on fading volume, then a volume-backed breakout that continued the trend.
When the Bull Flag Works and When It Fails
The case for it. The bull flag is one of the rare patterns that has been tested directly rather than just asserted. A 2002 study ran a bull flag template across decades of New York Stock Exchange data and found its buy signals beat random selection. A 2007 study on the Nasdaq and Taiwan indices found that the closer price matched the flag shape, the higher the average return, beating a buy-every-day benchmark. A 2024 study of the Shanghai market reported bull flag buy signals working around 80 percent of the time. Three markets, three eras, the same direction of result.
The case against it. Drawing a flag is subjective, so two traders mark the same chart differently, and an edge that showed up on old data can fade as markets adapt. Worth noting: those studies tested price shape only and ignored volume entirely, which is exactly the filter this article argues you should add on top.
Market regime is decisive. A flag only continues a trend that exists. In a strong uptrend it has something to continue and the breakout has fuel; in a choppy market the same shape is noise that breaks both ways. A clean flag pressed against higher-timeframe resistance fails often. Read the trend before you trust the flag.
A bull flag pattern is not a shape to buy on sight but a test the market passes or fails. The geometry tells you where price paused; the volume tells you whether the pause is real. Demand a shallow pullback and volume that falls into the flag and surges on the break. A flag without falling volume is distribution waiting to disappoint.  Education
 Long
Long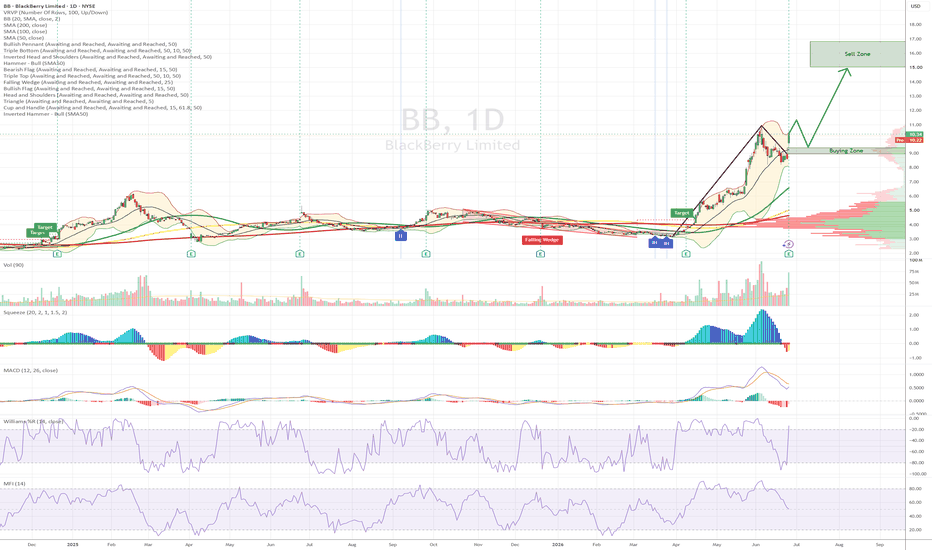
 Long
Long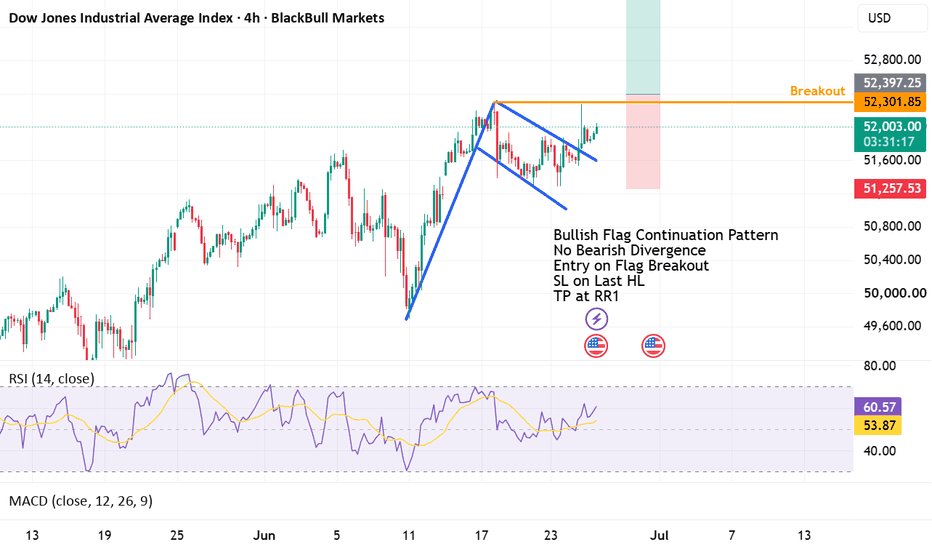
TRENT: Bull Flag Consolidation with Strong Volume Expansion📊 STWP Equity Snapshot
________________________________________
MARKET STRUCTURE SNAPSHOT | NSE: TRENT | DAILY
________________________________________
• Closing Price: ₹2,901.10 (+₹145.80 | +5.29%)
• Core Trend: Uptrend (Weakening)
• Market State: Bull Flag / Consolidation Structure Under Development
• Price Structure: Strong bullish breakout candle emerging from consolidation support
________________________________________
OPERATIONAL PRICE GRID & KEY REFERENCE LEVELS
________________________________________
• Model Reference Level: ₹2,944.50
• Hard Invalidation Level: ₹2,675.50
• Structural Risk: ₹269.00 (9.14%)
• Resistance Levels: R1 ₹2,966.63 | R2 ₹3,032.17 | R3 ₹3,119.83
• Support Levels: S1 ₹2,813.43 | S2 ₹2,725.77 | S3 ₹2,660.23
• Range Structure: Low ₹2,653.73 | High ₹2,986.27
• Higher Timeframe Observation Zones: ₹3,213.50 | ₹3,482.45
________________________________________
MOMENTUM, PARTICIPATION & CPR DATA
________________________________________
• Volume Profile: 2.23M Shares
• Volume Character: Very High Relative Participation
• RSI Metric: 60.60 (Bullish Momentum Zone)
• ADX Reading: 25.40 (Developing Trend Strength)
• ROC: +4.67%
• MACD Status: Strong Positive Momentum Structure
• Stochastic Reading: 83.39 (Extended Momentum Zone)
• Current Bias: BUY BIAS
• CPR State: Bullish Zone | CPR Moving Up (Narrow)
• Today's CPR: Pivot 2753.20 | Top 2754.25 | Base 2752.15
• Tomorrow's CPR (Projected): Pivot 2878.95 | Top 2890.05 | Base 2867.90
________________________________________
📚 EDUCATIONAL OBSERVATION
________________________________________
Trent has delivered a strong bullish session supported by very high market participation, with volume expanding to approximately 2.23 million shares. The latest candle emerged from a prolonged consolidation phase and reflects renewed buyer dominance near the upper portion of the established trading range. Volume expansion alongside a strong bullish candle often attracts attention because it demonstrates participation behind the move rather than a low-conviction advance.
From a chart structure perspective, the manually annotated chart highlights a developing Bull Flag formation. The sharp advance from the April lows created the flagpole, while the subsequent downward-sloping consolidation channel formed the flag structure. Price has repeatedly respected both the upper and lower boundaries of the pattern, and the latest recovery candle has pushed price back toward the upper boundary of the consolidation zone. This suggests that buyers continue defending higher levels while supply gradually contracts within the pattern.
Momentum conditions remain constructive. RSI has improved to 60.60 and remains comfortably within bullish territory, while MACD continues reflecting positive momentum. ADX has strengthened to 25.40, suggesting improving trend strength, and ROC remains firmly positive at 4.67%. Stochastic readings near 83 indicate strong momentum participation, although they also highlight that price is operating within an extended momentum environment.
The projected CPR for the next session continues to shift higher, with a projected Pivot level of ₹2,878.95. A rising CPR structure generally reflects improving market acceptance of higher prices. The dashboard also maintains a BUY BIAS classification with a bullish CPR structure, supporting the ongoing recovery framework. Immediate attention remains focused on the resistance cluster between ₹2,966 and ₹3,032, while the broader range ceiling near ₹2,986 and the flag resistance line remain key observation zones.
The current structural risk between the Model Reference Level and the Hard Invalidation Level stands at ₹269.00 or approximately 9.14%. This provides context regarding the downside distance available before the present technical structure would require reassessment. Beyond the current consolidation pattern, higher timeframe observation zones remain positioned near ₹3,213 and ₹3,482, representing areas where future market reactions may become relevant.
Support and resistance levels should be treated as observation zones rather than predictive targets. Chart patterns, momentum indicators, volume analysis, and CPR frameworks are educational tools that help market participants understand evolving market structure within a disciplined risk-management framework.
________________________________________
⚠️ Disclaimer
________________________________________
• This analysis is provided strictly for educational and informational purposes.
• This is not financial, investment, or trading advice and should not be considered a recommendation to buy or sell any security.
• Stock market investments are subject to market risks, including the possible loss of capital.
• Past performance, historical observations, chart patterns, and technical indicators do not guarantee future results.
• Please conduct your own research and consult a SEBI-registered financial advisor before making investment decisions.
• STWP assumes no responsibility or liability for any financial loss arising directly or indirectly from the use of this information.
 Long
Long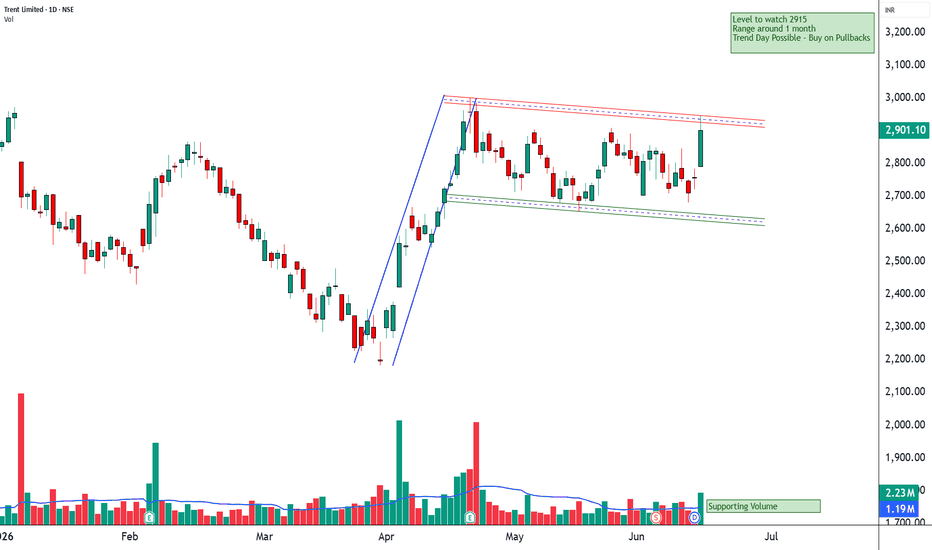
 Long
Long

 Short
Short
 Long
Long
 Long
Long

 Long
Long

 Long
Long