Candlestick Analysis
USD/JPY Bears Pushing Their Luck?We’re coming up to five full days since USD/JPY began selling off. Or four days, if counting from the 367-pip selloff that could have been the MOF intervening — potentially taking advantage of the momentum of an already weakening USD/JPY.
The reason I highlight this is because bears are slowly losing steam. And with USD/JPY having fallen over 750 pips from last week’s high to yesterday’s low, I suspect bears may be pushing their luck by wading in around current levels.
Also note the lower wick
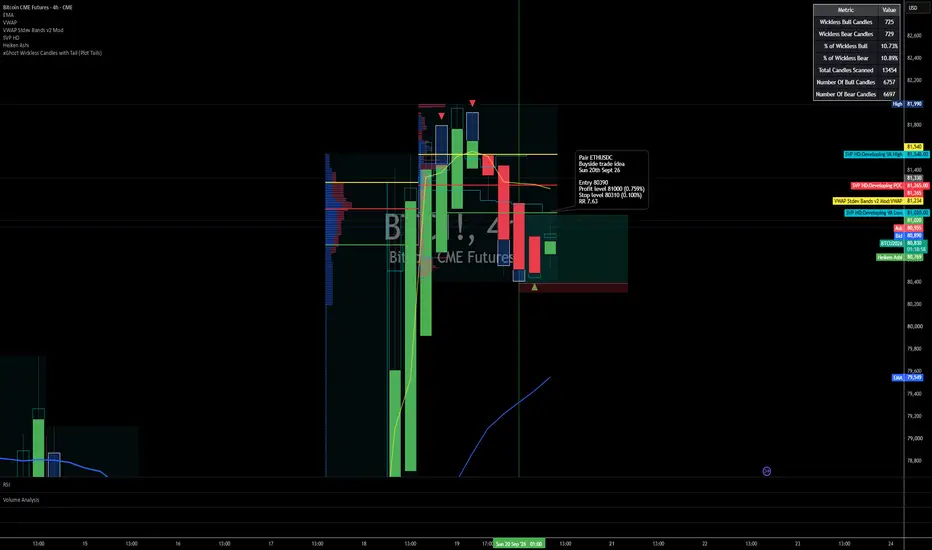
Long trade 🔍 BTCUSDC — POC / VALUE READ
Sunday 20 September 2026
Direction: 🟢 Buy-side
Entry: 80,390
Target: 81,000 (+0.759%)
Stop: 80,310 (-0.100%)
Planned RR: 7.63R
📊 Current Value Structure
From the 4H profile:
Developing VAH: ~81,540
Developing POC: ~81,265
VWAP: ~81,234
Developing VAL: ~81,020
Current price: ~80,820
Entry: 80,390
BTC is therefore still trading below developing value, with the entire value area sitting overhead.
🧠 POC Read
The most important point is that your 81,000 target is just
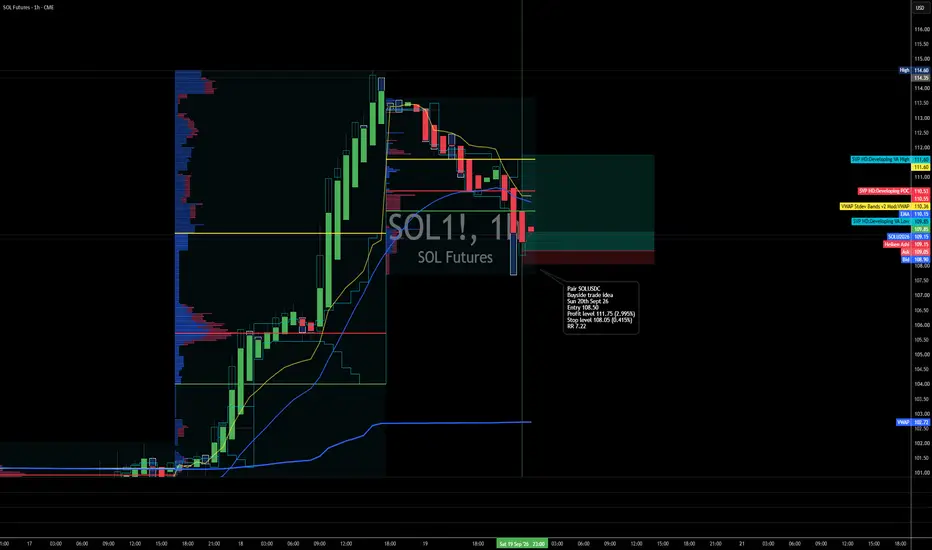
Long trade
🔍 SOLUSDC — POC / VALUE READ
Sunday 20 September 2026
Direction: 🟢 Buy-side
Entry: 108.50
Target: 111.75 (+2.995%)
Stop: 108.05 (-0.415%)
Planned RR: 7.22R
📊 Current Value Structure
From the chart:
Developing VAH: ~111.60
Developing POC: ~110.53
Local VWAP / value mean: ~110.36
Developing VAL: ~109.85
Current price: ~109.15
Entry: 108.50
That puts SOL below developing value, underneath both the VAL and POC.
🧠 POC Read
The POC around 110.53 is currently the main magnet / acceptance test.
For
ANIC: price driven lower, buyers stepped inNegative sentiment is in full swing here, and Agronomics has been selling off hard since June. Very complicated one to get your head around, it’s an ‘investment company backing cellular agriculture and alternative protein businesses’ cultivated meat and precision fermentation’, just rolls off the tongue.
Worth noting the strong uptick in volume at the end of last week. Friday in particular, price sold off hard intraday only to retrace back near the open, a deep wick with a very clear rejection
USD/JPY 45min Swing Trading PlanUSD/JPY 45min Swing Trading Plan
Trading Cycle: 45-Minute Swing Trade
Risk-Reward Ratio: 1:6
Entry: Long entry around current price 157.00
Stop Loss: 156.55
First Target: 158.20
Close half position and trail protective stop after reaching the first target.
Second Target: 159.50
Close half of the remaining position and trail the protective stop again after reaching the second target.
Leave the final tail position with trailing protection.
Risk Warning
USD/JPY has high volatility, especially
AUD/USD 15min Swing Trading PlanAUD/USD 15min Swing Trading Plan
Trading Cycle: 15-Minute Swing Trade
Risk-Reward Ratio: 1:7.58
Entry: Short entry around current price 0.71282
Stop Loss: 0.71345
First Target: 0.71100
Close half position and trail protective stop after reaching the first target.
Second Target: 0.70840
Close half of the remaining position and trail protective stop again after reaching the second target.
Leave the final tail position floating with trailing protection.
Risk Warning
The foreign exchange market
XAU/USD 30min Swing Trading PlanXAU/USD 30min Swing Trading Plan
Trading Cycle: 30-Minute Swing Trade
Risk-Reward Ratio: 1:12.95
Entry: Short entry around current price 4391.00
Stop Loss: 4404.50
First Target: 4340.80
Close half position and trail protective stop after reaching the first target.
Second Target: 4300.00
Close half of the remaining position and trail the protective stop again after reaching the second target.
Third Target: 4250.00
Reduce position and update trailing protection at the third target.
Leave the f
EURCAD LONGMarket structure bullish on HTFs DH
Entry At both Weekly and Daily AOi
Weekly Rejection at AOi
Daily Rejection at AOi
Previous Daily Structure Point
Around Psychological Level 1.60500
Touching EMA H4
H4 Candlestick rejection
Rejection from Previous structure
TP: WHO KNOWS!
Entry 100%
REMEMBER : Trading is a Game Of Probability
: Manage Your Risk
: Be Patient
: Every Moment Is Unique
: Rinse, Wash, Repeat!
: Christ is King
USDCHF LONGMarket structure bullish on HTFs 3
Entry at both Weekly and Daily AOi
Weekly Rejection at AOi
Weekly Previous Structure Point
Daily Rejection at AOi
Previous Daily Structure Point
Touching EMA H4
H4 Candlestick rejection
Rejection from Previous structure
TP: WHO KNOWS!
Entry 115%
REMEMBER : Trading is a Game Of Probability
: Manage Your Risk
: Be Patient
: Every Moment Is Unique
: Rinse, Wash, Repeat!
: Christ is King
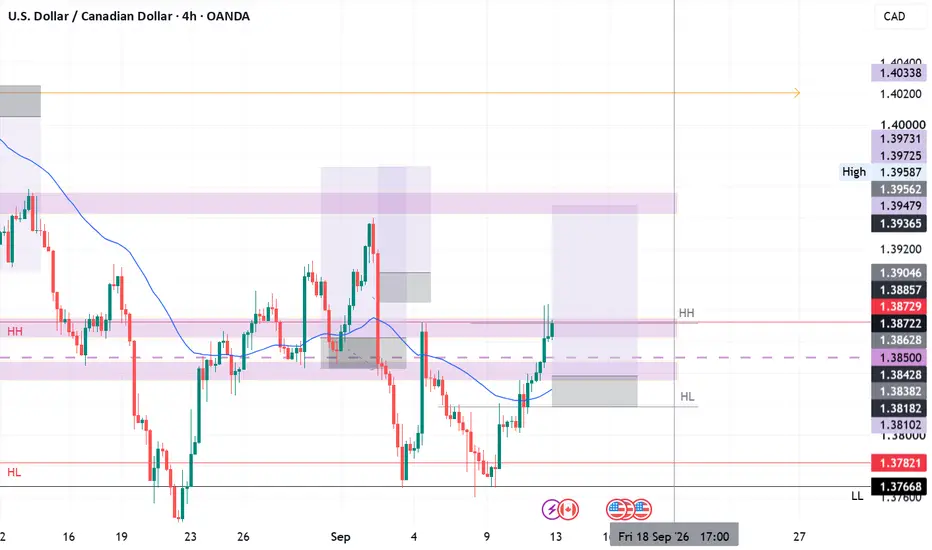
USDCAD LongMarket structure bullish on HTFs DH
Entry at both Weekly and Daily AOi
Weekly Rejection at AOi
Daily Rejection at AOi
Previous Daily Structure Point
Around Psychological Level 1.38500
Touching EMA H4
H4 Candlestick rejection
Rejection from Previous structure
TP: WHO KNOWS!
Entry 100%
REMEMBER : Trading is a Game Of Probability
: Manage Your Risk
: Be Patient
: Every Moment Is Unique
: Rinse, Wash, Repeat!
: Christ is King
NZDUSD ShortsMarket structure bearish at AOi 3
Weekly Rejection at AOi
Daily Rejection at AOi
Daily EMA retest
Previous Daily Structure Point
Around Psychological Level 0.58500
Touching EMA H4
H4 Candlestick rejection
Rejection from Previous structure
TP: WHO KNOWS!
Entry 115%
REMEMBER : Trading is a Game Of Probability
: Manage Your Risk
: Be Patient
: Every Moment Is Unique
: Rinse, Wash, Repeat!
: Christ is King
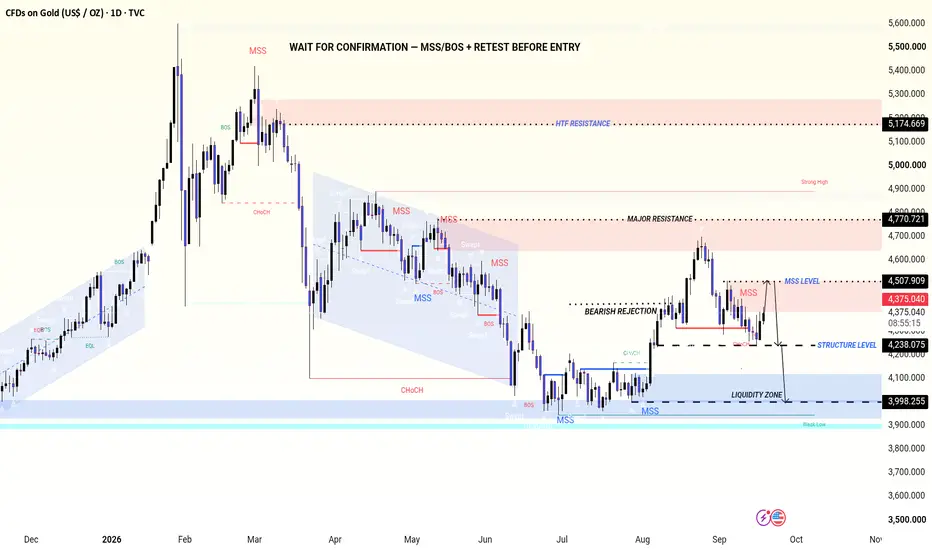
Gold 1D Outlook | MSS, BOS & Key Liquidity LevelsXAUUSD 1D — Market Structure, Liquidity & Supply/Demand Analysis
Gold is currently trading around 4,373, with the daily chart showing a clear sequence of structural shifts after the previous major decline. The analysis is based on MSS, BOS, liquidity sweeps, supply/demand zones and key support/resistance levels marked on the chart.
1. Previous Bullish Expansion
The left side of the chart shows a strong bullish phase where price continued forming higher highs and higher lows. Multiple BOS for
XMR 3 Month Heikin Ashi Trend ChartWe have here a trend outlook chart for Monero on a 3 monthly timeframe (Heikin Ashi candlestick chart). XMR is one of a handful of high market cap coins which have showed signs of strength on a variety of indicators (despite high volatility with various other high market cap coins), including the positive MACD and RSI indicators as shown in this chart.
In addition, there has been significant buy volume in the 170 - 277 price range, as can be seen in the Price-Volume indicator to the right of th
BOKU breakout into thin air toward 139pBOKU has made a new price move here, pushing the boundaries from the previous gap down back in July.
Volume profile on the right tells you why this move has room to run, there’s very little volume sitting between here and the next resistance zone around 139p. Thin volume above means less selling pressure to work through, so a push toward that level wouldn’t be a huge surprise, though nothing’s guaranteed from here.
Worth flagging too, BlackRock’s been trimming its BOKU position steadily since
BTC/USDT 15min Swing Trading PlanBTC/USDT 15min Swing Trading Plan
Trading Cycle: 15-Minute Swing Trade
Risk-Reward Ratio: 1:7.29
Entry: Long entry around current price 77523.58
Stop Loss: 77205.00
First Target: 78575.00
Close half position and trail protective stop after reaching the first target.
Second Target: 79466.00
Close half of the remaining position and trail protective stop again after reaching the second target.
Leave the final tail position floating with trailing protection.
Risk Warning
Cryptocurrency markets
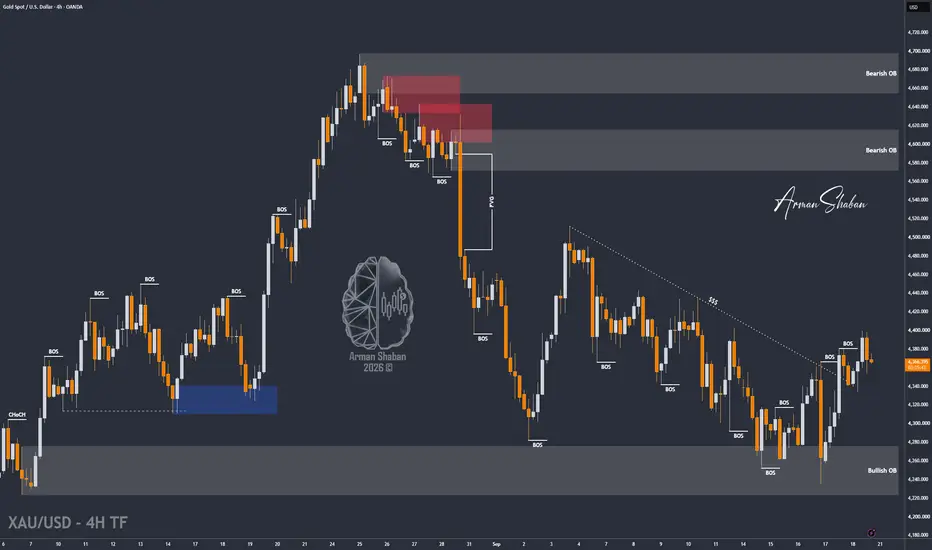
XAU/USD | Gold Hits $4399, Can Buyers Defend $4360?By analyzing the #Gold chart on the 4H timeframe, we can see that price followed our bullish scenario and rallied toward $4399 . However, after reaching the important supply zone, sellers stepped in and pushed Gold back toward $4368 .
In my view, $4360 is now the key level . If Gold manages to close a 4H candle above this level within the next four hours, I expect another bullish attempt toward $4380, $4400, $4425, $4440 and potentially $4460 .
If you've been following these Gold updates a
EURGBP: Pullback After Trap 🇪🇺🇬🇧
EURGBP will likely retrace after a confirmed bullish trap above a strong intraday resistance.
I see strong bearish price action on a 4H time frame.
Goal - 0.8582
❤️Please, support my work with like, thank you!❤️
I am part of Trade Nation's Influencer program and receive a monthly fee for using their TradingView charts in my analysis.
GBPUSD: Bullish After the News 🇬🇧🇺🇸
GBPUSD looks bullish after the news.
The price violated a horizontal neckline of a cup & handle pattern on an hourly time frame.
Expect a pullback to 1.3386
❤️Please, support my work with like, thank you!❤️
I am part of Trade Nation's Influencer program and receive a monthly fee for using their TradingView charts in my analysis.