USDCHF LONGMarket structure bullish on HTFs 3
Entry at both Weekly and Daily AOi
Weekly Rejection at AOi
Weekly Previous Structure Point
Daily Rejection at AOi
Previous Daily Structure Point
Touching EMA H4
H4 Candlestick rejection
Rejection from Previous structure
TP: WHO KNOWS!
Entry 115%
REMEMBER : Trading is a Game Of Probability
: Manage Your Risk
: Be Patient
: Every Moment Is Unique
: Rinse, Wash, Repeat!
: Christ is King
Candlestick Analysis
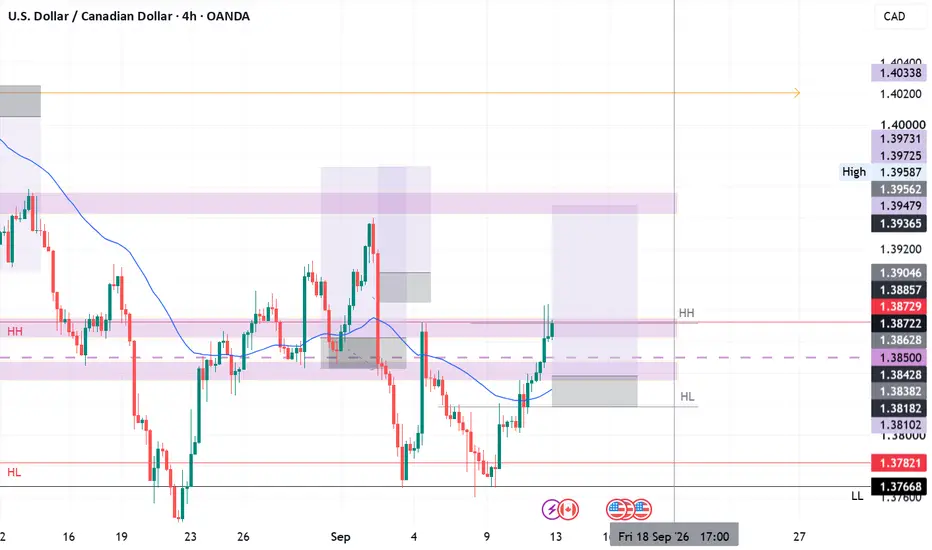
USDCAD LongMarket structure bullish on HTFs DH
Entry at both Weekly and Daily AOi
Weekly Rejection at AOi
Daily Rejection at AOi
Previous Daily Structure Point
Around Psychological Level 1.38500
Touching EMA H4
H4 Candlestick rejection
Rejection from Previous structure
TP: WHO KNOWS!
Entry 100%
REMEMBER : Trading is a Game Of Probability
: Manage Your Risk
: Be Patient
: Every Moment Is Unique
: Rinse, Wash, Repeat!
: Christ is King
NZDUSD ShortsMarket structure bearish at AOi 3
Weekly Rejection at AOi
Daily Rejection at AOi
Daily EMA retest
Previous Daily Structure Point
Around Psychological Level 0.58500
Touching EMA H4
H4 Candlestick rejection
Rejection from Previous structure
TP: WHO KNOWS!
Entry 115%
REMEMBER : Trading is a Game Of Probability
: Manage Your Risk
: Be Patient
: Every Moment Is Unique
: Rinse, Wash, Repeat!
: Christ is King
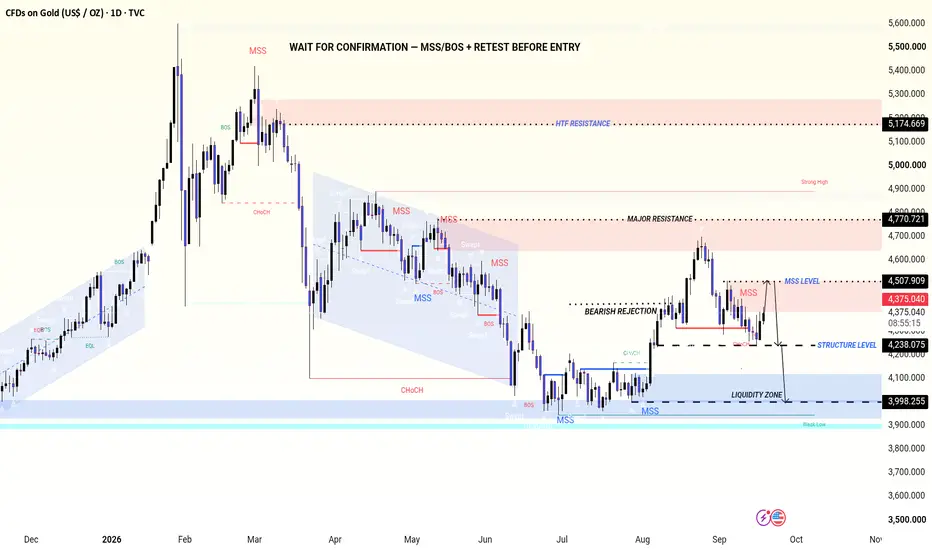
Gold 1D Outlook | MSS, BOS & Key Liquidity LevelsXAUUSD 1D — Market Structure, Liquidity & Supply/Demand Analysis
Gold is currently trading around 4,373, with the daily chart showing a clear sequence of structural shifts after the previous major decline. The analysis is based on MSS, BOS, liquidity sweeps, supply/demand zones and key support/resistance levels marked on the chart.
1. Previous Bullish Expansion
The left side of the chart shows a strong bullish phase where price continued forming higher highs and higher lows. Multiple BOS for
XMR 3 Month Heikin Ashi Trend ChartWe have here a trend outlook chart for Monero on a 3 monthly timeframe (Heikin Ashi candlestick chart). XMR is one of a handful of high market cap coins which have showed signs of strength on a variety of indicators (despite high volatility with various other high market cap coins), including the positive MACD and RSI indicators as shown in this chart.
In addition, there has been significant buy volume in the 170 - 277 price range, as can be seen in the Price-Volume indicator to the right of th
BOKU breakout into thin air toward 139pBOKU has made a new price move here, pushing the boundaries from the previous gap down back in July.
Volume profile on the right tells you why this move has room to run, there’s very little volume sitting between here and the next resistance zone around 139p. Thin volume above means less selling pressure to work through, so a push toward that level wouldn’t be a huge surprise, though nothing’s guaranteed from here.
Worth flagging too, BlackRock’s been trimming its BOKU position steadily since
BTC/USDT 15min Swing Trading PlanBTC/USDT 15min Swing Trading Plan
Trading Cycle: 15-Minute Swing Trade
Risk-Reward Ratio: 1:7.29
Entry: Long entry around current price 77523.58
Stop Loss: 77205.00
First Target: 78575.00
Close half position and trail protective stop after reaching the first target.
Second Target: 79466.00
Close half of the remaining position and trail protective stop again after reaching the second target.
Leave the final tail position floating with trailing protection.
Risk Warning
Cryptocurrency markets
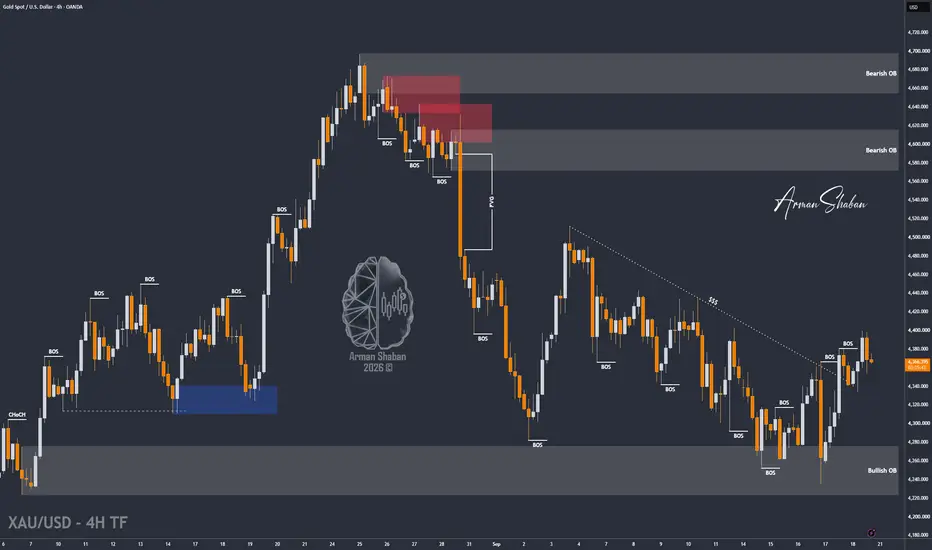
XAU/USD | Gold Hits $4399, Can Buyers Defend $4360?By analyzing the #Gold chart on the 4H timeframe, we can see that price followed our bullish scenario and rallied toward $4399 . However, after reaching the important supply zone, sellers stepped in and pushed Gold back toward $4368 .
In my view, $4360 is now the key level . If Gold manages to close a 4H candle above this level within the next four hours, I expect another bullish attempt toward $4380, $4400, $4425, $4440 and potentially $4460 .
If you've been following these Gold updates a
EURGBP: Pullback After Trap 🇪🇺🇬🇧
EURGBP will likely retrace after a confirmed bullish trap above a strong intraday resistance.
I see strong bearish price action on a 4H time frame.
Goal - 0.8582
❤️Please, support my work with like, thank you!❤️
I am part of Trade Nation's Influencer program and receive a monthly fee for using their TradingView charts in my analysis.
GBPUSD: Bullish After the News 🇬🇧🇺🇸
GBPUSD looks bullish after the news.
The price violated a horizontal neckline of a cup & handle pattern on an hourly time frame.
Expect a pullback to 1.3386
❤️Please, support my work with like, thank you!❤️
I am part of Trade Nation's Influencer program and receive a monthly fee for using their TradingView charts in my analysis.
BOWL threeday consolidation on heavy volumeFirst on my radar this week was Hollywood Bowl. A strong and steady performer which caters well to its family audiences, I was a big fan of its competitor years ago, Ten Entertainment, which eventually got bid for.
Notable falls this week on decent volume with no news behind it as far as I can tell, and its the last 3 days which have caught my attention. The volume continues to pile in, yet it would seem the buyers have come steaming in causing the price action to consolidate for a few days. Ot
XAU/USD Trading PlanXAU/USD Trading Plan
Trading Instrument
XAU/USD
Trading Timeframe
30min Swing Trade
Trading Direction
Short
Entry Price
Enter short near market price: 4365.00
Stop Loss
Stop Loss: 4373.50
Take Profit & Position Management
TP1: 4330.00
Reduce 50% position, move stop loss to break-even.
TP2: 4290.00
Reduce 50% of the remaining position, move stop loss to break-even.
TP3: 4235.00
Reduce 50% of the remaining position, move stop loss to break-even.
The last portion of position uses tra
Short term Long opportunity on XAUUSDPrimo opportunity to go for a Long day trade as price reacts off of support, pushing higher into a bearish FVG that lacks significant gaps in volume profile for the zone, indicating this is a weak FVG that will likely be invalidated and price will push further up into the next bearish FVG, before returning to bearish momentum
ASHM sharp dip then instant recovery on big volume.A nice looking bowl pattern forming here, price action has been very slowly tracking upwards.
Interestingly, when I added a note on the chart last Friday it looked very much like a tree shake. A large downward lurch in price, only to retrace on really strong volume, right before today’s earnings.
Is it a coincidence the results were so positive? Assets under management up 13%. Gross subscriptions rose 92% and redemptions dropped 20%. Pre-tax profit increased 17% to £126.9m.
Price opened lower
ORB for Swing Traders. The Quarterly Range Breakout (QRB) MethodTaking the principles of the 15-Minute ORB and applying them to swing trading
For years, one of the most popular approaches to intraday trading has been the Opening Range Breakout, or ORB.
The concept is beautifully simple:
Allow the market to establish an initial range.
Mark the high and low of that range.
Wait for price to break outside of it.
Use the breakout, market structure, momentum, and available space to determine whether a new directional move is developing.
I have spent
XAU/USD | Tonight’s Fed Decision Could Change Everything! (READ)By analyzing the #Gold chart on the 6H timeframe, we can see that price continued its recovery from the important demand zone and is currently trading around $4351 . However, Gold is now approaching a descending trendline and nearby resistance.
Tonight, the Federal Reserve is widely expected to raise interest rates by 25 basis points , potentially marking its first hike since 2023. However, this move is largely priced in, so the Fed’s forward guidance will be just as important as the decision
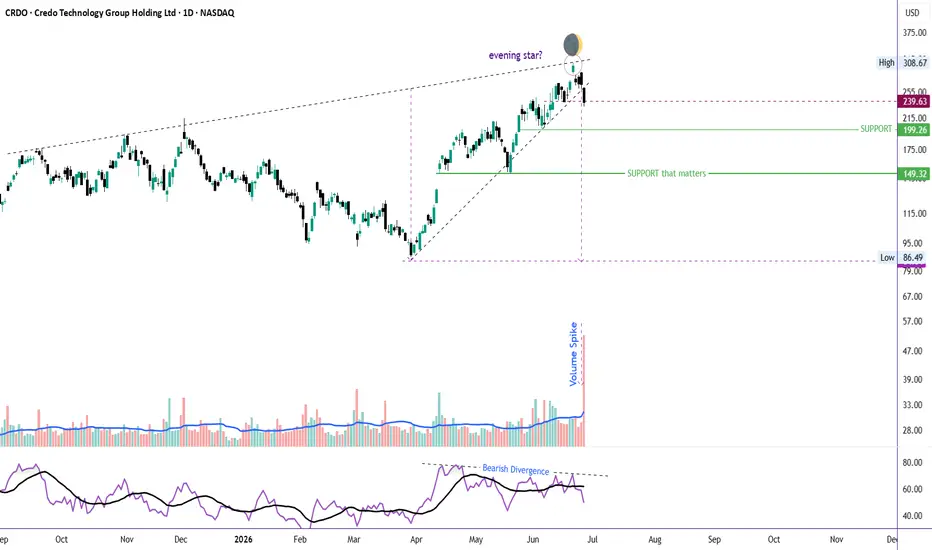
CRDO: Multi-TF Bearish Divergence Signals a Major CorrectionCRDO has hit the target shared previously (see attached post).
Now it appears to be entering a significant corrective phase after an extended bullish run.
The stock has developed bearish divergence on both the Daily and Weekly timeframes, indicating that bullish momentum has been fading despite price making new highs. It recently reached the upper boundary of a rising wedge near 308, where sellers stepped in aggressively.
Adding to the bearish case, price formed an Evening Star reversal patt
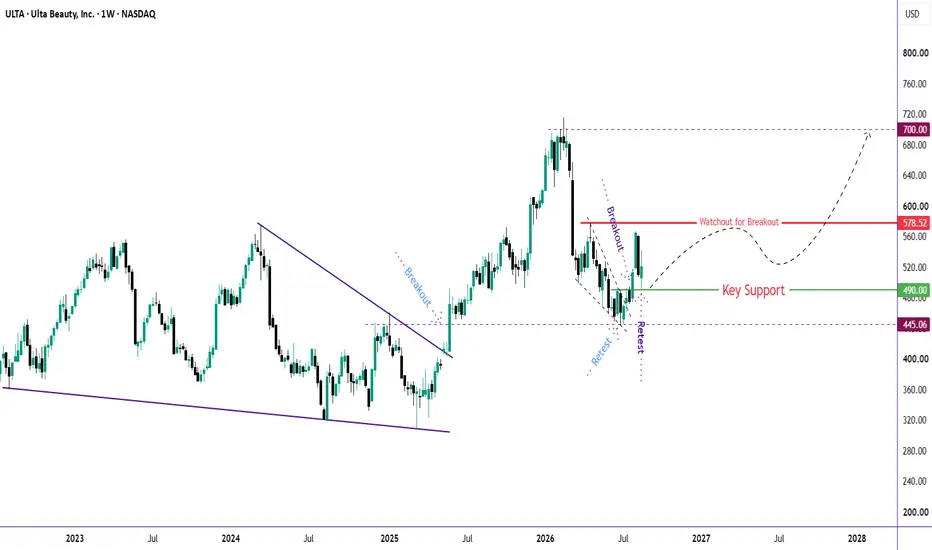
ULTA: Doji Suggests the Pullback May Be Over — Next Leg Higher?Sometimes the important part of a breakout isn't the breakout itself...
It's what happens after the breakout.
ULTA has been giving us an interesting sequence:
🔹 Broke out of the long-term falling structure
🔹 Ran all the way above $700
🔹 Pulled back sharply
🔹 Returned to $445 — the previous breakout level
🔹 Successfully retested that zone
🔹 Recovered and broke above $490
🔹 Reached $565
🔹 And now pulled back to retest the $490–500 area
And this is where the chart gets interesting. 👀
🧩 The lat