Long
Long
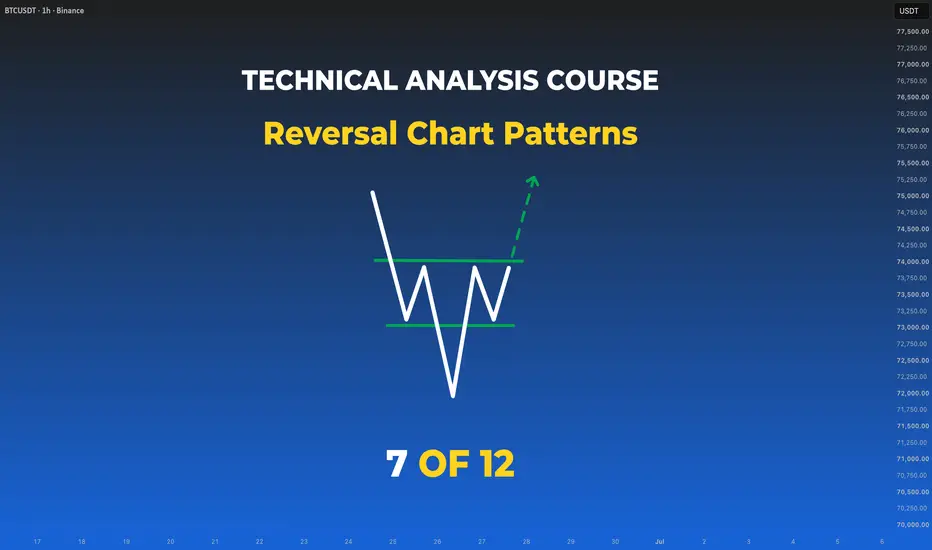
Trading Roadmap | Classical TA·Lesson 07—Reversal Chart PatternsLesson 7 - Reversal Chart Patterns: How Trends End
Difficulty: (Beginner–Intermediate)
Many major trend reversals leave recognizable structures on the chart — shapes that professionals have been reading for a century. Head & Shoulders, Double Tops, Triple Tops, and Rounding patterns are the classical reversal formations. Learn to recognize them early, and you can prepare for possible trend changes with more structure.
🔵 RECAP — WHERE WE LEFT OFF
In Lesson 6, you learned multi-candle reversal patterns — Engulfing, Stars, Three Soldiers. Those are small, precise signals. Now we zoom out to the big structural shapes that unfold over weeks or months and often mark the end of entire trends.
🔵 WHY CHART PATTERNS MATTER MORE THAN CANDLES
A candle pattern shows a moment. A chart pattern shows a shift in market psychology over time.
When a trend has run for months, the market rarely reverses in one candle. It often builds a shape — usually 3 or more swings — that can signal distribution or accumulation is happening. That shape is your early warning.
🐳 Pro Tip: A weekly Head & Shoulders can signal a larger shift than the same pattern on a 5-minute chart. The bigger the timeframe, the more meaningful the potential move.
🔵 1. HEAD & SHOULDERS — THE KING OF REVERSALS
One of the most widely followed reversal patterns in classical TA.
Structure (bearish reversal at trend top):
Left Shoulder — a peak followed by a pullback
Head — a higher peak (the highest of the three)
Right Shoulder — a lower peak roughly at the level of the left shoulder
Neckline — the line connecting the two pullback lows between the peaks
Confirmation: pattern completes when price closes below the neckline.
Target: measure the distance from the top of the head to the neckline. Project that same distance downward from the neckline break.
Inverted Head & Shoulders — same structure mirrored, at the bottom of a downtrend. Bullish reversal.
🐳 Pro Tip: The right shoulder should typically stay below the head. If it makes a new high, the pattern is often invalidated.
🔵 2. DOUBLE TOP & DOUBLE BOTTOM
Two failed attempts at the same extreme. Simple, common, and widely used.
Double Top (Bearish Reversal): price rallies to a high, pulls back, rallies to the same high, and fails again. The pullback low between the two peaks is the neckline .
Double Bottom (Bullish Reversal): mirror image at a support level.
Confirmation: pattern completes when price closes beyond the neckline.
Target: measure the distance from the peak (or trough) to the neckline. Project that distance beyond the break.
🐳 Pro Tip: The two peaks (or bottoms) should be near-identical in price. If the second one is significantly higher/lower, it may not be a Double Top — the trend could still be continuing.
🔵 3. TRIPLE TOP & TRIPLE BOTTOM
Three failed attempts instead of two. Rarer than doubles, but often carry more weight when they appear.
Structure and target measurement follow the same logic as Double Tops/Bottoms — just one more rejection at the level.
🐳 Pro Tip: A Triple Top can sometimes convert into a Descending Triangle (which you'll see in Lesson 8 on Continuation Patterns) if it breaks the neckline hard.
🔵 4. ROUNDING TOP & ROUNDING BOTTOM
The slowest, quietest reversal pattern — and often the cleanest when confirmed.
Rounding Bottom (Bullish, aka "Saucer"): a smooth, arc-shaped bottom. Sellers slowly lose control, buyers slowly take over. When the pattern completes and breaks the neckline, the ensuing rally can be powerful.
Rounding Top: mirror image at a market top. Slow distribution, then a decisive break down.
🐳 Pro Tip: Rounding patterns are often overlooked because they take time to form, but they can provide cleaner structural context when confirmed.
🔵 5. HOW TO TRADE ANY REVERSAL PATTERN
The universal 4-step process:
Identify the pattern as it develops — after the head forms (for H&S), or after the second peak/trough (for Doubles)
Draw the neckline connecting the reaction points
Wait for a close beyond the neckline — the pattern is not confirmed until then
Choose your entry style — see below
Entry styles:
Aggressive traders may enter on a decisive close beyond the neckline.
Conservative traders often wait for a retest of the neckline before entering.
Stop loss: just beyond the pattern's extreme (below the head in this Inverted H&S example).
Reward zone: once the breakout is confirmed, price can run well beyond the neckline — the chart above shows a real Inverted H&S at the 2022 BTC bottom, where the valid breakout above the neckline was followed by a multi-month rally.
🔵 6. COMMON BEGINNER MISTAKES
Trading the pattern before the neckline breaks (anticipation)
Ignoring the higher-timeframe trend — a bearish reversal pattern inside a stronger uptrend can often fail
Confusing a Double Top with a healthy pullback in an uptrend
Not measuring the target and holding trades without a plan
Trading small chart patterns on 1m or 5m — they can be less reliable there
Entering without deciding whether you're playing the break or the retest
🔵 7. YOUR REVERSAL PATTERN FRAMEWORK
Before acting on any reversal pattern, ask:
Is the pattern at the end of an extended trend?
Has the neckline been broken with a body close and follow-through?
Where is the projected target — and does it justify the risk?
Does the higher timeframe agree with the reversal?
🔵 QUICK SELF-CHECK
Identify a Head & Shoulders vs an Inverted H&S
Draw a neckline on any Double Top or Bottom
Measure a target from the pattern's height
Explain why Rounding patterns take longer but can produce cleaner structural moves
Choose your entry style — break vs retest — and defend the choice
🔵 WHAT IS NEXT
Lesson 8 — Continuation Chart Patterns: reversal patterns can mark the end of trends. Continuation patterns can help traders structure trend-following entries with clearer context. We will cover Flags, Pennants, Triangles (Symmetric / Ascending / Descending), Rectangles, and Wedges.
Drop a comment: which reversal pattern do you find easiest to identify — Head & Shoulders, Double Top, or Rounding?
Full Trading Roadmap | Classical TA Course
Trading Roadmap | Classical TA · Lesson 01 — Mastering the Chart
Trading Roadmap | Classical TA · Lesson 02 — Mastering Trends
Trading Roadmap | Classical TA · Lesson 03 — Support & Resistance
Trading Roadmap | Classical TA · Lesson 04 — Price Channels
Trading Roadmap | Classical TA · Lesson 05 — Single Candle Patterns
Trading Roadmap | Classical TA · Lesson 06 — Multi-Candle Patterns
Best Regards, BigBeluga 🐳  Education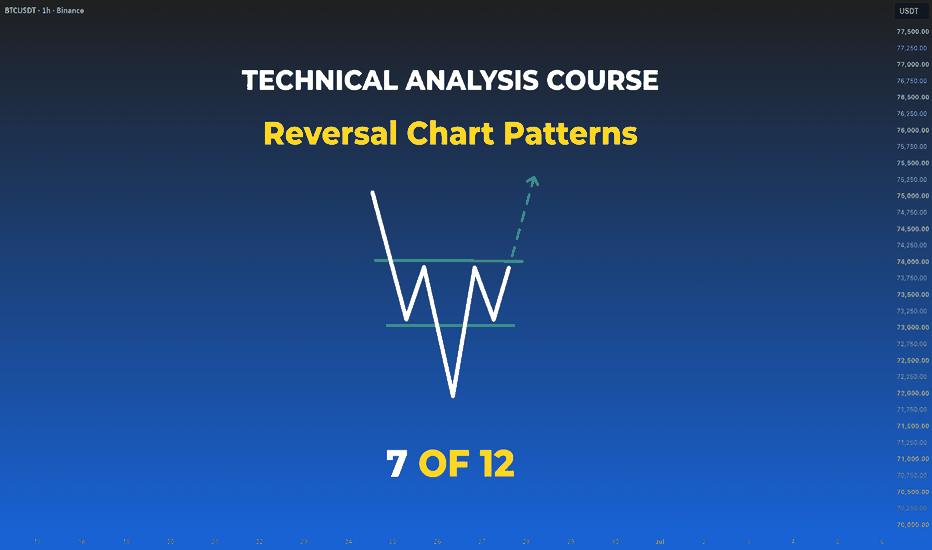
 Long
Long
Ethereum breaks $1,670 and 20 MA on a potential double bottomCRYPTOCAP:ETH just reclaimed $1,670 and the 20-day - double bottom setting up?
First low printed at 1,510 in mid-June, second at 1,505 late June. That second low briefly took out the first and immediately snapped back - that's a textbook bear trap.
The neckline sits at 1,848, and this level is stacked: it's the swing high between the two lows, it's the old February–March support that's now flipped to resistance, and the 50-day MA is parked right there at 1,836. Triple confluence. This is THE level.
Here's the part most people get wrong: right now there is no pattern - there's a candidate.
Price is chopping around 1,700, and the setup only triggers on a daily close above 1,848 with real volume behind it. Most "double bottoms" you spot in real time are just the market bouncing twice on its way lower. Front-running the confirmation is gambling, not trading.
Yesterday's candle ripped almost 6% on slightly above-average volume - promising, but not proof.
If we get a confirmed breakout, the measured move is straightforward: ~340 points of pattern height projected from the neckline puts the target zone at 2,190–2,215. Heads up though - the declining 150 EMA sits at 2,142, right at the front door of that zone, so expect a fight there. And keep the bigger picture honest: two and a half weeks between the lows makes this an intermediate reversal, not a trend change.
Flip side: a third rejection at 1,835–1,848 followed by a rollover - and especially a break below 1,505 - opens the trapdoor. Everyone who bought the lows gets caught, and it gets ugly fast.
Bottom line: above 1,848 on volume, bulls have a setup targeting ~2,200. Below 1,500, the thesis is dead. Until one of those resolves - patience.
Not financial advice. Long 
 Long
Long
$BTCUSD Double BottomBTCUSD is currently trading on the 1D timeframe and the chart highlights a Double Bottom reversal pattern.
The structure shows two swing lows forming near the 58,000–60,000 support area (Bottom 1 and Bottom 2), while the neckline is positioned around 83,500–84,000, which acts as the primary resistance level.
At the moment, price remains in the lower part of the pattern near the second bottom, suggesting that buyers are attempting to defend the major support zone. A move above the neckline could confirm the pattern, while price remaining below it means the reversal is not yet confirmed.
Key Levels
Support: 58,000–60,000
Resistance / Neckline: 83,500–84,000
Confirmation Level: A sustained breakout and close above 84,000 could confirm the Double Bottom pattern.
Projected Target: Approximately 110,000, representing a potential move of roughly 30% from the breakout level if the pattern is confirmed.
If price fails to hold the 58,000 support area, the bullish structure may become invalid, making this level important to monitor.
This analysis is for educational purposes only. Watch for confirmation before considering any directional bias, as price action could change if key levels fail to hold.  Long
Long
 Long
Long
$BTCUSD Double BottomBTCUSD on the 1H timeframe is showing a Double Bottom formation after a strong decline. The chart highlights two similar swing lows near the 58,000–58,400 area, suggesting that buyers are attempting to defend this support zone.
The current price is trading around 59,800, while the neckline resistance is located near 60,200. A sustained move above this resistance could serve as the breakout confirmation for the pattern.
If the breakout is confirmed, the measured move shown on the chart projects a target near 62,278, representing an approximate 3.5–4% upside from the breakout region.
The setup could become invalid if price fails to hold the 58,000 support area and breaks below the recent lows, which would weaken the bullish structure. As always, watch for confirmation before considering the pattern complete. This analysis is for educational purposes and not financial advice.  Long
Long
BTCUSD: Double Bottom Support triggers projected rally to FVGTechnical Elements & Key Levels
1. The Wedge Structure & Breakout
Wedge Pattern: From February to May, the price traded within an ascending broadening wedge or large channel, marked by two white, diverging Trendlines.
Breakout: In early June, a sharp downward move forced a clean "Breakout" (technically a breakdown) below the lower supporting trendline.
2. Key Support and Resistance Zones
Double Bottom Support ( ~$60,000 - $61,500): The bottom green horizontal block indicates a strong historical demand zone. Price recently tapped this level in early June, creating a double-bottom structure that halted the aggressive post-breakout sell-off.
SBR (Support Becomes Resistance) Zone (~$64,000 - $66,000): The middle green horizontal block represents a previous major support level that price is currently testing from below.
HTF FVG (High Time Frame Fair Value Gap) Resistance Zone (~$71,500 - $73,000): The top pinkish-purple horizontal block outlines a premium structural imbalance acting as the ultimate upside target and a heavy resistance zone.
Projected Price Path (The Blue Arrow Forecast)
The chart outlines a specific path of interest for the remainder of June and heading into July:
Point of Interest: The price is expected to pull back slightly from its current position around $64,182 to a dashed "Point of interest" line near $62,500, aligning with a local ascending support line.
SBR Retest: A successful bounce from that point is projected to push the price back up to test the upper boundary of the SBR zone near $66,000.
The Rally to FVG: If buyers clear the SBR zone, the blue projection arrow shows a strong, direct continuation upward to tap into the HTF FVG works as Resistance zone near the $72,500 level. Long 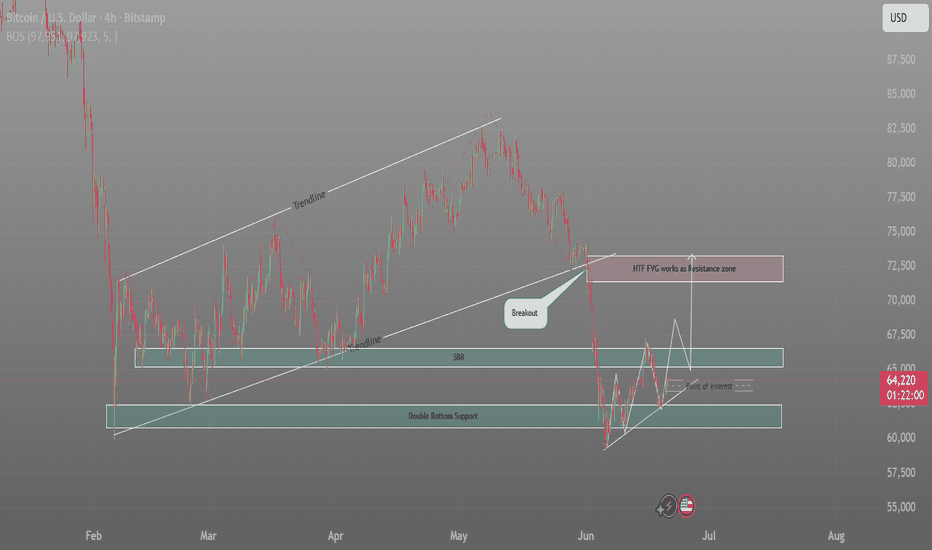
Long 
 Long
Long
Long 
 Long
Long
 Long
Long