Long
Long
 Short
Short
BTCUSD bottom is not in, but we are closeBITSTAMP:BTCUSD to all the bulls saying the bottom is already in.
no. too soon. sorry for saying so.
History shows us that we will have to touch 2.618 of fib first and a good drop below the 200SMA.
2.618 of fib is 52,413$ and 200SMA is currently at 59,906$.
50-55k perhaps? we will see what future will show us.
I already started buying (dollar cost averaging) and staking my assets. I'd definitely recommend COINBASE:SOLUSD for the % APY in return if you're new to crypto. The closer to 2.618 the more I will accumulate.
1. Yes, you won't make huge profits in the upcoming months this way, but by next bull run you definitely will.
2. Yes, RSI already shown oversold on weekly, but even if it does, BITSTAMP:BTCUSD can still drop lower (this happened in a cycle before).
3. Yes, MACD is about to show a bullish crossover on the weekly, but I still think that the fib 2.618 + 200SMA combination is the most accurate when it comes to determining the actual BITSTAMP:BTCUSD bottom.
This is not financial advice. I'm just sharing my plan for the upcoming months and my point of view on this. With diamond hands you will always win.
I'm saving my idea here to have a look at it again and learn from it. Support my idea if you like it!:) Aave and Aave V4Several assets in Aave V4 reportedly hit capacity, and the team raised deposit limits to absorb more liquidity, which is a bullish signal for the protocol’s usage.
What Aave V4 changes
Aave V4 uses a Hub & Spoke architecture, where a central Liquidity Hub manages shared liquidity while modular Spokes handle specific markets and risk rules. This is important because it can reduce liquidity fragmentation and let Aave add new markets without forcing users to migrate funds.
Aave v4 - Hub & Spoke model.
Source: aave.com
Aave also says V4 introduces a redesigned liquidation engine with a target health factor at the Spoke level, which is meant to avoid over-liquidation and improve capital efficiency. In plain English, the design is trying to make the system more flexible while keeping risk more contained.
Why price can rise
When a major DeFi lending platform ships a meaningful architecture upgrade, traders often treat that as a sign of future growth in total value locked, borrowing activity, and token relevance.
Technical setup and reversal logic
Sergio Richi (AAVE 12H)
Source:
From a technical-analysis perspective, a reversal is usually more credible when price stops making lower lows and starts breaking above prior swing highs on rising volume. For AAVE, the recent reaction around the V4 cap news suggests the market was already weak, then got a catalyst that helped it bounce.
According to Elliott Wave theory, we're overdue for a correction, and the Aave v4 update could be the catalyst we need to drive growth even in this down market. Right now, nobody's buying crypto-everyone's expecting further declines. But that's actually good news for us. When short traders start getting liquidated, it'll be way easier to pump up the price.
I've set a solid target of $152 for the upside move. That's just slightly below the 38.2% Fibonacci level, which lines up perfectly with what the Elliott Wave Absolute indicator on TradingView is showing.
Sergio Richi (Aave 1D)
Source:
Sergio Richi (Aave 1W)
Source:
Like I always say, this isn't financial advice-you've gotta make your own calls. One more thing: don't go overboard with your position sizing.
You don't want to blow up your account trying to get rich quick.  Long
Long
2026 is year when great opportunities will open up anew butMany people do not know that Bitcoin follows a classic 4-year economic cycle.
Understanding this, you can buy BTC near the bottom and sell near the top.
Every cycle i increase my capital through BTC, the period 23-25 was excellent for this asset, i trusted my forecast
(i leave it in attached articles at the bottom of this post) and during this period i earned money for my apartment thanks to Bitcoin..
2026 will provide excellent opportunities for those who want to enter the market correctly.
In general, BINANCE:BTCUSDT BTC has already fallen by -50% from the highs and already looks interesting for investing until 2030.
Based on the monthly RSI on the chart, it is already clear that from the current prices, BTC will began a new growth cycle for 3 years.
To ensure this post is always relevant, i'm attaching a monthly (!) timeframe. Each candle represents one month.
From this distance, you won't see market noise.
And if you overlay a sine wave on a logarithmic chart, you'll see that Bitcoin's cycle changes every 4 years ( 1 year down, 3 up).
Short-term fluctuations are possible; BTC is volatile, which is normal for young assets.
I have doubts that the bear market is already over.
The situation around Iran is growing every week and so far there is no reason why the conflict should be resolved quickly.
It is also clear from technical analysis that the asset has already fallen out of the long-term ascending channel, so it will no longer be possible to accurately determine the bottom.
Therefore, i am not the only one who expects that BTC may still fall, but not much.
The graph shows that the maximum pain level is at 36000-49000$.
Long-term moving averages also pass through these levels.
Therefore, the best strategy is to buy “ladder” in equal shares in the above range.
It's also important to remember that each bearish cycle lasts 365-396 days. Considering that the downward cycle began in November 2025, the rise will begin around the beginning of autumn.
The final growth target by the end of 2030 is approximately 250,000-$300,000$.
its possible
Friends, in less than half a year the new Bitcoin season will begin.’
Don't waste your money on altcoins that are always falling, invest in the right assets!
In my Tradingview profile you will find interesting ideas not only on cryptocurrency!  Long
Long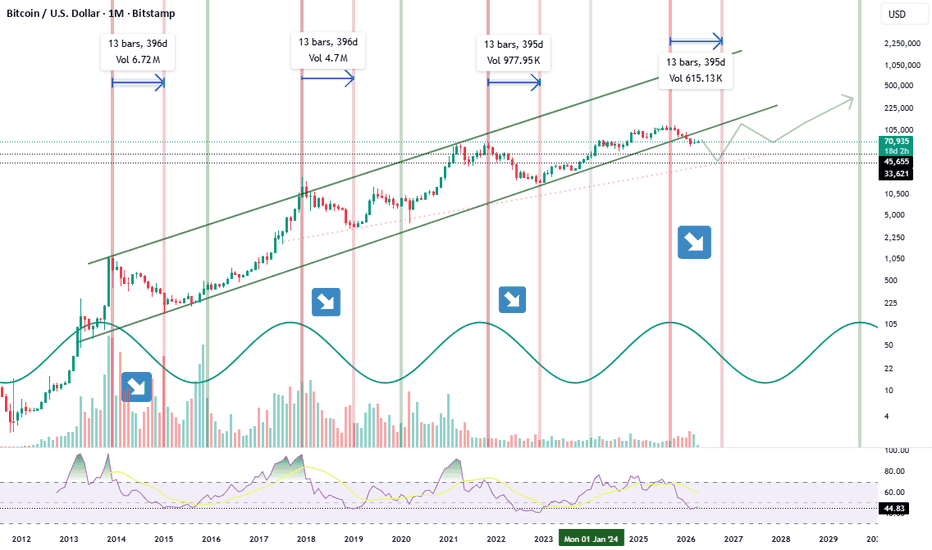
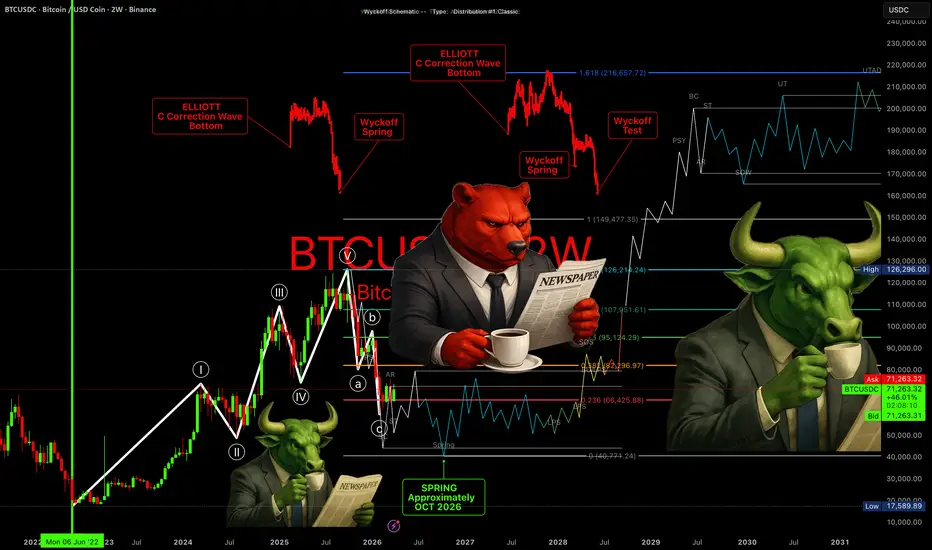
Bridging Elliott Wave Theory and Wyckoff Accumulation:www.tradingview.com
Bridging Elliott Wave Theory and Wyckoff Accumulation: Identifying the Common Gap
When attempting to reconcile Elliott Wave Theory with the classic Wyckoff Accumulation model, a notable and underexplored gap emerges between the two frameworks — one that carries significant practical implications for market analysts and traders alike.
Elliott Wave Theory is, at its core, relatively straightforward in its application: price moves in five waves from lower lows to higher highs in the direction of the prevailing trend, provided that the wave structure and its governing rules remain intact. Once that structure is violated, a corrective sequence is assumed to follow, typically manifesting as an A-B-C correction against the prior trend.
When this framework is overlaid with Wyckoff Accumulation Theory, a compelling parallel emerges: the C wave of the Elliott correction aligns closely with the Selling Climax (SC) phase identified in Wyckoff's accumulation schematic. This correspondence suggests that both models are, at least in part, describing the same underlying market phenomenon through different analytical lenses.
However, it is precisely at this point of convergence that the gap between the two theories becomes most apparent. Wyckoff's model recognizes two common accumulation scenarios: one in which the Spring represents the definitive price low, and another in which an initial test of the Spring fails, giving way to a subsequent and lower price point before accumulation is complete. This secondary low — and the price behavior surrounding it — represents a critical transitional phase that Elliott Wave Theory does not explicitly address.
The ambiguous rally that frequently emerges following the conclusion of the C wave occupies this undefined space. Often characterized by a brief and unconvincing surge in price, this move is technically consistent with what Wyckoff identifies as a failed Secondary Test, yet it lacks formal classification within the Elliott framework. As a result, it is frequently misinterpreted by market participants as the onset of a new bull market, when in reality, price discovery in the downside direction remains incomplete, and the true bottom has yet to be established.
This misidentification is not merely an academic concern. Traders who conflate this transient rally with the beginning of a sustained uptrend risk premature positioning, exposing themselves to the continuation of the broader corrective move. Recognizing this gap — and understanding that it represents a zone of structural ambiguity between two otherwise robust theoretical models — is essential for more accurate market cycle analysis.
Further sections may explore how this gap can be quantified, how volume analysis may provide supplementary confirmation, and how combining both frameworks can lead to a more comprehensive model of market bottoming behavior.
Secondary Test (ST) in Wyckoff Theory:
In Wyckoff Theory, the Secondary Test (ST) is a price movement that revisits the area of the Selling Climax (SC) to test the balance between supply and demand at that level.
What It Does:
After the Selling Climax, the market rebounds to an Automatic Rally (AR). The Secondary Test then pulls price back down toward the SC level to check whether selling pressure has genuinely been exhausted.
What to Look For:
- Lower volume compared to the Selling Climax — this is a healthy sign
- Price holds above or near the SC low — confirming support
- If volume remains high and price breaks below the SC, it signals that supply is still dominant and a Spring or lower low may follow
Why It Matters:
The ST essentially acts as a validation checkpoint. It helps confirm whether the SC was a genuine exhaustion of selling or just a temporary pause.
In simple terms, it is the market "going back to check" if sellers are truly done. If they are, price stabilizes and accumulation continues. If they are not, the price makes another leg down.
This ties directly into the gap discussed earlier — a Failed Secondary Test is one of the key triggers that leads to the Spring scenario and the undefined rally zone where Elliott and Wyckoff diverge. Short 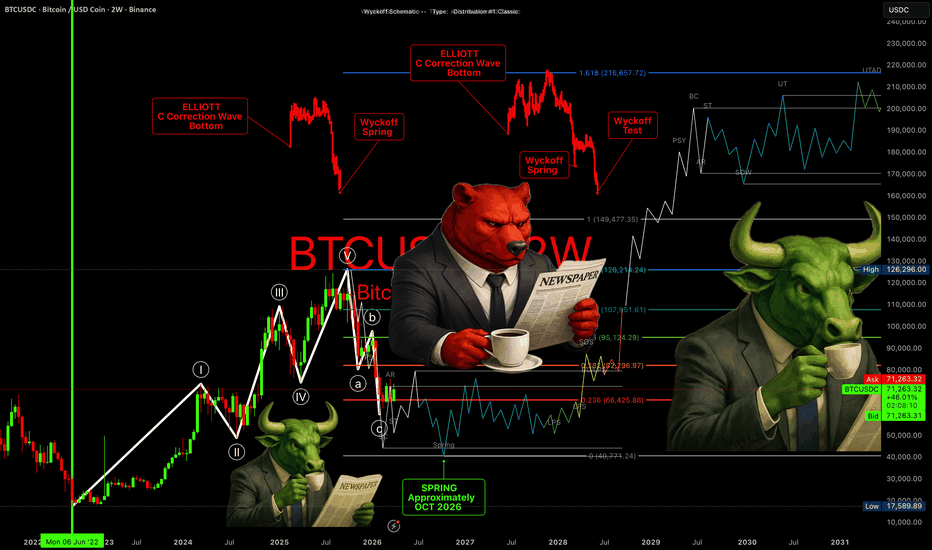
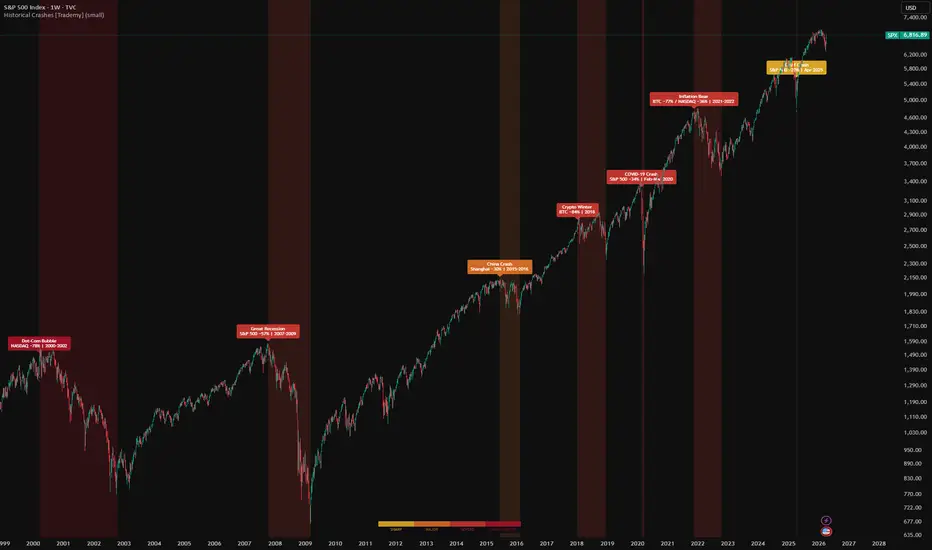
S&P 500 vs Gold — How Gold Performed During Every Major CrashEveryone says gold is a safe haven . But is it actually?
I mapped the Trademy Historical Crashes on both Gold TVC:GOLD and the S&P 500 TVC:SPX and compared them during every major crash. The results are more nuanced than "gold goes up when stocks go down."
Here's what actually happened:
2008 Great Recession
S&P 500: −57%
Gold: Initially dropped 28% as funds liquidated everything for cash. Then rallied over 100% from its crisis low by 2011, hitting $1,900/oz. The safe haven effect was real but it was delayed, not instant.
2020 COVID Crash
S&P 500: −34% in 33 days
Gold: Dipped briefly during the initial panic selling, then surged to a new all-time high of $2,070 by August 2020. The recovery was faster than 2008 because central banks cut rates to zero almost immediately.
2000 Dot-Com Bubble
S&P 500: −49%, NASDAQ: −78%
Gold: Actually fell about 8% during the crash period. This was the one time gold failed as a safe haven, sentiment in precious metals was terrible in the late 90s and early 2000s. However, gold started a multi-year rally in 2001 that didn't stop until 2011.
1987 Black Monday
S&P 500: −22% in one day
Gold: Spiked about 4% on crash day, then reversed and fell 6% the next day as investors sold gold for margin calls. The gold rally after Black Monday was brief and modest — not the massive safe haven move people assume.
2022 Inflation Bear Market
S&P 500: −25%, NASDAQ: −36%
Gold: Stayed relatively flat. Didn't crash with stocks, but didn't rally either. The rising interest rate environment kept gold suppressed even though stocks were falling. This broke the typical pattern.
2025 Tariff Crash
S&P 500: −20%
Gold: Surged to new all-time highs above $3,000. The safe haven effect worked perfectly this time, investors fled tariff uncertainty straight into gold.
The pattern: Gold doesn't always rally during crashes. It depends on WHY the crash is happening . During banking/systemic crises (2008) and geopolitical shocks (2025), gold works as a hedge. During rate-hiking environments (2022) and tech-specific busts (2000), it doesn't.
Load the Trademy Historical Crashes on both Gold and SPX side by side. The visual makes this comparison obvious.
What's your take, do you hold gold as a hedge or do you think it's overrated?  Education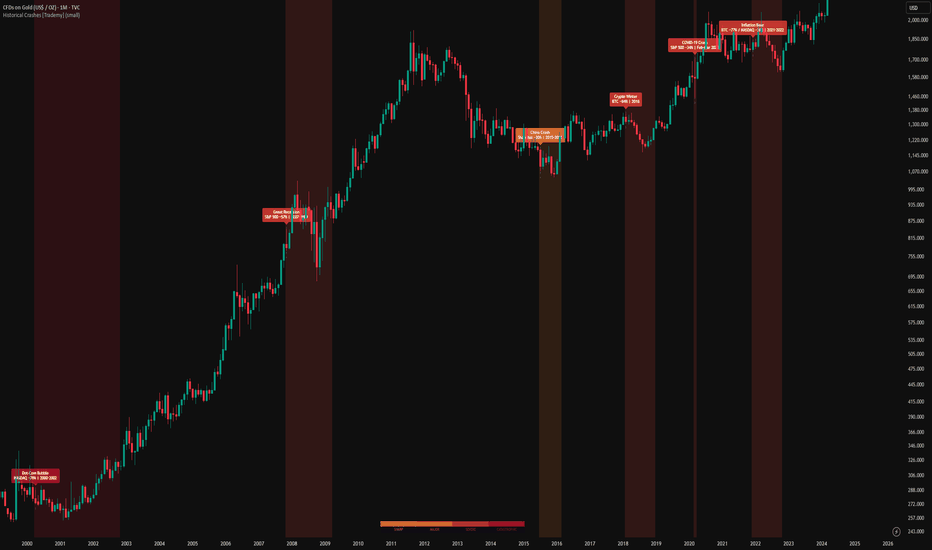
Expected breakthrough from TON or news bluff again? The key problem of TON as an asset is now in a long-term Bear market, which began in June 24, and the general negative background in the market is not at all conducive to a reversal upward
Previously there was a powerful narrative (Telegram + Web3) and there was a pump → then a long cooling
It's very similar to:
BINANCE:SOLUSDT SOL after 2021
BINANCE:ADAUSDT after 2021
BINANCE:DOTUSDT DOT after 2021
That is, there is a narrative, but the money has not yet been returned.
What the TON chart says (historical fact):
ATH: $8.27 (June 2024)
Current levels: $1.2–1.3
Drop by -60%...-85% from the high.
This is a classic trend break after hype + distribution.
Technical now:
70–77% of indicators are bearish
RSI ≈ neutral (not oversold, no strong rebound)
The price is in a long-term downward/sideways channel, but the trend has not reversed and this is important
Fundamental (what is the strength of TON)?
Here's where it gets interesting:
✅ Strengths:
1) Integration with Telegram (≈1 billion users)
2) Wallet directly in the application (+10% in staking on popular cryptocurrencies)
3) Ecosystem growth (payments, mini apps)
4) Real use-case (not just DeFi)
This is a huge plus - distribution > technology
❗️ But there are risks:
1)Addiction to Telegram and Pavel Durov
2) Regulatory risks (Europe is already pressing, the USA is ready)
3) Competition (Solana, Ethereum L2)
4) The token did not become a “must-have asset” even within telegrams. NFT gifts do not bring any practical benefit to the owners.
Forecast until 06/01/2026 (realistic)
The most likely scenario is: $1.5 – $2.5 (weak sideways growth with rebounds)
Bull scenario: $3–5 (if the crypto market is growing and Telegram is actively pushing TON - the least likely scenario.
Bear script: $0.8 – $1.2 if the market is weak or BYBIT:TONUSDT TON does not receive liquidity
My honest conclusion is that TON is now not a trend investment, but a speculative asset with a foundation.
There is no upward trend here, but a short-term jump could be strong if the stars align positively in the near future. In my channel you can find more interesting ideas! T

 Education
Bitcoin | The First Pullback Of The Next Bull Cycle Is Coming Save this,
Markets are driven by multiple reasons that are difficult to quantify and that's including human emotions, fundamentals, technical analysis or any other unknown reasons. price never moves in a straight line. in fact it is constantly cycling up and down, while price cycles are random as they switch between trending, reversing and consolidating in an unpredictable sequence. nonetheless, you can still find some predictable patterns within those random movements.
The fact that repeated patterns often develop, within currency price movements, is the fundamental basis of technical analysis and technical trading methods. one pattern that is very important to understand and learn is the basic trading cycle. by knowing how the trading cycle works and often develops, it becomes possible to recognize where the price movement is within the cycle. this, in turn, can guide trading strategy by providing useful signposts relating to when and where trade entry and exit points should be set. an understanding of the price cycle sequence will also help improve the use of trading tools, such as indicators and oscillators.
The trading cycle also forms the basis for a number of more complex price pattern analysis theories, like, The Elliott wave pattern and Harmonic wave patterns.
In the chart above we have the Elliott wave pattern, we've been in an upward or uptrend channel for a year forming a higher highs and higher lows. and this uptrend channel made of five smaller waves, and as Elliot said that, the first 5 waves serves as a clue in preparation for the first pullback in the opposite direction. for price to cycle higher, you need a swing low before it moves to create a swing high.
So what is a pullback :
market or price action "Pullback", by definition, happens when price moves at least bar against the dominant trend direction. a pullback is a price movement that moves in the opposite direction of the trend, but it is only temporarily price movement before it resumes back into the maim market direction.
Pullbacks are sometimes referred to as price retracements or corrections. some may even just call it a "Dip". it doesn't matter what you call it as long as the temporary counter trend movement resumes in the market direction later, and it does so by breaking beyond the recent price extreme.
As Elliot stated in his theory " Action is followed by reaction "
We might have An ABC zigzag corrective pattern in This coming pullback, cuz this is the most common correction,
A Zigzag is a sharp, three wave corrective pattern, labeled A-B-C. wave A and wave C of a zigzag correction always consist of five subwaves. in contrast wave B consists of only three sabwaves.
The length of of wave C is likely to be 1 times wave A, or 1.618 times wave A, or 2.618 times wave A, these are Fibonacci extension numbers.
Fibonacci and Elliott wave theory are commonly used together. the Elliott wave has time and time again proven to be remarkably effective in forecasting the market, and Fibonacci levels play an important role in its accuracy.
According to the Elliott wave theory, catching first pullback in the impulse wave happens to be the most profitable setup since wave 3 is The mother " the longest " of all waves. on the other hand, 5 waves serves as a clue in preparation for the first pullback in the opposite direction, and that is wave C in the corrective wave sequence.
On the chart above i sat the levels were the price might go , along with the targets. the first price target gonna be at (113783).
" When you identify an uptrend and decide to buy, you have to decide whether to buy immediately or wait for the dip". Alexander Elder.
Short 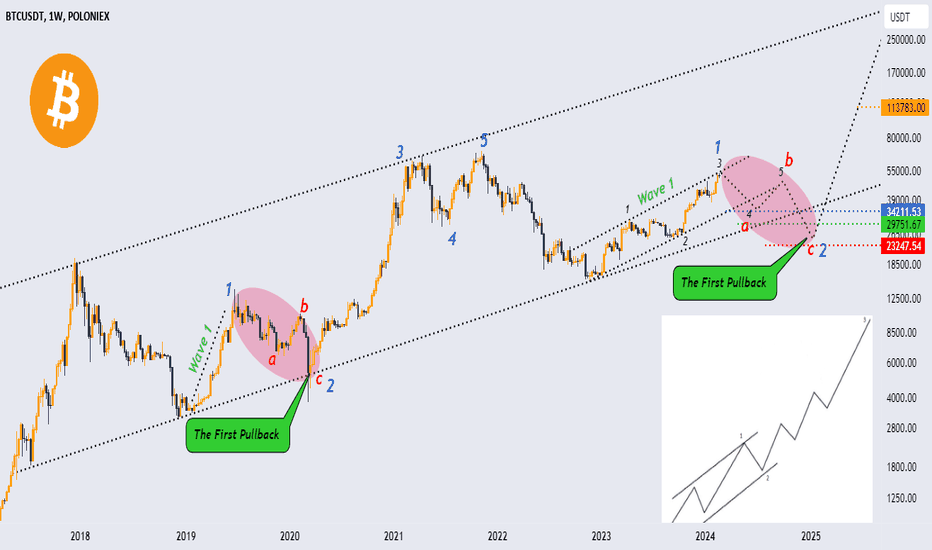
 Short
Short Short
Short


 Short
Short