XLY Breakout Front Run Swing TradeXLY continues to trade in a range below ATHs. With NASDAQ:AMZN as a primary driver for potential continued bullish momentum.
Stop is below higher pivot low
T1 is new ATHs
T2 is 139
T3 is 156
Final target is 197
This is a long term swing trade and will be managed accordingly
ETF
ARKK ETF: Trapped in a Pinning Regime? Title: ARKK ETF: Trapped in a Pinning Regime? Quant & Technical Deep Dive 📉🤖
🧠 Fundamental Overview:
The ARK Innovation ETF (ARKK), managed by Cathie Wood, is a fund focused on disruptive innovation characterized by a high-risk/high-volatility profile and a long-term approach.
The current price hovers around $75 - $76.
Year-to-date, the fund has registered a moderate return of ~7.38% (significantly underperforming traditional indices), with a 1-year cumulative return of approximately 5.43%.
Scapegoats, Leverage & Block Trades: What’s Driving the BounceWe mentioned that we were set up perfectly for a technical bounce, here it is!!!
Today’s rip looks much more like the air coming out of a crowded short trade than fresh fundamental accumulation.
Once the short covering mechanism exhausts itself over the next session or two, we’ll see if real buy & hold institutional bids step in to build a structural floor.
Real institutional long only money rarely buys aggressively on 1st day of an unwind.
ATM, discretionary long cap is CHILLING, letting sh
XLI | Continued growth ETF- Timeframe: Weekly
- Trade type: Buy stop order
- Price: 182.51
- Take Profit: Open
- Stop Loss: 177.60 (-2.70 %)
Idea: Long on a breakout above last week's high - bullish momentum continuation.
Entry: Buy stop above last week’s high.
Stop-loss: Below the low of the same candle.
If the weekly candle closes below this level, the trade is invalidated.
Take Profit: Trailing stop following the lows of new weekly candles.
UNG | The time to go long has come- Timeframe: Weekly
- Trade type: Buy stop order
- Price: 10.69
- Take Profit: Open
- Stop Loss: 10.18 (-4.70 %)
Idea: Long on a breakout above last week's high - bullish momentum continuation.
Entry: Buy stop above last week’s high.
Stop-loss: Below the low of the same candle.
If the weekly candle closes below this level, the trade is invalidated.
Take Profit: Trailing stop following the lows of new weekly candles.
Why Has the Market Pulled Back Without a VIX Spike?Controlled Liquidation vs. Panic Selling
The VIX measures demand for 30 day SPCFD:SPX index options (primarily downside put buying for protection). When the market drops slowly or systematically, institutions don't panic buy short term index puts. Instead, they orderly trim long equities or use systematic unwinding. A slow bleed doesn't inflate option premiums the way a fast gap down does.
Rotations & Single-Stock Dispersion
Index volatility can stay muted if sell offs are rotational rather t
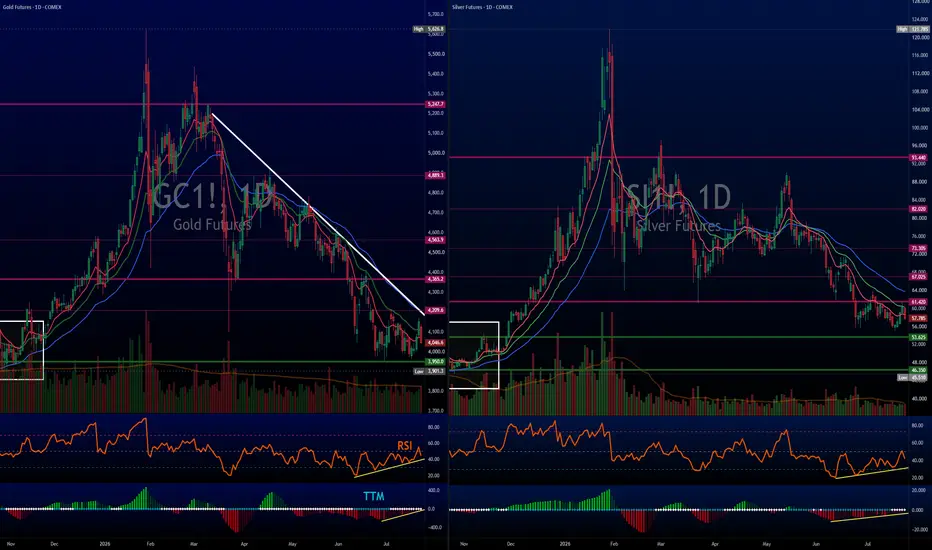
Short Term Gold Rally over?RSI and TTM are looking better while price continues to sag. This is a classic bullish divergence in a strong down trend. In other words, selling momentum is slowing down—the bears are running out of aggressive velocity.
But price requires capital inflows to actually turn. Until price breaks above that daily white descending trendline on Gold, momentum is just an early warning system, not a buy signal.
Do Interest Rates Have an Effect?
Opportunity Cost:
Neither Gold nor Silver pays a yield or
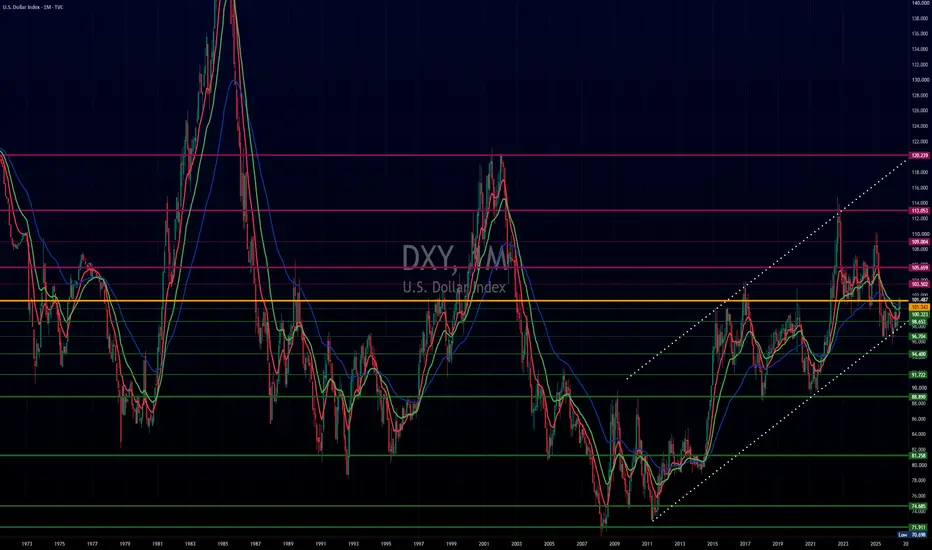
DXY: The 101 Macro Titan LevelWhen you zoom out to a multi decade monthly perspective, mapping the dollar becomes a relative game. Unlike yields, TVC:DXY isn't just reacting to domestic policy, it reflects a relative basket against the Euro, Yen, and Sterling.
Right now, price is battling at the single most important structural pivot on the entire monthly chart: the orange horizontal line around 101.
Why This Level Holds Multi Decade Weight
1) Polarity Shift (Resistance Turned Support Turned Resistance):
Late 1980s: Fo
INDY | The time to go long has come- Timeframe: Weekly
- Trade type: Buy stop order
- Price: 43.49
- Take Profit: Open
- Stop Loss: 42.71 (-1.80 %)
Idea: Long on a breakout above last week's high - bullish momentum continuation.
Entry: Buy stop above last week’s high.
Stop-loss: Below the low of the same candle.
If the weekly candle closes below this level, the trade is invalidated.
Take Profit: Trailing stop following the lows of new weekly candles.
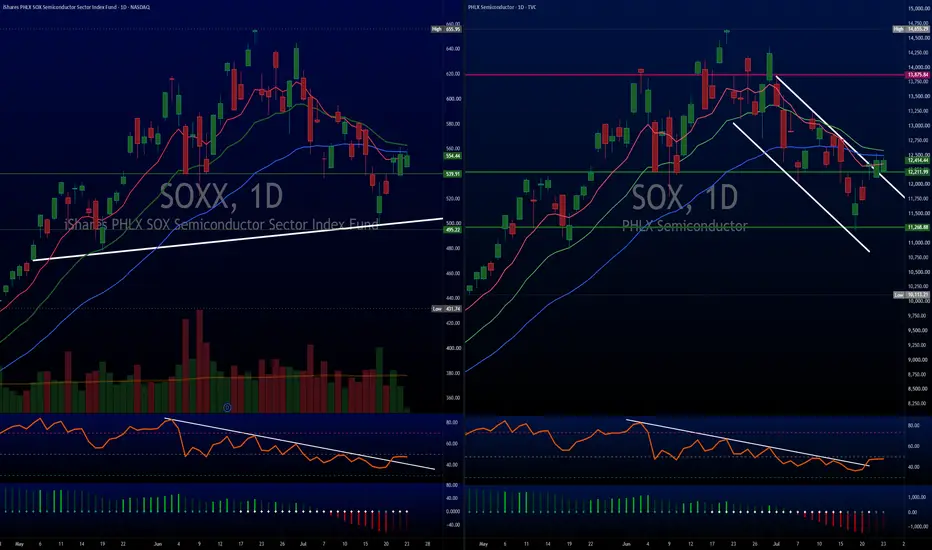
$SOXX Attempting a ComebackOptions Expiration Distortion
Volume is key. It’s a metric we give a lot of attention to.
We see a massive volume spike on Friday the 17th. However, it’s a classic quarterly/monthly options expiration noise. Relying on it as pure institutional accumulation is risky when market makers were just rebalancing and rolling delta exposure.
Volume Divergence
The lightened volume bars over the last few sessions after the 17th show buyers aren't aggressively pushing this bounce. It looks more like a low
QQQ Dip Buying Opportunity | Eyes on 723 & 735QQQ is approaching a high-conviction support zone between 690 and 670, making this an area worth watching for a potential long opportunity.
📈 Trade Setup
Buy Zone: 690–670
Stop Loss: 666
Target 1: 720–723
Target 2: 735
Extended Target: Open if bullish momentum remains strong.
🔍 Technical Outlook
The current pullback is bringing QQQ into a key support region where buyers have previously shown interest. If price holds this zone and confirms a bullish reversal, it could offer an attractive risk-
$PSCF: Small Banks, Big Breakout! This HVF Funnel is Primed!NASDAQ:PSCF (SmallCap Financials) is carving out a textbook Hunt Volatility Funnel after a strong rally in late 2025. We have the required 3 alternating touches, and volatility is now at an extreme 'squeeze'.
@TheCryptoSniper
The Catalyst: Banks are entering a 'sweeter spot' in 2026 with falling benchmark rates and a steepening yield curve.
Technical Trigger: Looking for a daily close above High 3 with a volume spike.
Risk Management: Standard HVF stop-loss is placed vertically below the ent
The Larger Pattern Unfolding on Bitcoin and Ethereum!A lot of traders are focused on short term noise, but zooming out shows a clear story taking shape on Bitcoin!
On the 4Hr chart, we see a small inverse head and shoulders pattern formed. Need confirm for the breakout, we believe it will happen. However, the true story is the much larger inverse head and shoulders structure taking shape on the daily view!
In another post, we discussed how CRYPTOCAP:BTC often needs to print a quick lower low to sweep liquidity before a real bottom can form. Tha
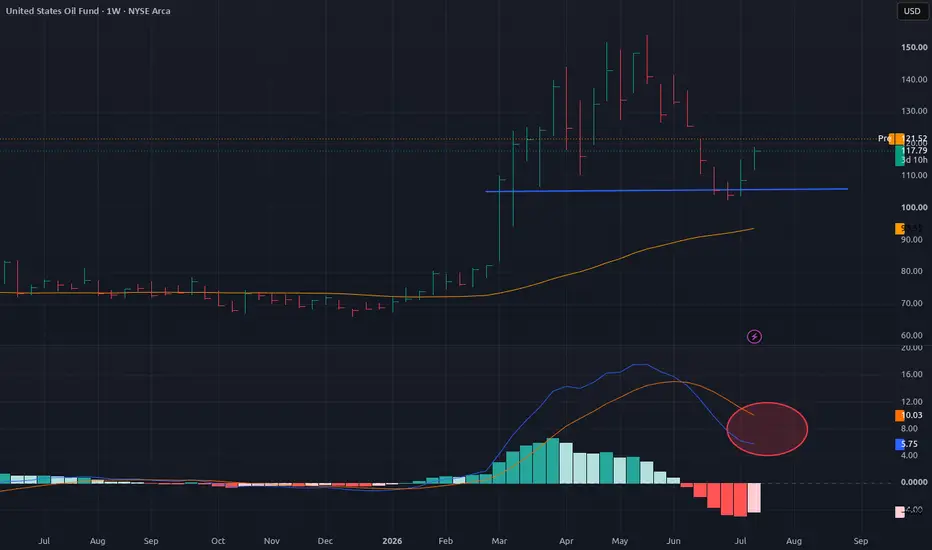
USO long-term TAYou have to be a little bit cautious about oil trade, the long-term trend is still there yes, but the current momentum behind this price move is not as strong as it used to be, which is a slight problem, the current ongoing actions between US and Iran have not returned long-term holders in place, at least yet. While the trend hasn't been technically broken but we need to approach this recovery with caution.
ETH long-term TAEthereum remains bearish on long-term on weekly and even so on monthly time-frame. There have been some pumps and recoveries but all of them just temporary. The weekly volume and momentum remain bearish for the last 6-8 months. Though, it's worth to notice a slight recovery from selling pressure in the last couple of months and currently it's doing a little bit better than BTC and may be a candidate for a faster recovery but it's yet has to be confirmed with the volume and momentum. For now the
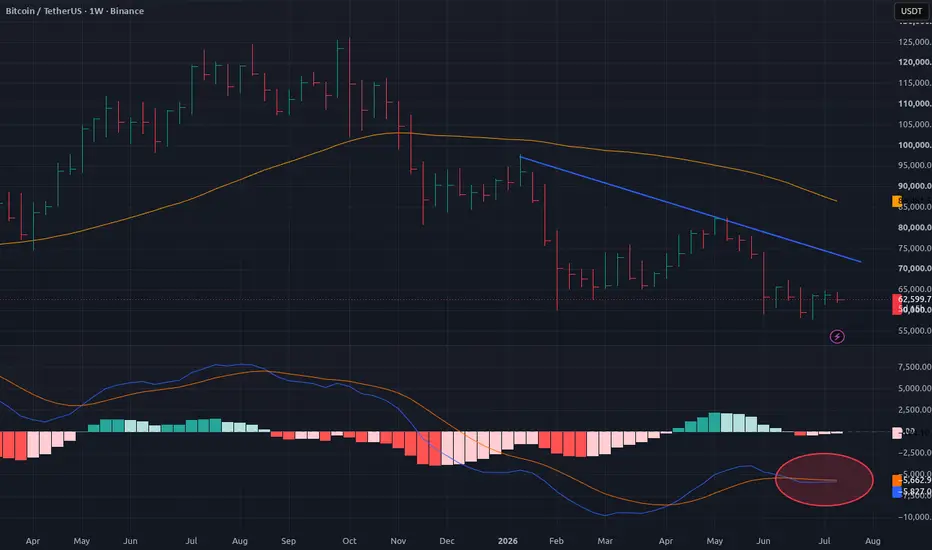
BTC long-term TANo matter how many trend lines you draw but Bitcoin remains in a bearish trend at least for now. We've been calling it bearish since the end of last year and there has not been any change in direction ever since. It's worth to notice that selling pressure has reduced at some point yes, which is a good sign for a possible recovery in the near future but as of yet it's difficult to call for any recovery while the long-term volume and momentum remain bearish.
DRAM long-term TARoundhill memory has been beaten a lot recently due to the sharp chips selloff but there's no need to panic as of yet, the trend is not strictly bearish. There's a momentum support test on weekly, the price is currently correcting and we have to wait for the correction to finish to take further action.
Bitcoin's Next Big Test: Can a Break Above $64,658?Bitcoin has gained approximately 10% so far in July, reflecting strong short-term bullish momentum. However, the next major challenge lies at the $64,658 resistance level. Based on the current price action, the probability of a breakout above this resistance appears relatively high, making a bullish breakout candle a likely scenario.
If Bitcoin successfully breaks and holds above $64,658, it could pave the way for a stronger upward trend in the coming sessions.
Technical indicators also suppor
Bitcoin - Will Bitcoin Continue to Rise?!Bitcoin is located between the EMA50 and EMA200 on the four-hour timeframe and has reached an important resistance level. If this resistance area is broken or maintained, we will see a continuation of the upward trend or a return to the downward trend in Bitcoin.
However, it should be noted that in the event of each of the scenarios, there are supply and demand zones above and below the current price where you can sell or buy Bitcoin.
It should be noted that there is a possibility of heavy flu
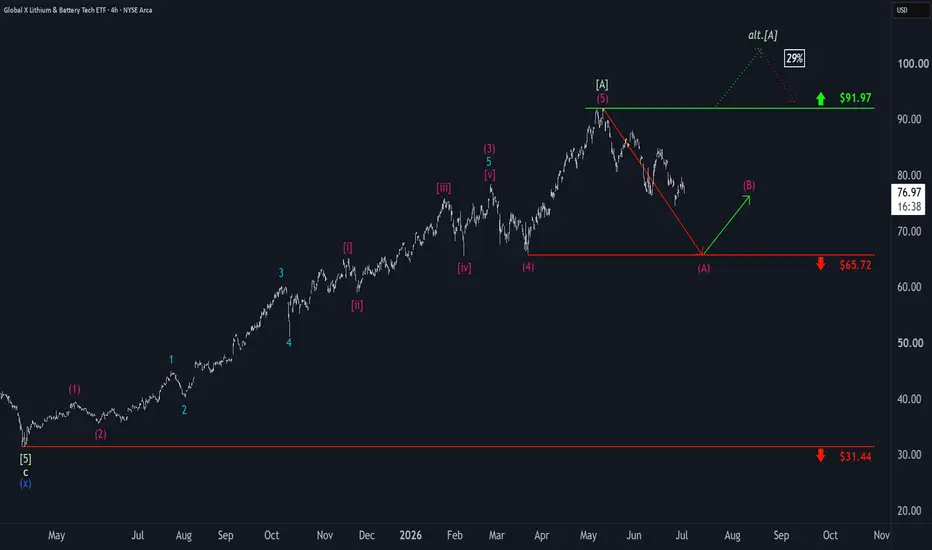
Global X Lithium: Swinging WildlyThe Global X Lithium ETF has aborted another recovery attempt: First, it saw several days of gains before renewed setbacks intensified recently. Primarily, we expect further sell-offs in the near term, likely extending down to the support line at $65.72. Once this correction is complete, LIT should stage a rebound before resuming its downward trend. Alternatively, there is a chance that the price could rise soon and break above the resistance line at $91.97. This would indicate that the previous
TRMB: The Anatomy of a Textbook Capitulation BottomNFA - Opinion
We have been tracking the intense block box accumulation on Trimble Inc. NASDAQ:TRMB inside the orange box over the last several weeks, and the technical story playing out on the 4 hour chart is loud and clear.
After a heavy distribution phase off the low 70s, the stock dropped off a cliff into its recent 52 week low at $47.92. But it is the immediate follow through that signals a major structural shift in who owns these shares.
The Technical Blueprint
When a stock slides on c
Largest weekly BTC ETF outflows in history and only 5% lower...Continuation Acceleration Protocol (CAP) Status: Gate 1 regime test in progress. Monthly structure at a decision point.
The largest weekly BTC ETF outflow week on record just happened.
The result was a 5.09% move down.
That is the entire scoreboard. Maximum institutional selling pressure, historic in scale, and price barely moved off a level that has acted as monthly support before, with war fear headlines running at full volume the entire time.
Effort without result is information. If the l
Bitcoin - Is the Bitcoin decline over?!Bitcoin is below the EMA50 and EMA200 on the four-hour timeframe and is in its medium-term descending channel. Bitcoin’s upward correction towards the specified supply zone will provide us with its next selling opportunities.
It should be noted that there is a possibility of heavy fluctuations and shadows due to the movement of whales in the market and compliance with capital management in the cryptocurrency market will be more important. If the downward trend continues, we can buy within the de
PAVE | June, 2026 | Continued stock growth- Timeframe: Weekly
- Trade type: Buy stop order
- Price: 57.69
- Take Profit: Open
- Stop Loss: 55.20 (-4.30 %)
Idea: Long on a breakout above last week's high — bullish momentum continuation.
Entry: Buy stop above last week’s high.
Stop-loss: Below the low of the same candle.
If the weekly candle closes below this level, the trade is invalidated.
Take Profit: Trailing stop following the lows of new weekly candles.
Feel free to like and share your thoughts in the comments! ❤️