Long
Long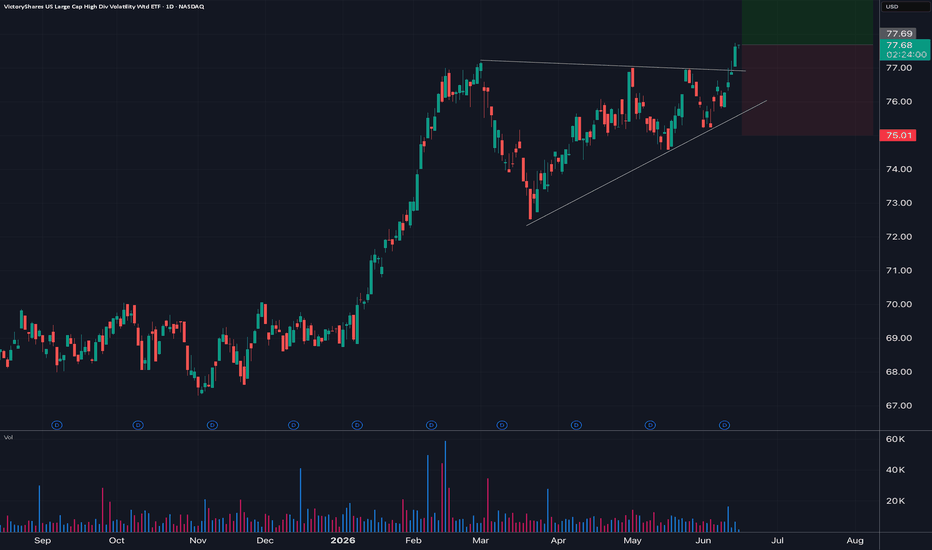
Who Is The Marginal Buyer of Bitcoin Now?ETF Flows vs. Perp Leverage: Who Is The Marginal Buyer of Bitcoin Now?
Most traders ask:
“Who is selling Bitcoin?”
But the better question is:
“Who is no longer buying?”
In 2024 and 2025, one of the strongest narratives behind BTC was institutional demand through spot ETFs.
This created a powerful and simple story:
new regulated vehicles, new capital, new marginal bid.
But market structure changes when that bid slows down.
When ETF inflows are strong, spot demand can absorb volatility.
When ETF flows turn negative, the market becomes much more dependent on derivatives positioning.
That is where perpetual futures matter.
Perps Are Not Patient Capital
Perp traders can create a lot of visible volume and short-term momentum.
But they are not the same as a long-term spot buyer.
When open interest rises, funding stays elevated, and price fails to move higher, the market becomes fragile.
Why?
Because leveraged longs are not patient capital.
They are conditional buyers.
If price moves against them, they do not always choose to sell.
Sometimes the exchange sells for them.
That is the difference between a correction and a liquidation cascade.
Why Bitcoin Can Drop Even When The Narrative Has Not Changed
This is also why Bitcoin can drop even when the long-term narrative has not changed.
The long-term holders may still believe.
Institutions may still be interested.
But if the marginal buyer disappears for a few weeks and leverage remains crowded, price can move violently lower.
In today’s Bitcoin market, price discovery is no longer only about crypto-native spot exchanges.
It is a triangle:
ETF flows
Perpetual futures leverage
Liquidity and forced liquidations
The transparent part is that we can actually observe much of this in real time:
ETF flows, open interest, funding, liquidation levels, exchange premiums, and volume distribution.
The uncomfortable part is that many traders still look only at the candle.
A candle tells you what happened.
Market structure tells you why it happened.
What To Ask During A Bitcoin Sell-Off
So when Bitcoin sells off, don’t ask only whether support held.
Ask:
Was there real spot demand?
Were ETF flows positive or negative?
Was open interest rising into weakness?
Was funding showing crowded positioning?
Did the move trigger forced selling?
Because the market is not moved by opinions.
It is moved by flows.
And in 2026, the most important question for Bitcoin may not be:
“Is the narrative bullish?”
It may be:
“Who is the marginal buyer right now?” BTC ETF Flows: The Signal Most Traders Ignore[BTC ETF Flows: The Signal Most Traders Ignore
Many Bitcoin traders focus only on price action.
They watch support, resistance, breakouts, moving averages, and momentum. All of that matters, but there is one important thing many traders still ignore:
ETF flows.
Bitcoin does not move only because of chart patterns. It also moves because of real demand. When large amounts of money enter spot Bitcoin ETFs, it can show that institutional demand is supporting the market. When money leaves those ETFs, it can show that big investors are becoming more cautious.
This does not mean ETF flows are a perfect buy or sell signal.
They are not.
But they can help us understand whether a Bitcoin move has real demand behind it or whether price is only moving because of short-term hype, leverage, or emotion.
Why ETF flows matter
If BTC is bouncing from support while ETF inflows are strong, that bounce may have better backing.
But if BTC is bouncing while ETF flows are weak or negative, I become more careful. The chart may look like it is recovering, but the demand side may not be strong enough yet.
That is where many traders get trapped.
They see a green candle and think the trend is back.
But a single candle is not demand.
Real demand usually needs follow-through.
How I use ETF flows
I do not use ETF flows alone.
I combine them with price structure.
For example, I ask:
1. Is BTC holding an important support zone?
2. Is price making higher lows or still making lower highs?
3. Are ETF flows supporting the move?
4. Is spot demand improving?
5. Is leverage too high?
6. Is the risk/reward still logical?
If price is rising but ETF demand is weak, I do not treat the move as fully confirmed.
If price is rising and ETF flows are improving, then the recovery has more credibility.
Simple lesson
Price action tells us what is happening on the chart.
ETF flows can help us understand whether real capital is supporting that move.
A healthy Bitcoin rally usually needs more than hype. It needs demand, structure, and follow-through.
That is why I prefer watching both:
Price structure + ETF flows
Not one without the other.
The main takeaway is simple:
Do not chase BTC only because it is bouncing.
Check whether the move is supported by real demand.
A strong chart with weak demand can still fail.
A strong chart with improving demand becomes more interesting.
Do you check Bitcoin ETF flows before trading BTC, or do you only focus on the chart?
Share your view below. I think this is one signal many traders ignore until the market teaches them the hard way.  Education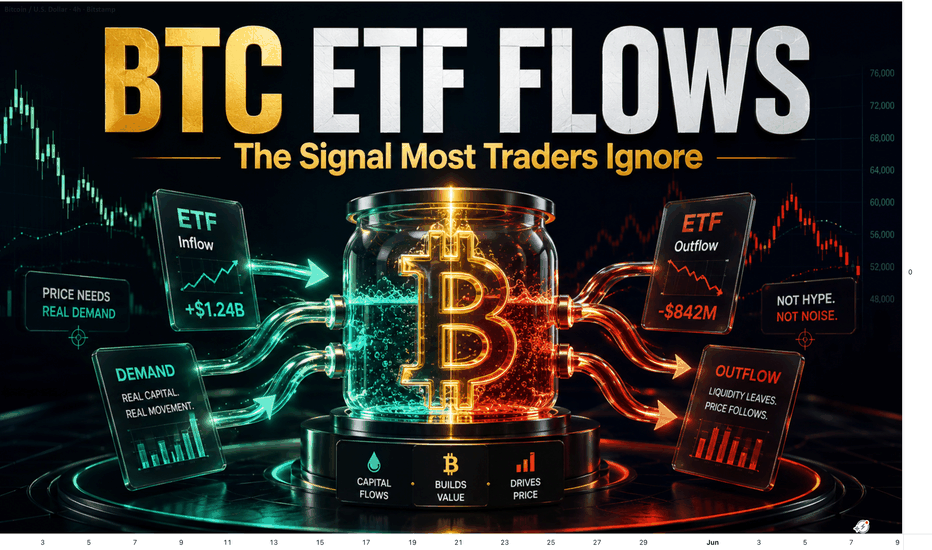
Short 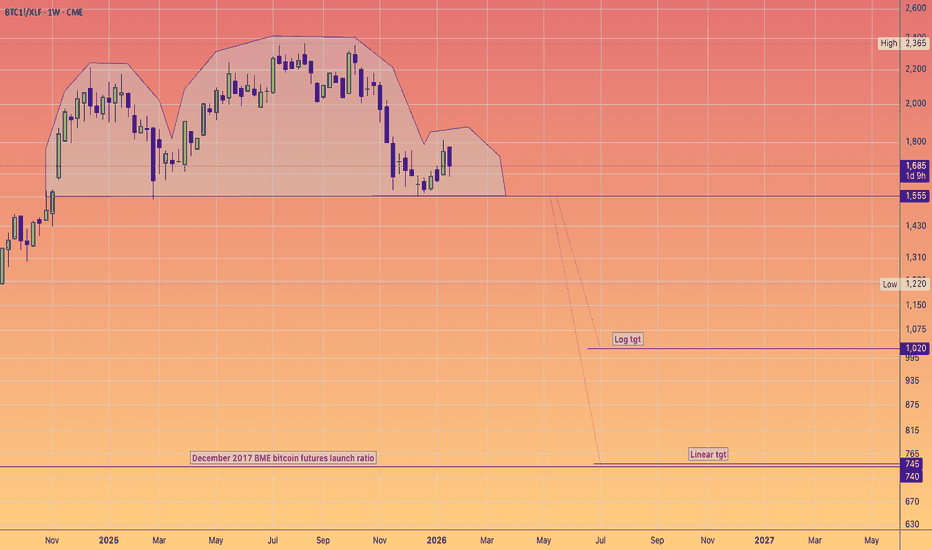
 Long
Long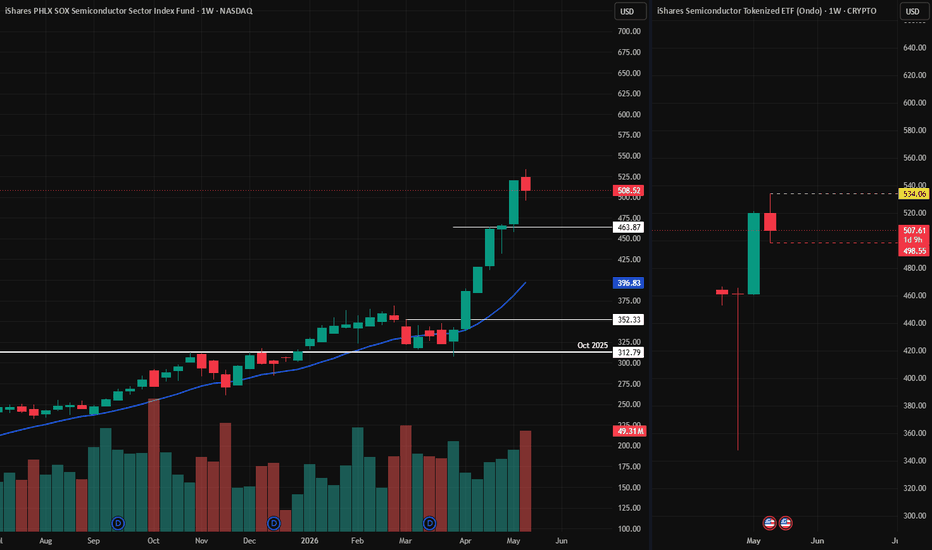
Bitcoin Tests Key $65,000 Support as Oversold Conditions Hint atBitcoin is approaching a critical technical level near $65,000, a zone that traders are watching closely after months of persistent selling pressure pushed the cryptocurrency sharply lower from its October 2025 peak. The digital asset is currently trading about 47% below its all-time high of $126,200, raising questions about whether the recent decline is nearing exhaustion.
The $65,000 area has emerged as an important support zone on longer-term charts. Support levels are price areas where buying interest has historically been strong enough to slow or reverse declines. While there is no guarantee the level will hold, market participants are increasingly focused on whether Bitcoin can stabilize around this region.
Technical indicators suggest selling momentum may be losing strength. Bitcoin's Relative Strength Index (RSI), a widely followed measure of market momentum, has fallen to 20.65. Readings below 30 are generally considered oversold, indicating that selling activity may have become stretched and that the pace of declines could begin to slow.
That does not necessarily mean a rally is imminent. Markets can remain oversold for extended periods during strong downtrends. However, historically, deeply oversold conditions have often coincided with periods when aggressive selling starts to ease and buyers gradually return.
The current setup has attracted attention because Bitcoin is testing support while momentum indicators sit at extreme levels. If buyers defend the $65,000 zone, the market could see a relief bounce as short sellers take profits and sidelined investors step back into the market. A successful hold could also improve sentiment after months of weakness.
On the other hand, a decisive break below support would likely increase concerns that the correction has further to run. Traders will be looking for confirmation through price action and trading volume before drawing conclusions about the next major trend.
What to Watch Next
Support Levels
The $65,000 region remains the most important level to monitor. Whether Bitcoin holds or breaks below this area could shape market direction in the coming weeks.
ETF Flows
Investors will also be watching spot Bitcoin ETF flows. Renewed inflows could signal improving institutional demand, while continued outflows may keep pressure on prices.
Macro Developments
Broader economic conditions remain another key variable. Interest rate expectations, inflation data, and overall risk sentiment across financial markets could influence investor appetite for cryptocurrencies.
For now, Bitcoin sits at a technically important crossroads. With prices deeply below their record highs and momentum indicators in oversold territory, traders are looking for signs that selling pressure is beginning to fade. Whether the $65,000 support zone can hold may determine the market's next move.
Long 
Give me 3 reasons not to be bullish on SolanaSolana’s Total Value Locked (TVL) expanded from $396M on Dec 26, 2022 to $8.69B by July 4, 2025, a 2,094% increase (~22x growth) across 80 weeks . This translates to a weekly geometric growth multiplier of ~1.089, or an 8.9% compound weekly rate .
This rapid TVL expansion reflects capital inflows, increased DeFi participation, and regained trust in Solana’s infrastructure following the FTX collapse.
————————————————
LST Ecosystem Expansion :
Liquid staking derivatives (JitoSOL, mSOL) accounted for a significant share of inflows, as yield-seeking capital returned with Ethereum-style primitives on Solana.
MEV Monetization & Compression Tech :
Validator-side MEV solutions and data compression (via Firedancer and ZK-state) improved scalability and trust in Solana’s low-latency environment.
Resurgence of DeFi-NFT Hybrids :
Protocols like Tensor and HadeSwap blurred lines between DeFi and NFTs, generating sticky liquidity and reinforcing Solana’s unique narrative.
Restored Institutional Confidence :
Post-FTX reforms and a more diversified validator ecosystem helped re-attract institutional capital, supported by enhanced wallet infra (e.g., Backpack, Phantom) and custodianship.
This pattern, paired with the geometric growth trend, suggests Solana’s DeFi ecosystem is entering a new structural bull phase, underpinned by both technical confirmation and fundamental evolution.
Anyways, let me know in the comments 3 reasons not to be bullish on Solana as we speak.
(PS: QC-resistant issues don’t apply only for Solana but for all major crypto assets!)
 Long
Long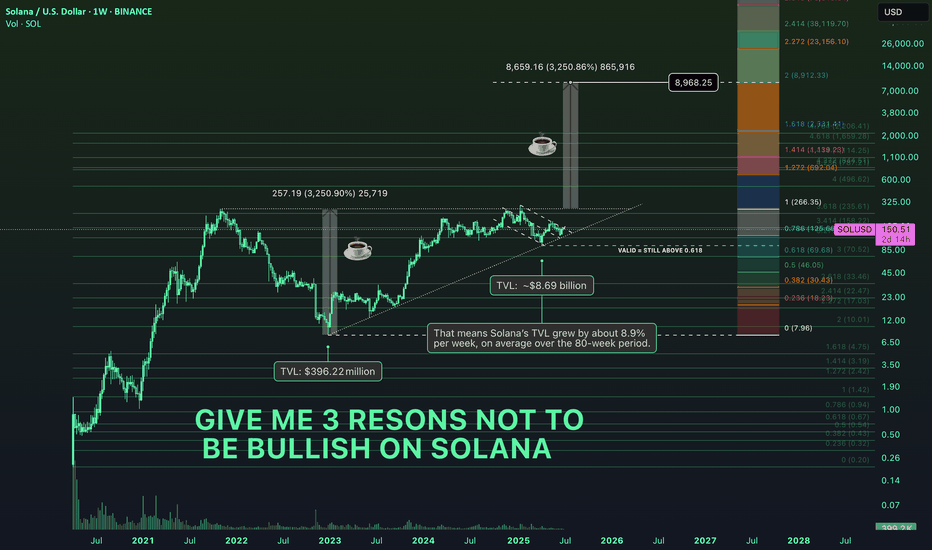
 Long
Long
 Long
Long
Bitcoin Holds the Line as Traders Watch for a BounceBitcoin is back testing the key $75,000 to $76,000 support zone for the third time in recent weeks, but this time the market feels different. Selling pressure has started to fade, and traders are seeing signs that the world’s largest cryptocurrency may finally be stabilizing instead of sliding lower.
Momentum indicators are also hinting at a slowdown in bearish pressure. Bitcoin’s RSI is sitting near 42.75, suggesting sellers are losing control after weeks of heavy volatility. That has encouraged some traders to look at the current range as a potential buying opportunity if support continues to hold.
The broader crypto market, however, remains stuck in a wait-and-see mode. Without a major catalyst, Bitcoin could continue moving sideways in the near term. Still, sentiment among large investors remains surprisingly strong. Analysts at Bernstein recently kept their bullish $150,000 Bitcoin target for the end of 2026, arguing that the current weakness looks mild compared to previous crypto corrections. For now, Bitcoin faces a critical test. A strong hold above support could trigger a relief rally.
Long 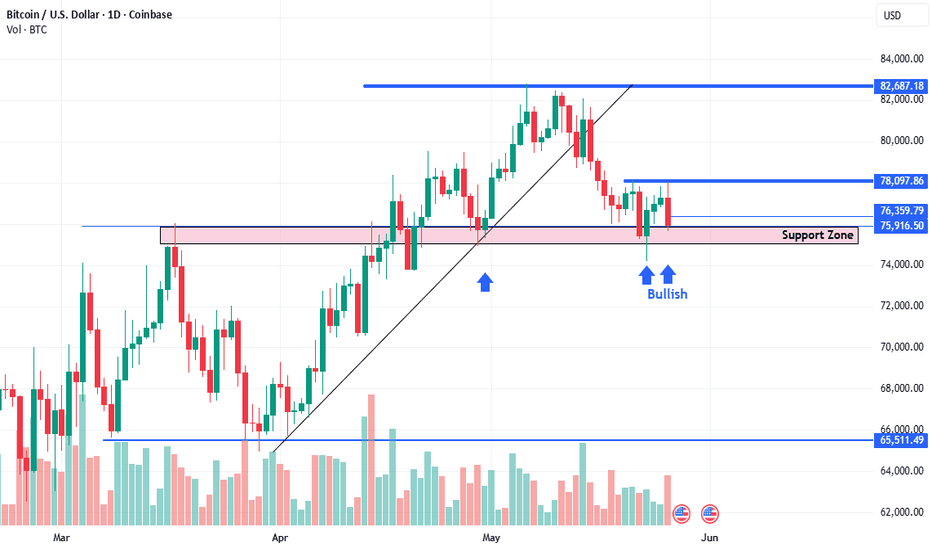
The ETF Accumulation vs. The 1H Premium TrapHYPE is currently the undisputed king of institutional altcoin rotation, but if you are buying at $62.23 right now, you are executing with retail impatience.
The macro fundamentals are violently bullish. Spot HYPE ETFs recently absorbed $75 million in their first week, with legacy entities like Goldman Sachs and Grayscale aggressively accumulating. Furthermore, Coinbase just integrated as Hyperliquid's official USDC treasury deployer, injecting US Dollar yields directly into the protocol and flipping the spot CVD into pure accumulation.
But macro strength does not justify poor micro execution. Here is why you need to wait.
1. The 1H Premium Exhaustion 🌡️
We are currently floating at $62.23, placing us deep in the Smart Money Concepts (SMC) PREMIUM zone.
Volume is dead: We are running 80% below average ($157k vs $815k), signaling an absolute lack of institutional conviction at these elevated prices.
Momentum is fading: The MACD is printing clear bearish divergence, and the RSI is trending down at 45.8.
Institutions accumulate in discount zones; they distribute to impatient retail in the premium zones.
2. The Structural Magnets 🧲
Overhead, we have a massive Bearish Order Block (supply zone) capping the price between $62.90 and $64.80. Every attempt to push higher is being met with algorithmic selling.
Below us, the vacuum is waiting:
The FVG: There is an unfilled bullish Fair Value Gap resting exactly at $61.69 - $61.81.
The Dynamic Floor: The true macro support is the ascending trendline currently sitting at $57.89 (boasting an incredible 93.29 score with 31 structural touches dating back 224 bars).
📉 The Trade Plan & Triggers
Do not force a position in the middle of a weak-volume premium range. The risk-adjusted play is pure patience. Let the market come to you.
The Short (Rejection): Wait for a clean test and rejection at the $64.80 supply ceiling to short down to the $60.76 immediate support.
The Long (Reload): Let the price drop to fill the $61.69 FVG, or ideally, wait for a broader market pullback to test the $57.89 ascending trendline. That is your high-probability institutional reload zone.
Invalidation: A 4H close above $64.80 with a massive volume surge breaks the supply zone and kills the pullback thesis entirely.
Disclaimer: This analysis maps structural liquidity and order flow. Always wait for confirmation before executing and manage your risk strictly. Trading or Gambling? Be Honest With Yourself.🎯 Trading or Gambling? Be Honest With Yourself.
Many people enter the market dreaming of quick money — but without a plan, discipline, or risk management, trading turns into gambling.
The difference is not the market.
The difference is YOU, your mindset, and your process.
📌 Gambling Mindset:
❌ Driven by emotions
❌ Random entries & exits
❌ No risk management
❌ Hope-based decisions
❌ Chasing quick profits
📌 Professional Trading Mindset:
✅ Knowledge & market understanding
✅ Planned entries and exits
✅ Risk management first, profits second
✅ Emotional discipline & patience
✅ Focus on consistency, not excitement
A professional trader understands one thing:
The market rewards discipline, probability, patience, and execution — not greed or emotions.
Every trade should answer these questions:
✔️ What is my setup?
✔️ What is my risk?
✔️ Where is my stop loss?
✔️ What is my target?
✔️ Does this align with my plan?
💡 Remember:
Gamblers chase excitement. Traders build consistency.
The goal is not to win one trade.
The goal is to become a disciplined, independent, and consistently profitable trader over time.
🔥 Question for you:
Are you trading with a strategy or simply taking chances? Comment below 👇 Education 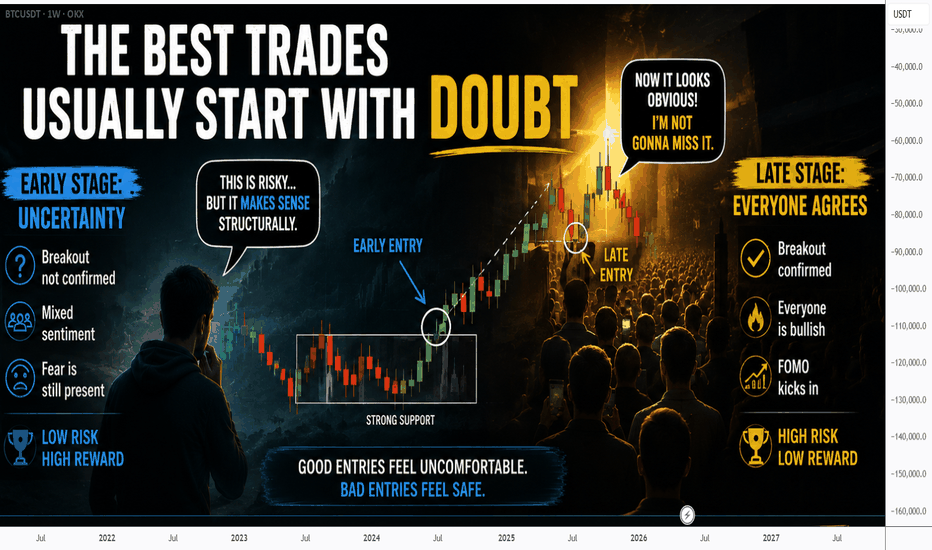
 Long
Long
Long 
Long 
Long 
 Long
Long