GOLD - Correction within the local uptrend FX:XAUUSD is testing 5000, the first attempt was unsuccessful, but there is still a chance for further growth. Geopolitical support is the main driver.
Renewed demand for safe-haven assets due to the lack of breakthrough in Russia-Ukraine negotiations and the rapid escalation of the US conflict with Iran.
The Fed minutes were rather hawkish, but the market maintained expectations of three 0.25% cuts this year, which supported gold.
The strengthening of the USD is supported by capital inflows into the US and expectations for Friday's inflation (PCE) and GDP statistics. Friday's statistics will determine the further direction: weak inflation data could push the price above $5,000, while strong data could bring back pressure.
Resistance levels: 5018, 5046, 5090
Support levels: 4988, 4963, 4944
Locally, after updating the maximum, a correction is forming for the hunt for liquidity. Focus on 4988 - 4963. If the bulls hold their defense above the support level, growth may continue. Local targets are 5018 and 5046.
Sincerely, R. Linda!  Long
Long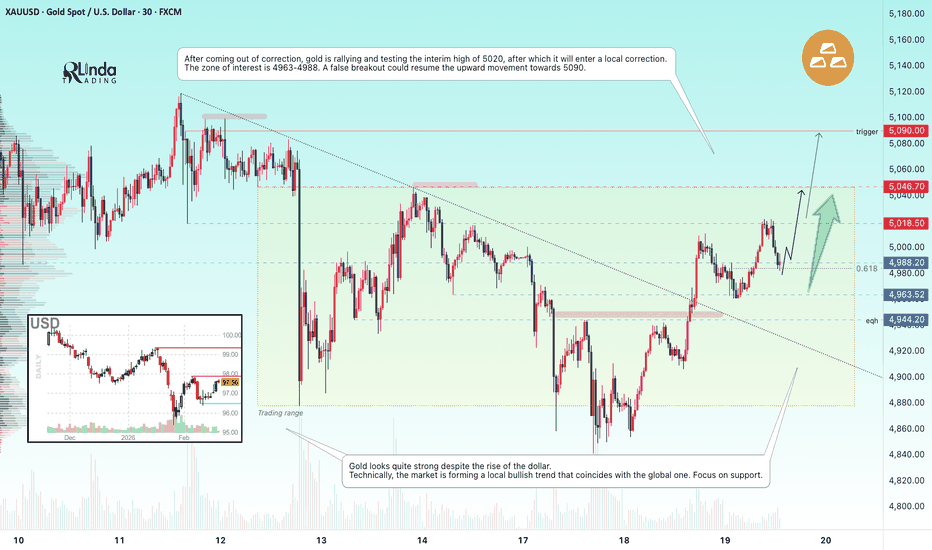
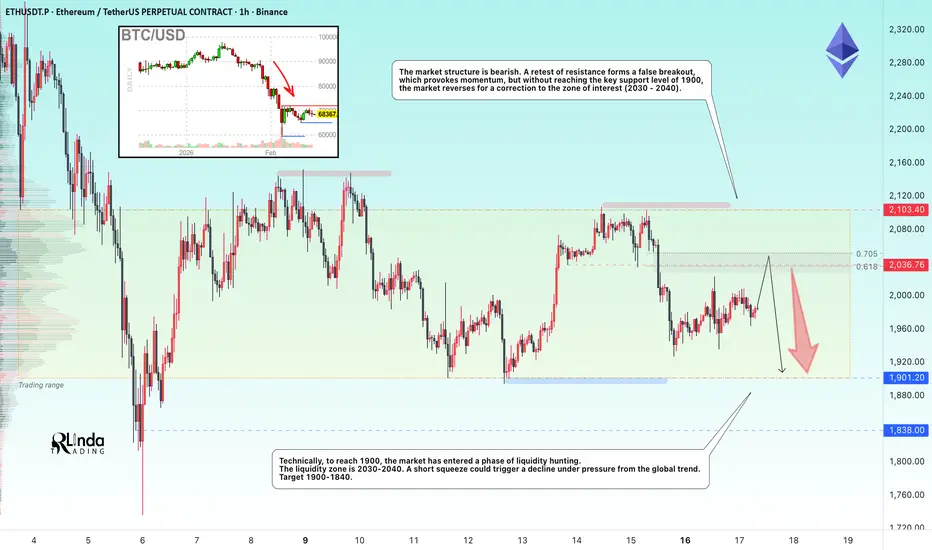
ETHUSDT - Rebound from resistance. Interest in 1900 BINANCE:ETHUSDT fell again after retesting the resistance level of the trading range. The market is bearish, with sellers keeping the altcoin below 2100-2000.
The market structure is bearish. The retest of resistance forms a false breakout, which provokes momentum. At the moment of momentum formation, a price imbalance area of 2030 - 2040 is formed. Without reaching the key support level of 1900, the market reverses, leaving support as a point of interest to which it may still return. But before that, we observe a correction of that very area of imbalance.
Technically, the market has entered a phase of liquidity hunting. The liquidity zone is 2030-2040. A short squeeze could trigger a decline under pressure from the global trend. Target 1900-1840
Resistance levels: 2036, 2103
Support levels: 1901, 1838
A retest of resistance and the formation of a false breakout could shift the local imbalance towards sellers, which in turn could lead to a fall to the support of the current range.
Best regards, R. Linda!  Short
Short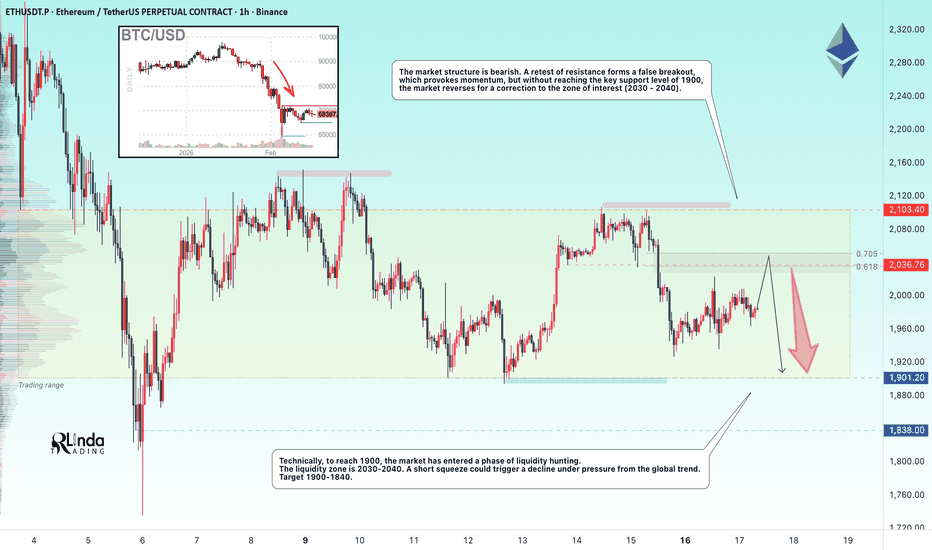
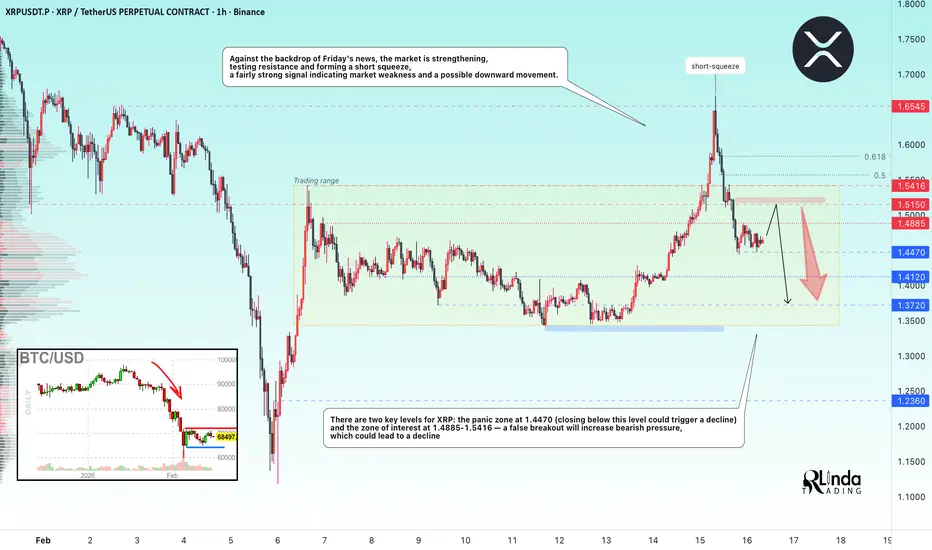
XRPUSDT - False breakout of resistance. Downward trend BINANCE:XRPUSDT updated its local maximum to 1.670 amid the impact of economic news (CPI). It is still too early to talk about a bullish trend. The past maneuver is more indicative of a hunt for liquidity...
Against the backdrop of Friday's news, Bitcoin, which is followed by the cryptocurrency market, is strengthening. Altcoin is testing resistance and forming a short squeeze relative to the resistance zone of 1.541-1.654, which is a fairly strong signal indicating market weakness and a possible downward movement.
There are two key levels for XRP: the panic zone of 1.4470 (closing below this level could trigger a decline) and the zone of interest of 1.4885 - 1.5416 - a false breakout will increase bearish pressure, which could lead to a decline.
Resistance levels: 1.4885, 1.5150, 1.5416
Support levels: 1.447, 1.412, 1.372
The ideal scenario for us is growth and retesting of resistance at 1.4885 - 1.5150 and the formation of a false breakout, which, in turn, could cause a decline to the zone of interest at 1.372. However, a premature breakdown of the nearest support could also cause a decline.
Best regards, R. Linda!  Short
Short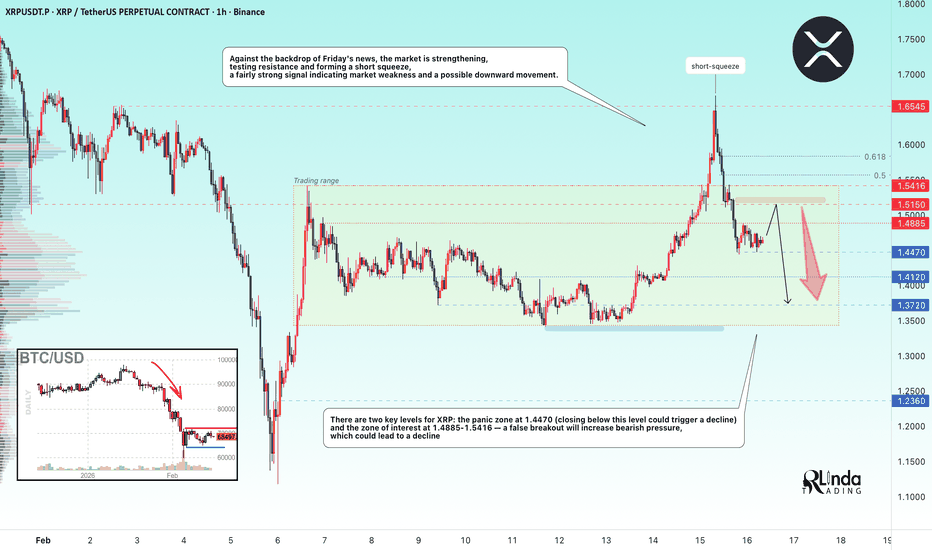
ETH/USDT 1D Chart Long-Term📊 ETH/USDT – 1D (KuCoin)
🔻 1. Main trend – clearly down
A series of lower highs and lower lows
Price below the long-term downtrend line (orange)
Additional short-term downtrend line (black) – accelerating the decline
Unless there is a breakout + close of the daily candle above this black line, the trend remains unchanged.
🟢 Key Levels
Resistance:
$2,249 – first major level to reclaim
$2,546 – structure shifts to a more neutral structure
$2,955 – only here does a real change in sentiment occur
Support:
$1,692 – key level (last major demand zone)
$1,365 – if 1,692 falls → a quick flush is possible
📉 Current situation (around ~$1,950)
Price:
Consolidating below the trend line
Creating a small flag/bear pennant
No strong rebound after a large dump
Technically, this looks more like:
👉 continued declines
than accumulation (at the moment)
📊 RSI + Stoch RSI
RSI:
Breaking back from oversold territory
Still below 50 → bears in control Market
Stoch RSI:
In the overbought zone
Could trigger a short-term pullback
Meaning:
A short bounce is possible, but the structure remains bearish.
🔥 Scenarios
🟥 Scenario 1 – Bearish (more likely)
Rejection at the trend line
A drop to $1,690
A possible breakout even to around $1,500
🟩 Scenario 2 – Bullish short term
A breakout of $2,050–$2,100
A retest and attack at $2,249
Only above $2,550 does the structure change  Short
Short
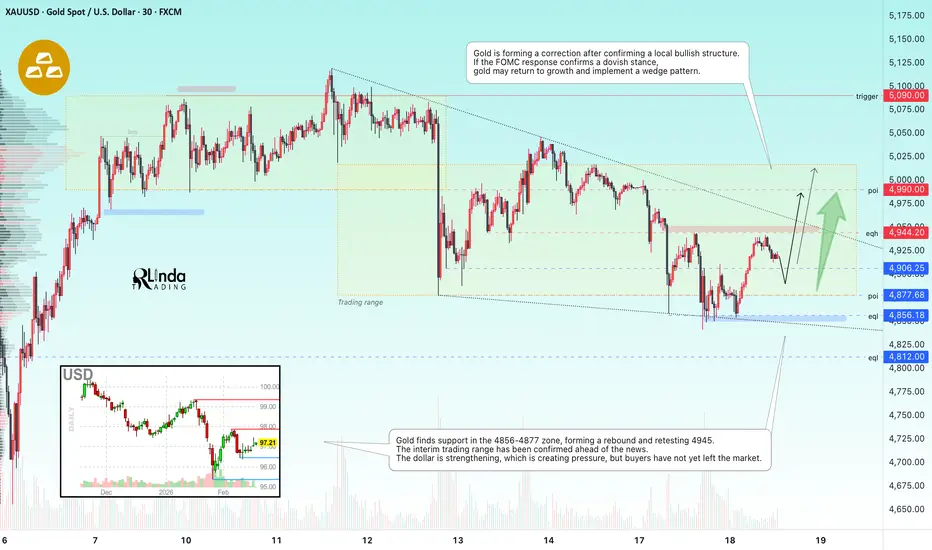
GOLD - Consolidation ahead of newsFX:XAUUSD is recovering from weekly lows of 4840 and testing strong resistance at 4944, which is holding back growth ahead of the news. The market is awaiting the publication of the minutes of the January FOMC meeting
The FOMC minutes will provide clues about the timing and scale of rate cuts. The market is still pricing in a ~60 bp cut this year.
The recent CPI report gives positive hope for a dovish tone from the regulator.
The lack of progress in the US-Iran and Russia-US-Ukraine negotiations supports demand for gold as a defensive asset. However, the strengthening of the dollar amid portfolio rebalancing limits gold's growth
Technically, the intermediate trading range of 4944-4856 has been confirmed. A retest of support could form a rebound and bring the price to a retest of 4944, which would only increase the chances of a breakout. If gold can close above 4944, the market will have a chance for a local rally to 5000.
Resistance levels: 4944, 4990, 5090
Support levels: 4906, 4877, 4956
Two key levels: 4877 - 4944. A retest of support will provide an opportunity for strengthening towards resistance, but a breakout of the 4944 level will confirm the end of the correction and allow the market to break out of the downward resistance and trigger growth towards 5K, provided that the fundamental background takes on a positive tone.
Sincerely, R. Linda! Long 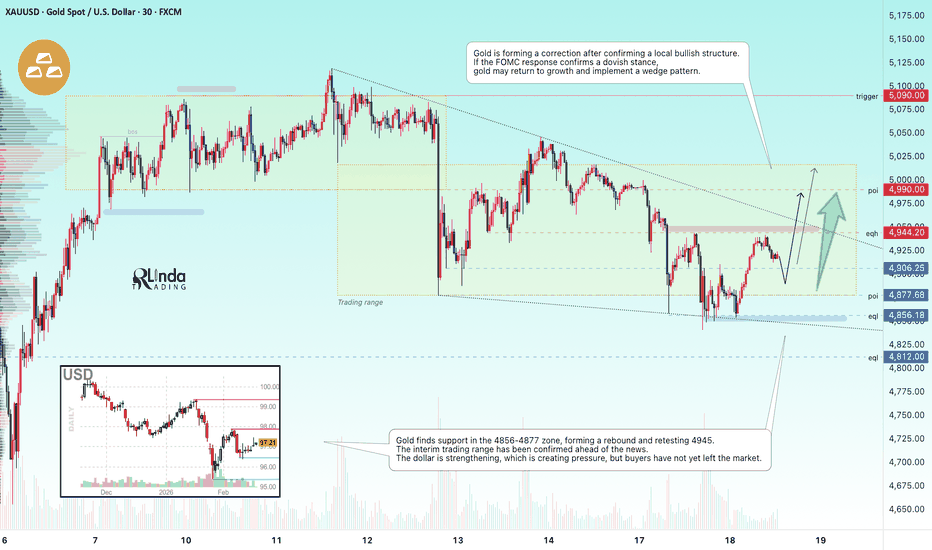
USDJPY - Reversal setup relative to range support FX:USDJPY faces strong support within the correction. The price closed within the trading range of 152.8 - 157.78 and is forming a strong reversal setup relative to the lower boundary.
The dollar is strengthening, which supports the currency pair. The yen is undergoing a correction. Within the range, a rebound from support to 155.65 is possible, and if the bulls hold the specified resistance, the growth may continue to 157.78.
The currency pair is returning to support at 152.8 as part of the sell-off and is testing the level, forming a double bottom, which generally suggests that there is no possibility of continuing the decline against the backdrop of a strong dollar.
Resistance levels: 155.65, 157.78, 159.45
Support levels: 152.83
The false breakout of support indicates that the bulls are trying to maintain their positions and are not letting the price fall, which also confirms the formation of a double bottom. If the bulls keep the price above 153.0, this move could support the price growth.
Best regards, R. Linda!  Short
Short
GOLD - Declining demand led to a correction FX:XAUUSD remains under moderate pressure, staying below the key level of $5,000. The market is awaiting news on the US-Iran negotiations, which will be the immediate driver.
There is a lack of demand from Asia due to the Chinese New Year celebrations. The USD is up slightly amid portfolio rebalancing ahead of important data releases on Friday. Together, this is putting pressure on the metal, which has entered a correction phase but is technically within the 4880-5090 range.
The short-term dynamics of gold will be determined by the outcome of the US-Iran negotiations. Any signs of escalation will bring back demand for the safe-haven asset and push the price above $5,000.
At the moment, gold is trading below the psychological mark of $5,000, but is holding back from a deep fall. Support remains due to cautious market sentiment ahead of negotiations with Iran.
Resistance levels: 4943, 4990, 5090
Support levels: 4879, 4812
The market structure is bearish, with a retest of the 4943-4950 zone of interest forming, from which gold may fall to the 4870 range support for a retest. However, further developments will depend on the fundamental background. A rebound from 4879 and growth to 4990 - 5090 is possible, but if the price closes below 4880, this could trigger a further decline to 4880. Mixed data makes it necessary to monitor local benchmarks.
Best regards, R. Linda! Short 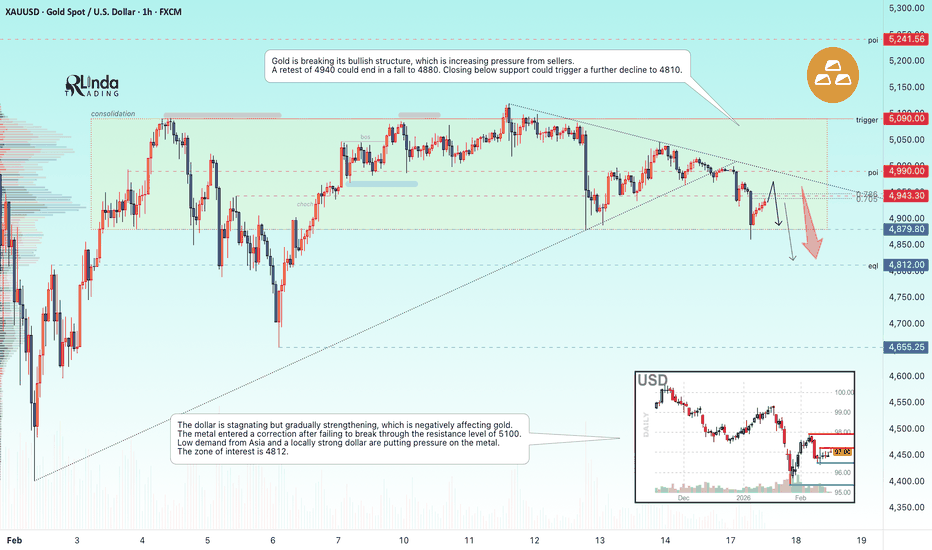
GOLD - The range 4900 - 5100 is narrowing. Positive background..FX:XAUUSD is trading without clear dynamics due to holidays in the US and China, which have reduced market activity. However, the battle for the 5000 zone continues...
The main macro releases will only come out on Friday. Until then, the market will be guided by general sentiment.
Inflation supported rate expectations: The slowdown in CPI in January reinforced expectations of two Fed rate cuts this year.
The decline in Treasury yields and the weakening of the dollar after the release of inflation data provide fundamental support for gold.
Gold is consolidating after Friday's rise, holding key levels of 4990-4950. The fundamental backdrop remains favorable. Further momentum will come after the release of GDP data at the end of the week.
Technically, the market may close within the range of 4990 (4902) - 5090. In this case, trading can be considered relative to the channel boundaries and intermediate levels located inside, until a driver appears.
Resistance levels: 5090 - 5100, 5150
Support levels: 4990, 4945, 4902
A retest of support could trigger a price increase to the trigger, but until a driver appears, the market may remain within the flat range. Thus, we can consider a rebound up from support and a rebound down from resistance.
Best regards, R. Linda! Long 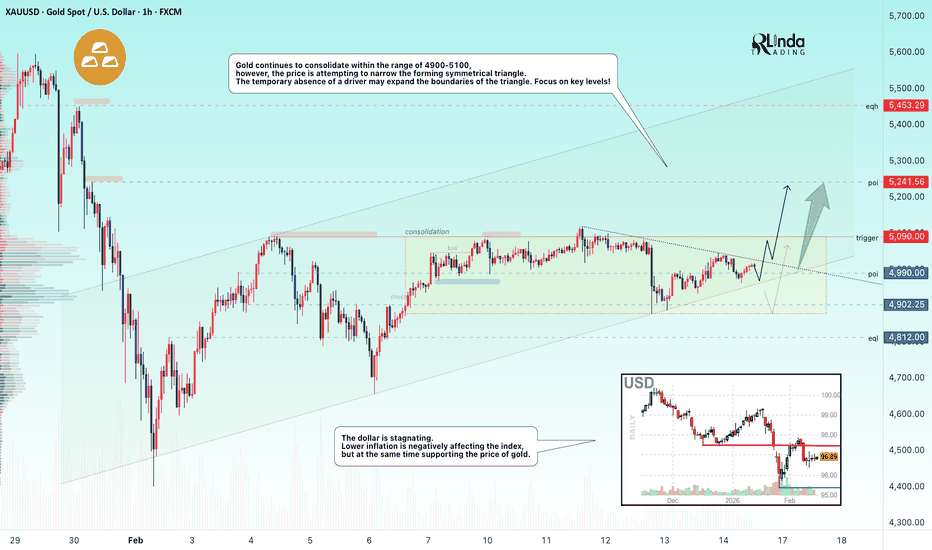
BITCOIN - Correction against the global bearish trend BINANCE:BTCUSDT.P is recovering from an interim low of 65K. The area of interest is 71,500, but it is too early to talk about a bull market, as the influence of buyers may be short-term within the global downtrend.
The main growth factor that emerged on Thursday/Friday was cooling inflation in the US, reducing pressure on the Fed to keep rates high. This brought investors back to risky assets. Will this influence be long-term?
Global and local trends are downward.
Bitcoin is within a neutral range of 71,500 - 65,700. A countertrend movement is forming after a retest of the local low of 65K. Until the structure is broken, a decline to 68,300 - 65,700 should be expected as a primary reaction to the resistance at 71,500. Liquidity capture and the subsequent formation of a false breakout could trigger a local reversal and decline.
Resistance levels: 71,450, 71,850, 73,100
Support levels: 68,370, 65,700
Within the current trading range, it is worth waiting for a retest of the key zone - the area of interest and liquidity 71450 - 71850. The lack of bullish momentum, a false breakout, and consolidation in the selling zone could lead to a sell-off and a decline in price.
Sincerely, R. Linda!
 Short
Short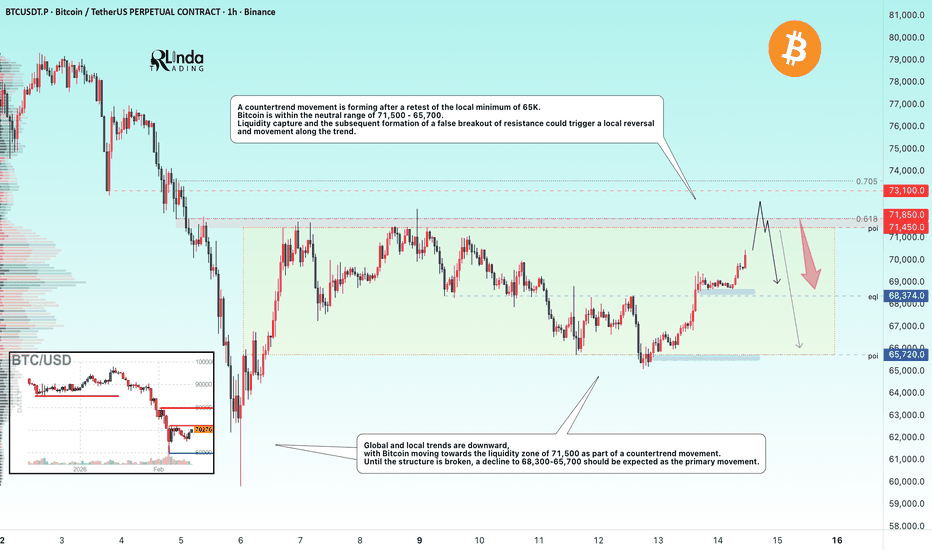
The Fibonacci Trading Strategy: A Professional GuideMaster the Fibonacci trading strategy. Learn how to use retracements, extensions, fans, and arcs to identify critical support, resistance, and reversal levels in Forex, stocks, and commodities.
In the fast-paced world of financial markets, precision is the difference between a profitable trade and a missed opportunity. The Fibonacci trading strategy is one of the most widely respected tools for identifying critical price levels where markets are likely to reverse or continue their trend.
Used extensively by institutional and retail traders alike in Forex, stocks, and commodities, this method leverages mathematical ratios to decode market chaos.
This comprehensive guide will cover the fundamentals of the Fibonacci sequence, how to apply its various tools (Retracements, Extensions, Fans, and Arcs), and practical techniques to enhance your trading precision.
Key Takeaways
Precision Analysis: Fibonacci tools help identify high-probability levels for support, resistance, and trend continuation.
Versatility: Effective across all major asset classes, including Forex, crypto, stocks, and commodities.
Confluence is Key: The strategy is most powerful when combined with other technical indicators like RSI, Moving Averages, and candlestick patterns.
What Is the Fibonacci Sequence?
The foundation of this strategy lies in a mathematical sequence discovered centuries ago. The Fibonacci sequence is a series of numbers starting with 0 and 1, where each subsequent number is the sum of the two preceding ones:
0, 1, 1, 2, 3, 5, 8, 13, 21, 34, 55, 89…
While this pattern appears frequently in nature and architecture, in financial trading, it serves a specific purpose. By dividing numbers in the sequence by one another, traders derive specific ratios—most notably 23.6%, 38.2%, 50%, 61.8%, and 78.6%.
These ratios are not arbitrary; they represent psychological barriers in the market. Traders use them to predict how far a price might "retrace" (pull back) before resuming its trend, or how far it might "extend" after a breakout.
Fibonacci Retracements: The Core Tool
Fibonacci Retracements are the bread and butter of this strategy. They are horizontal lines that indicate where a potential reversal or pause might occur during a trend.
How It Works
To draw a retracement, a trader identifies a major move:
In an Uptrend: Draw from the Swing Low (lowest point) to the Swing High (highest point).
In a Downtrend: Draw from the Swing High down to the Swing Low.
The resulting horizontal lines act as potential Support (in an uptrend) or Resistance (in a downtrend).
Critical Retracement Levels
23.6%: Indicates a shallow pullback. If price respects this level, it signals a very strong trend with high momentum.
38.2%: A moderate retracement level often seen in healthy, sustainable trends.
50%: While not a true Fibonacci ratio, this psychological midpoint is universally observed by major institutions.
61.8% (The Golden Ratio): The most critical level. This is often where deep corrections end and the primary trend resumes.
78.6%: The "last stand" level. A reversal here usually precedes a massive move, but a break beyond this often invalidates the trend.
Fibonacci Extensions: Projecting Targets
While retracements help you find entries, Fibonacci Extensions help you find exits. They project potential price targets beyond the current range, helping traders decide where to take profits.
How It Works
Extensions require three points: the Swing Low, the Swing High, and the end of the Retracement. The projected levels show where the price might encounter resistance as it breaks into new highs (or support as it breaks into new lows).
Key Extension Levels
161.8%: The primary target for breakouts and initial profit-taking.
261.8%: A secondary target often reached during high-momentum trends.
423.6%: A rare extension level seen only in exceptionally strong parabolic moves.
Advanced Tools: Fans and Arcs
For traders looking to visualize dynamic support and resistance over time, Fibonacci Fans and Arcs offer a different perspective.
Fibonacci Fans
Unlike horizontal retracement lines, Fibonacci Fans are diagonal. They are drawn from a major high or low and radiate outward.
Usage: These diagonal lines act as dynamic trendlines. In an uptrend, price will often bounce off the 38.2% or 50% fan lines as it climbs. A break below the 61.8% fan line often signals a trend reversal.
Fibonacci Arcs
Fibonacci Arcs introduce the element of time. They appear as curved lines radiating from the trend's origin.
Usage: These arcs highlight support and resistance based on both price levels and time duration. The curvature helps traders anticipate not just where price will turn, but when it might interact with a key level.
Enhancing Accuracy: Combining Indicators
A common mistake novices make is trading Fibonacci levels in isolation. To increase your win rate, you should look for confluence—where multiple signals align.
Best Indicator Pairings
Moving Averages: If a 50% Fibonacci retracement aligns perfectly with a 200-day Moving Average, that support level becomes significantly stronger.
RSI (Relative Strength Index): If price hits the 61.8% Golden Ratio while the RSI is in "Oversold" territory, the probability of a reversal skyrockets.
Candlestick Patterns: Look for specific price action triggers, such as a Hammer or Engulfing Candle, occurring exactly on a Fibonacci line.
Volume: A spike in trading volume as price approaches a Fibonacci level confirms that institutional traders are stepping in.
Pros and Cons of the Strategy
Pros:
Universally Recognized: Because so many traders watch these levels, they often become self-fulfilling prophecies.
Adaptable: Works in both trending and ranging markets.
Visual Clarity: Simplifies complex market structure into actionable zones.
Cons:
Subjectivity: Choosing the exact "Swing High" and "Swing Low" can vary from trader to trader.
Not a Crystal Ball: Fibonacci levels are potential zones of interest, not guaranteed turning points. They require confirmation.
Practical Tips for Success
To trade Fibonacci levels like a professional, follow these guidelines:
Wait for Confirmation: Never place a "blind" limit order at a Fibonacci line. Wait for price to react (bounce or reject) first.
Use Confluences: The best trades happen when a Fibonacci level overlaps with previous market structure (e.g., old resistance becoming support).
Risk Management: Always place your stop-loss just beyond the next Fibonacci level. For example, if entering at the 61.8%, your stop should be below the 78.6%.
Start Simple: Master the standard Retracements and Extensions before complicating your charts with Fans or Arcs.
Conclusion
The Fibonacci trading strategy is a powerful method for bringing structure to an unstructured market. It does not predict the future, but it provides a high-probability roadmap of where price is likely to go.
By combining the mathematical precision of Fibonacci ratios with disciplined risk management and secondary indicators, traders can significantly improve their entries, exits, and overall market timing. GOLD - Bulls in the game? Attempting to break through 5100...Last week was volatile for FX:XAUUSD : it rose to $5,100, then fell sharply by 3%, and then rebounded on the back of new US inflation data. Technically and fundamentally, the outlook is positive.
The CPI, which traders had been eagerly awaiting, slowed more than expected, which boosted buyer interest in hedge assets such as gold. However, gold remains caught between conflicting signals: a strong labor market and a stable US economy are weighing on prices, but slowing inflation and uncertainty over Fed policy are providing support.
The key drivers this week will be GDP data and Fed rhetoric.
Technically, the chart points to a bull market. Volumes are starting to grow, the market is forming a bullish trend and quite promising technical patterns with a bullish character. Something interesting may happen, for example, a breakout of 5100 and growth to 5250-5450-5600...
Resistance levels: 5090, 5145, 5240
Support levels: 4990, 4902
Focus on the current range and key levels: 4990 - 5090. From the opening of the session, the market may storm the resistance. A breakout and close above 5090-5100 may trigger distribution due to the current consolidation. As an additional scenario: a retest of support before strong growth. The Asian session may be volatile.
Best regards, R. Linda! Long 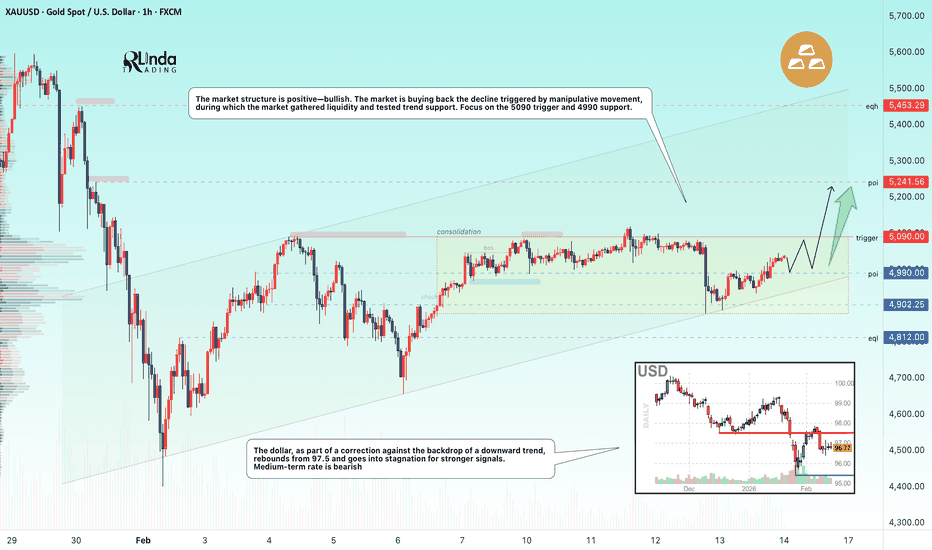
 Long
Long
 Short
Short
 Short
Short
GOLD - Consolidation ahead of the news? Will the trend continue?FX:XAUUSD is attempting to recover to $5,000 after a sharp 3.5% drop on Thursday. There are no clear reasons for this. All market attention is focused on today's US inflation report - CPI.
Yesterday's gold sell-off was caused not only by technical factors, but also by capital flight to the dollar amid renewed fears surrounding AI. There was no news driver, the market was overstretched, and the sharp momentum of the dollar triggered sell-offs (liquidations) in the markets.
Despite strong NFP, the market is still pricing in at least two rate cuts this year.
Ahead is CPI — the main trigger: Forecast — Core CPI slowdown to 2.5% y/y. If inflation turns out to be higher than expected, the market will reassess the Fed's plans, which will strengthen the dollar and hit gold.
High volatility is inevitable today.
Resistance levels: 4990, 5100
Support levels: 4944, 4902
Technically, local and global trends are bullish, and any correction could quickly end in growth, especially from strong levels. A breakout of 4990 and maintaining the price above this level could confirm the bullish nature of the market. On news amid high volatility, the market may test the support of the trend and the range of 4878 - 4812.
Negative scenario: a breakout and close below 4800 could trigger a fall to 4700 - 4600.
Best regards, R. Linda! Long 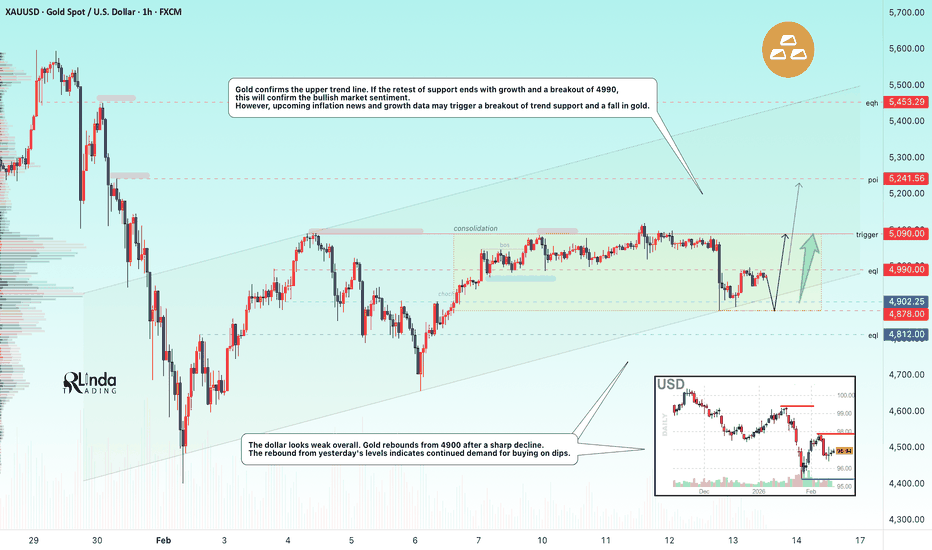
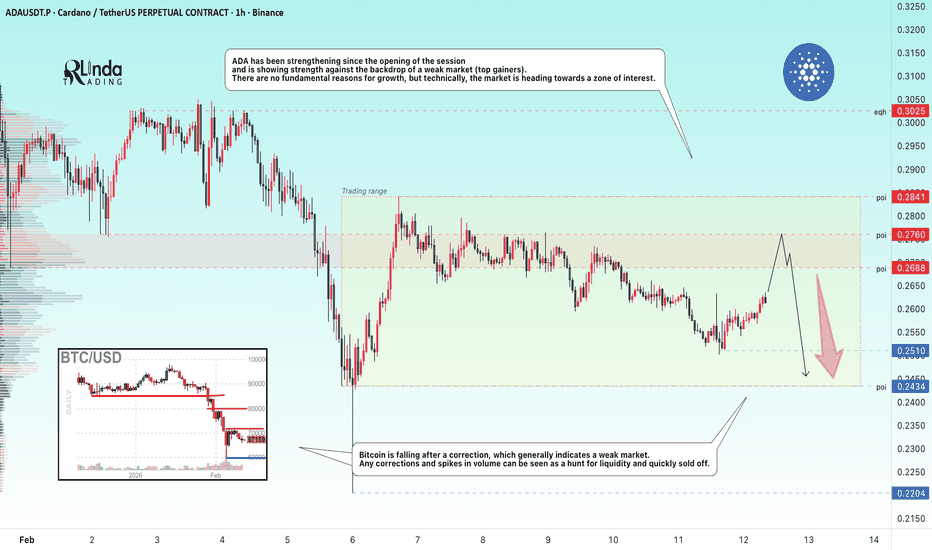
ADAUSDT - Short squeeze before falling to 0.22BINANCE:ADAUSDT , after breaking through the global support zone of 0.275 and updating its lows to 0.22, entered a phase of correction and consolidation below key levels. Another short squeeze could trigger a decline.
Bitcoin is falling after a correction, which generally indicates a weak market and increases bearish pressure on the market. I recently said that Bitcoin would fall even lower, as global targets have not yet been achieved, so against this backdrop, altcoins may react accordingly.
Any corrections and volume spikes can be seen as a hunt for liquidity and quickly sold off.
ADA has been strengthening since the session opened and is showing strength against a weak market (top gainers). There are no fundamental reasons for growth, and technically, the market is heading towards a zone of interest.
Resistance levels: 0.2688, 0.276, 0.284
Support levels: 0.243, 0.2200
From a medium-term perspective, the altcoin has not yet tested the global support level hidden behind 0.22 - 0.2167, formed in 2023. A retest and short squeeze of the resistance zone could trigger a decline towards the target
Best regards, R. Linda!  Long
Long