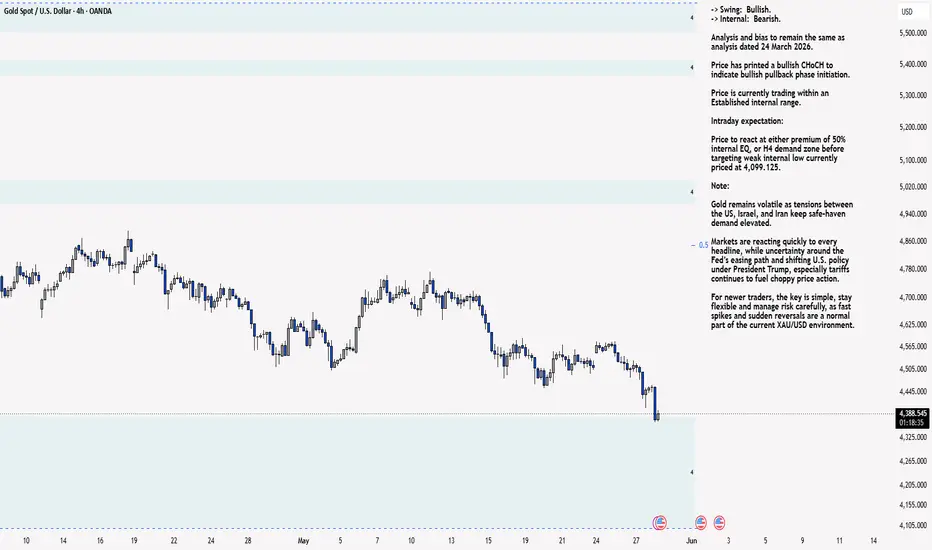
XAU/USD 29 May 2026 Intraday AnalysisH4 Analysis:
-> Swing: Bullish.
-> Internal: Bearish.
Analysis and bias to remain the same as analysis dated 24 March 2026.
Price has printed a bullish CHoCH to indicate bullish pullback phase initiation.
Price is currently trading within an Established internal range.
Intraday expectation:
Price to react at either premium of 50% internal EQ, or H4 demand zone before targeting weak internal low currently priced at 4,099.125.
Note:
Gold remains volatile as tensions between the US, Israel, and Iran keep safe‑haven demand elevated.
Markets are reacting quickly to every headline, while uncertainty around the Fed’s easing path and shifting U.S. policy under President Trump, especially tariffs continues to fuel choppy price action.
For newer traders, the key is simple, stay flexible and manage risk carefully, as fast spikes and sudden reversals are a normal part of the current XAU/USD environment.
H4 Chart:
M15 Analysis:
-> Swing: Bearish.
-> Internal: Bearish.
Bias and analysis to remain the same as yesterday's analysis dated 28 May 2026.
Price has printed according to my analysis dated 21 May 2026 where I mentioned that price to trade up to either premium of 50% internal EQ, or M15 supply zone before targeting weak internal low, currently priced at 4,453.390.
Price has printed a bearish iBOS and subsequently s bullish CHoCH to indicate bullish pullback phase initiation, with price being contained within an established internal range. I will continue to monitor price action with respect to depth of pullback.
You will note that price has reacted at a previous H4 demand zone.
Intraday expectation:
Price to trade up to either premium of 50% internal EQ, or M15 supply zone before targeting weak internal low, currently priced at 4,366.230.
Note:
Gold remains highly reactive on the M15 as geopolitical risk continues to drive quick, headline‑led moves.
The tension between the US, Israel, and Iran is keeping safe‑haven demand elevated, with markets still sensitive to any sign of escalation.
At the same time, shifting US tariff policy under President Trump is adding extra uncertainty, fuelling sharp intraday swings and increasing the likelihood of sudden sentiment flips. Liquidity pockets and whipsaws remain common, making disciplined risk management essential.
Gold’s geopolitical premium is still firmly in place, and until tensions ease, short‑term volatility is likely to stay front‑loaded.
M15 Chart:  Long
Long
XAU/USD 28 May 2026 Intraday AnalysisH4 Analysis:
-> Swing: Bullish.
-> Internal: Bearish.
Analysis and bias to remain the same as analysis dated 24 March 2026.
Price has printed a bullish CHoCH to indicate bullish pullback phase initiation.
Price is currently trading within an Established internal range.
Intraday expectation:
Price to react at either premium of 50% internal EQ, or H4 demand zone before targeting weak internal low currently priced at 4,099.125.
Note:
Gold remains volatile as tensions between the US, Israel, and Iran keep safe‑haven demand elevated.
Markets are reacting quickly to every headline, while uncertainty around the Fed’s easing path and shifting U.S. policy under President Trump, especially tariffs continues to fuel choppy price action.
For newer traders, the key is simple, stay flexible and manage risk carefully, as fast spikes and sudden reversals are a normal part of the current XAU/USD environment.
H4 Chart:
M15 Analysis:
-> Swing: Bearish.
-> Internal: Bearish.
Price has printed according to my analysis dated 21 May 2026 where I mentioned that price to trade up to either premium of 50% internal EQ, or M15 supply zone before targeting weak internal low, currently priced at 4,453.390.
Price has printed a bearish iBOS and subsequently s bullish CHoCH to indicate bullish pullback phase initiation, with price being contained within an established internal range. I will continue to monitor price action with respect to depth of pullback.
You will note that price has reacted at a previous H4 demand zone.
Intraday expectation:
Price to trade up to either premium of 50% internal EQ, or M15 supply zone before targeting weak internal low, currently priced at 4,366.230.
Note:
Gold remains highly reactive on the M15 as geopolitical risk continues to drive quick, headline‑led moves.
The tension between the US, Israel, and Iran is keeping safe‑haven demand elevated, with markets still sensitive to any sign of escalation.
At the same time, shifting US tariff policy under President Trump is adding extra uncertainty, fuelling sharp intraday swings and increasing the likelihood of sudden sentiment flips. Liquidity pockets and whipsaws remain common, making disciplined risk management essential.
Gold’s geopolitical premium is still firmly in place, and until tensions ease, short‑term volatility is likely to stay front‑loaded.
M15 Chart: Title: NQ — Time-Based Swing Points & Fib Extension Precision | Time-Based Swing Points
Every major swing in this sequence printed within a narrow time window around a clock boundary:
03:32 — Swing Low. Price bottomed during the London session, just 2 minutes after the half hour. Marked the low of the entire sequence.
10:37 — Swing High. Morning session peak, 7 minutes after the full hour. Price stalled precisely at the -1.5 Fib Extension level.
02:39 — Swing Low. Asian session pullback low, 9 minutes after the half hour. Preceded the large expansion leg.
08:23 — Swing High. New high of the week, 23 minutes after the full hour — slightly wider window, but still the dominant reversal point of the session.
10:33 — Swing Low. Rejection after the 08:23 high, 3 minutes after the half hour. Clean structural low before the afternoon range.
18:02 — Swing High (right side of chart). 2 minutes after the full hour. Price reacted off the 50% Dealing Range level.
03:00 — Final low visible on the right edge. On the full hour exactly.
The pattern is consistent: market participants are clearing liquidity and reversing at measurable clock intervals. This is not random — these windows align with institutional order delivery periods.
Fibonacci Extension Confluences
The following Fib levels acted as exact reaction points:
-1 Fib Extension — Capped the initial rally out of the FVG base. Price stalled here for multiple candles before the 03:32 low.
-1.5 Fib Extension — Hit precisely at the 10:37 swing high. Single-candle reaction, no overshoot. Clean level.
-2.5 Fib Extension — Terminal point of the entire expansion move. The 08:23 high printed at 30,362.50, which aligns exactly with the -2.5 extension from the base range. This was the week's high.
The -1 → -1.5 → -2.5 sequence is a textbook measured extension ladder. Price did not pause at -2 — it skipped directly to -2.5, which confirms strong directional delivery rather than a choppy grind.
Additional Observations
FVG base (bottom of chart, ~29,500 area): Price spent the first session sweeping below this zone before reclaiming it. The entire rally originated from this reclaim. The FVG held as support throughout the week — it was never broken from below again.
Breaker block (around 30,113–30,130 area): After the -2.5 high at 08:23, price broke down through this level during the 10:33 selloff and subsequently used it as resistance on the 18:02 retest. Classic breaker behaviour — support flipped to resistance.
50% Dealing Range (30,113–30,130): Coincides with the Breaker. The 18:02 swing high printed exactly at this level. Double confluence — Fib midpoint + structural breaker = clean reaction.
PDL (Previous Day Low) at 29,743: Visible on the right side as the next downside target. Price was approaching this level at the end of the chart, suggesting continuation risk into this level if the Breaker holds as resistance.
-75.75: Annotated below PDL. This level was not reached during the charted period but remains a draw on liquidity if price continues lower.
Summary
The week delivered a clean directional expansion from the H1 FVG base to the -2.5 Fib Extension — a full measured move. Every significant turning point printed at a time-based marker. The -1.5 and -2.5 extensions provided exact exit targets with no guesswork required.
Structure was respected. Levels were respected. Time was respected.  Short
Short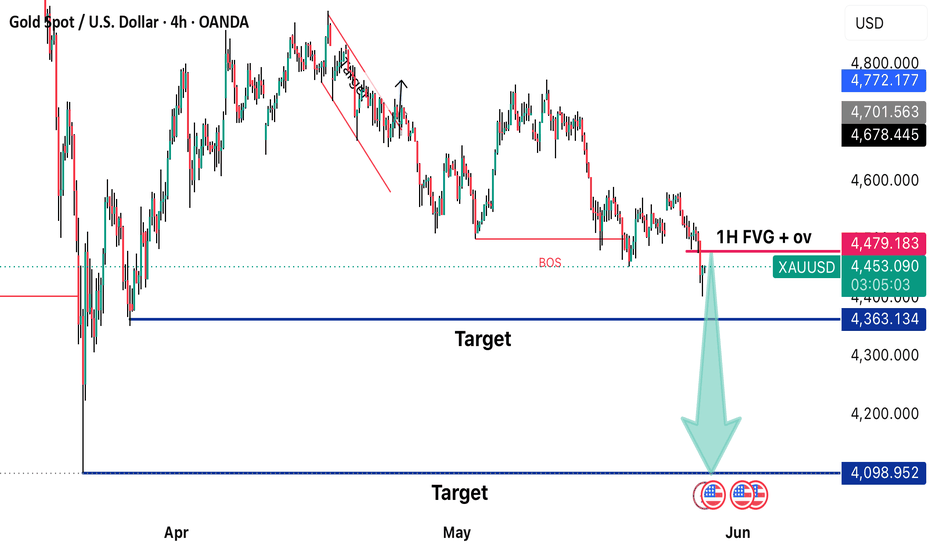
Long 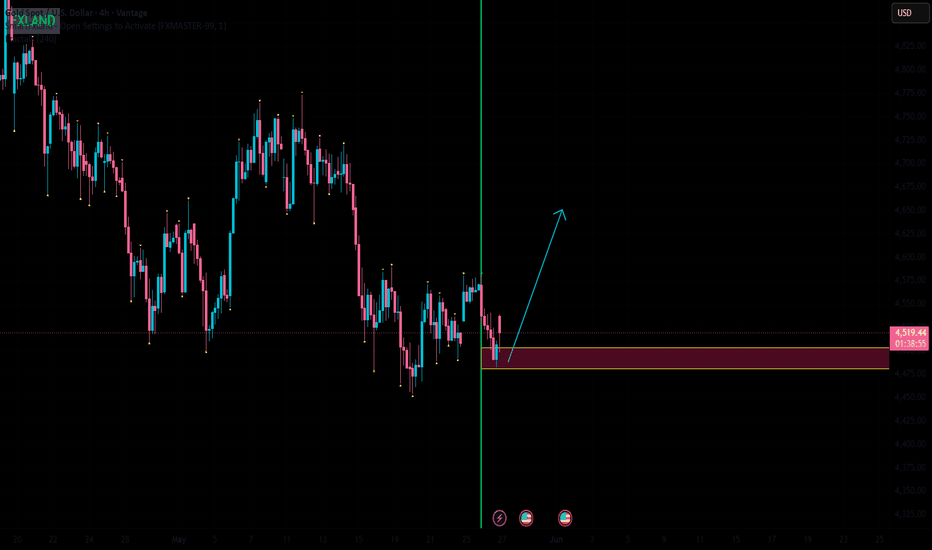
Short 
 Long
Long
Market Movements and Divergence between Spot and Futures MarketThe relationship between the spot asset and the futures contract can reveal a great deal about what institutional market participants are doing at any given moment. However, before diving into that, it is important to understand how the market functions as a whole and how price discovery is formed separately on the underlying asset and on derivatives.
By the way core difference between Spot and Futures trading: Spot trading involves buying or selling an asset, giving you direct ownership of the asset. Futures trading involves trading contracts that obligate you to buy or sell an asset at a predetermined price on a specific future date. This means you do not own the underlying asset but sign a contract to buy or sell an asset at a predetermined price. Of course, this article is not sufficient to explain all the differences between them, but it briefly attempts to explain how certain market movements create divergences and how these two markets influence each other.
It is important to understand that the spot and futures markets, despite having separate order books, do not exist in isolation from one another. They are interconnected through arbitrage algorithms, funding mechanisms, liquidation processes, delta hedging, and institutional risk management. It is precisely the interaction of these liquidity flows that forms modern market price discovery.
How Price Movement Is Formed
Market movements occur as a result of aggressive market buying and selling. The more liquid the instrument is (the higher its market capitalization), the more liquidity is required to move price higher or lower. Price discovery on the most liquid instruments is primarily driven by institutional market participants.
Price discovery on the underlying asset itself is relatively straightforward. When an institutional participant buys an asset and their buying activity dominates the market, price begins to move higher. Essentially, a rising price means that someone is lifting the opposing sell orders.
Let’s break this down with an example. Suppose the asset is trading at $100. At a certain moment, the order book is filled with the following orders. On the left is the price, and on the right is the order size denominated in dollars.
In this case, if we execute a $4,000 market buy order, we would absorb all the sell orders resting at 101 and 102, while partially filling the sell orders at 103. As a result, the last traded price of the asset would end up around 103.
After that, new orders begin filling the gap between 100 and 103.
It is also possible that other market orders could push price back down toward 100. However, within the context of our example, if the opposing sell orders continue getting absorbed, then the aggregate flow of transactions will continue driving price higher.
It is important to understand that market orders represent aggressive liquidity. They are what move price because they execute against existing limit orders resting in the order book. Limit orders, in turn, represent passive liquidity and form the visible bid and ask levels.
When the aggressive flow of market orders becomes sufficiently strong, the matching engine effectively begins to “jump” through low-liquidity zones. This is precisely why sharp impulsive moves and imbalances can form on the chart.
Futures Market Mechanics
On futures markets, the order book visually looks almost identical because the matching engine operates under a similar principle. However, there is one critical difference — behind the futures order book stands a system of leverage, liquidations, funding rates, and open interest. This fundamentally changes the mechanics of price movement.
The core difference between traditional futures and perpetuals is the expiration date: standard futures expire on a set date, whereas perpetual contracts can be held indefinitely.
(It is important to understand that perpetual futures are a synthetic derivative and do not involve physical delivery of the underlying asset. In order to keep the price of the perpetual contract aligned with the spot market, exchanges use the funding rate mechanism. When perpetuals trade at a premium relative to spot, long positions pay funding to short positions. When perpetuals trade at a discount, short positions pay funding to longs)
At the same time, futures pricing is not formed completely independently from the underlying asset. There is a direct relationship between the spot and futures markets.
If the futures price begins deviating significantly from fair value relative to spot, high-frequency arbitrage algorithms (HTF Bots) simultaneously buy one market while selling the other, compressing the imbalance.
This is why spot and futures markets, despite having separate order books, effectively function as a unified liquidity system.
On futures markets, price can move far more aggressively because, in addition to ordinary market orders, the market also receives:
• liquidations
• stop orders
• forced position closures
By the way you should know the key concepts while trading futures:
Initial Margin: Deposit required to open a futures contract.
Maintenance Margin: The minimum balance that must be maintained in your account to keep the position open.
Leverage: Futures use high leverage. If a losing trade causes your equity to drop below the maintenance margin, a “Margin Call” is triggered.
If we return to the same example where the asset is trading around 100, then in addition to the normal order book, liquidation clusters also appear (the third column in the grid).
Stop-loss orders are not visible liquidity inside the order book. They reside on a separate conditional server maintained by the exchange and are only activated once a certain price is reached.
Once activated, a stop-loss turns into an aggressive market order that begins executing against the nearest available liquidity.
This is precisely why zones containing clustered stop orders often become the source of sharp impulsive price movements.
If, in this case, we absorb $1,000 worth of sell liquidity at 101 via market buying, price would then reach the zone containing $5,000 worth of short liquidations.
Since the liquidation of a short position is technically a forced buy, the exchange begins sending additional market buy orders into the market in order to close losing short positions.
As a result:
• initially, the market receives a $1,000 market buy order
• once the liquidation zone is reached, an additional $5,000 flow of market buy orders is triggered
These orders then begin lifting the sell liquidity resting above, which can allow price to continue moving higher and execute orders resting at 102 and 103.
It is important to understand that liquidations themselves do not “push” price through some magical mechanism. They simply turn into aggressive market orders that execute against existing liquidity in the order book. This is exactly why liquidation cascades can significantly accelerate price movement.
Liquidity Sweeps and Position Accumulation
However, the opposite scenario is also possible. If, during the activation of a liquidation cascade, a large participant begins aggressively selling into this flow of market buying, they may use the impulse to build a short position (Buy-Side Liquidity taken).
A large participant cannot accumulate a meaningful position under conditions of low opposing liquidity without experiencing significant slippage. This is why institutional participants are often interested in creating impulsive moves into liquidity zones where the following are located:
• stop orders
• liquidations
• breakout buyers and sellers
The flow of aggressive market orders coming from the crowd allows the large participant to absorb that volume through pre-positioned limit orders.
For greater clarity, let’s look at the inverse example. Imagine a similar market situation:
In this case, instead of buying, we are selling at market. We execute a market sell into the 99 zone, after which a $3,000 cascade of long liquidations is triggered.
Since the liquidation of a long position represents a forced sale, additional market sell orders begin entering the market. These orders execute against the nearest resting buy orders, which means the liquidity resting at 98 and 97 can also be fully consumed.
In some cases, after an aggressive impulse on the futures market, price begins deviating significantly from the underlying spot asset.
This activates arbitrage HFT algorithms, which begin opening opposing positions in order to compress the spread between the two markets.
If, at that moment, a large participant has already completed position accumulation through the absorption of opposing liquidity, the combined pressure from institutional limit orders and HFT algorithms can trigger a sharp reversal in price.
This type of mechanism is often what creates long wicks and liquidity sweeps.
Spot vs Futures Divergence
At this point, you are probably asking yourself:
Imagine a situation where identical lows were formed on both the underlying asset and the futures contract.
Then price sweeps the low on the futures contract, while the underlying asset itself does not form a new low.
After that, price begins showing signs of reversal.
A situation like this may indicate that a large participant is interested in accumulating a long position.
Why?
Because the fact that the low was not broken on the underlying asset may suggest that aggressive selling pressure on the spot market was insufficient to continue a meaningful decline.
At the same time, the futures market did sweep the low, which was most likely accompanied by a cascade of long liquidations.
If price then fails to continue aggressively lower and instead begins reversing, this may indicate that the forced selling coming from liquidated long positions was absorbed by opposing demand from a large participant.
In other words:
• the crowd is forced to sell through liquidations (Sell-side Liquidity taken)
• while the large participant absorbs that selling flow and accumulates a long position
Situations like this can serve as additional confirmation for your hypothesis regarding current price discovery and institutional participant behavior.
Delta Hedging and Market Maker Behavior
It is also important to recognize that Market Makers are not always directional participants.
In many cases, they act primarily as liquidity providers and are forced to hedge their own exposure.
For example, if market participants begin aggressively buying futures contracts, the Market Maker may end up with a significant short exposure.
To reduce risk, they are forced to buy the underlying asset on the spot market (Delta Hedging).
This creates additional upward pressure on price and can reinforce the existing trend.
As a result, a self-reinforcing cycle can emerge:
• growth in the spot market pulls futures higher through arbitrage
• rising futures prices increase speculative demand
• Market Makers are forced to buy spot for delta hedging
• the additional demand further accelerates price appreciation
Processes like these are capable of creating extremely aggressive trending moves until the system eventually finds a new liquidity equilibrium.
It is important to understand that no single participant fully controls the market. Price is formed through the interaction of many liquidity flows. However, large participants are capable of significantly influencing short-term price movements through capital size, algorithmic execution, and sophisticated liquidity management.
Enjoy!  Education
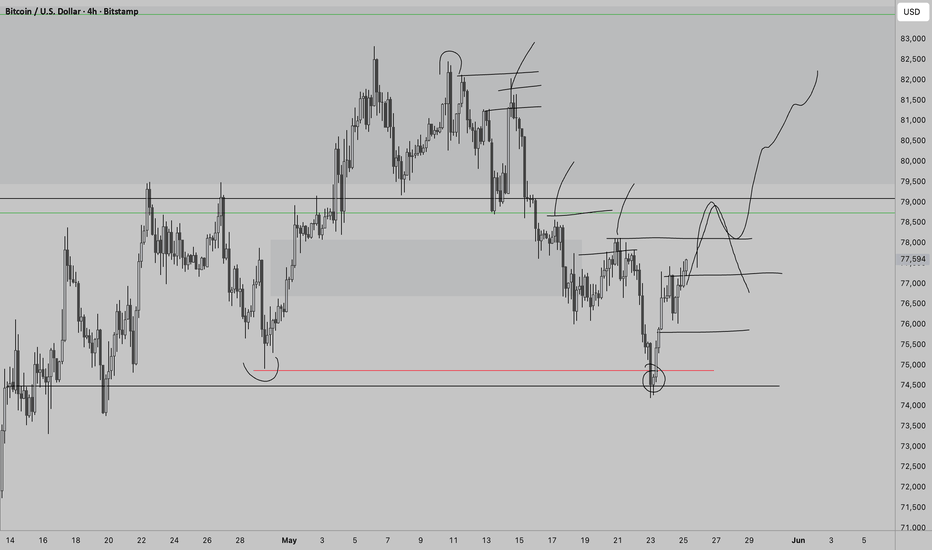
How To Analyse BTC Like an ICT TraderSimple, I go over how I analyse the charts every week. From Weekly all the way down to the 4HR.
I use:
- Orderblocks
- Fair Value Gaps,
- OTE Fib Levels
- Liquidity
Hit the follow if you find this video useful and if you'd like more of it.
⚠️ Disclaimer:
I am not a financial advisor. The content shared on this channel is for educational and informational purposes only and should not be considered financial or investment advice.
Trading and investing in cryptocurrencies involves significant risk, including the potential loss of some or all of your capital. This is especially true when using leverage, margin, or futures products, which may not be suitable for all participants.
Any strategies, trade examples, or market commentary presented are for educational purposes only and are based on personal opinions, experience, or hypothetical and historical examples. Past performance does not guarantee future results.
Always conduct your own research and consider consulting a licensed financial professional before making any financial decisions. Never trade with money you cannot afford to lose.
By viewing this content, you acknowledge that you understand the risks involved and agree that Trader Alchemist is not responsible for any financial decisions or losses you may incur. Education