Ripple News: Court Clears $130M Ripple Share SaleLinqto has received U.S. Bankruptcy Court approval to sell approximately $130 million worth of private Ripple shares. The pre-IPO investment platform continues its Chapter 11 restructuring. This deal is part of a wider recovery process for thousands of customers who invested in private companies through the platform.
Major Institutions Buy Ripple Shares
The reported transaction includes Galaxy Digital buying $60 million in Ripple shares. Arrington Capital is buying $50 million. The Private Shares Fund is buying $16 million, and GAM Alternatives Lux is buying $4 million.
Ripple has reportedly waived its right of first refusal, allowing the transfers to proceed. The deal reflects continued institutional demand for exposure to Ripple’s private-market valuation. However, it does not mean Ripple is going public. The transaction has no direct impact on XRP holders or XRP ownership.
The proceeds will support customer recoveries as Linqto winds down its operations.
Linqto Bankruptcy Plan Was Backed by Customers
Linqto filed for Chapter 11 in July 2025 after new management uncovered potential securities-law violations dating back to 2020. This included issues involving the structure of special-purpose vehicles used for customer investments.
The platform had already shut down in March 2025. Its bankruptcy case involves investments linked to around 111 private companies, with the portfolio valued at more than $500 million.
On February 6, 2026, the court approved Linqto’s restructuring plan after roughly 95% of voting customers supported it. The plan offered customers recovery through a liquidating fund holding indirect private-company interests. Alternatively, it offered a publicly listed closed-end fund holding private shares, or a combination of both options.
Forge Dispute Threatens to Delay Customer Recoveries
The recovery process has now run into another legal challenge. According to Bloomberg Law, Linqto and its creditors have sued Forge Global Holdings. The private-market platform allegedly attempted to withdraw as trustee of the customer recovery trust just five days before Linqto planned to launch the trust on July 20.
Forge was expected to hold customer assets, manage transfers and help administer the recovery plan. According to the complaint, Forge cited demands from its new parent company, Charles Schwab, for its decision to back out.
Linqto and the Official Committee of Unsecured Creditors are asking the bankruptcy court to force Forge to honor its agreement. They want Forge to continue serving as trustee.
The dispute could delay asset transfers, increase legal costs and slow customer recoveries. For Linqto users with indirect exposure to Ripple, the case is about how and when their assets are administered. It is not about the validity of Ripple shares or the value of XRP itself.
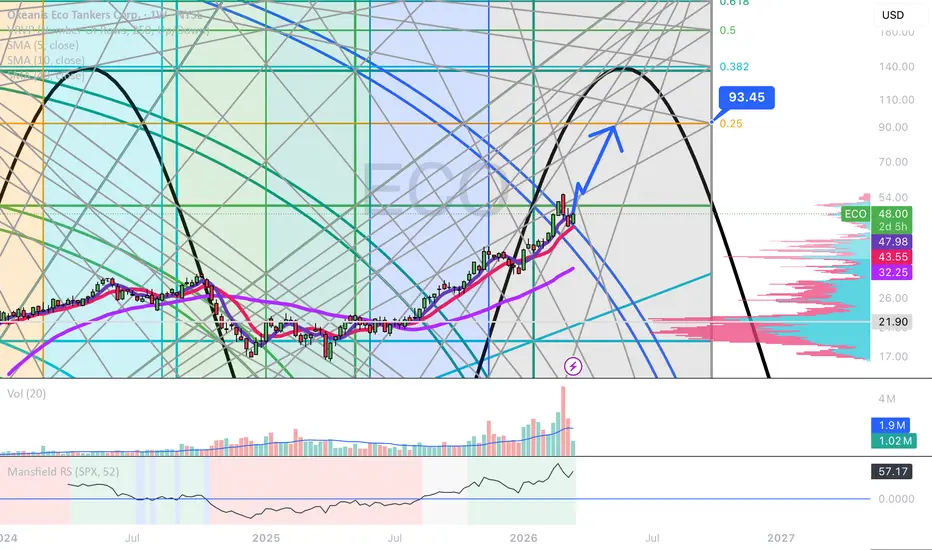
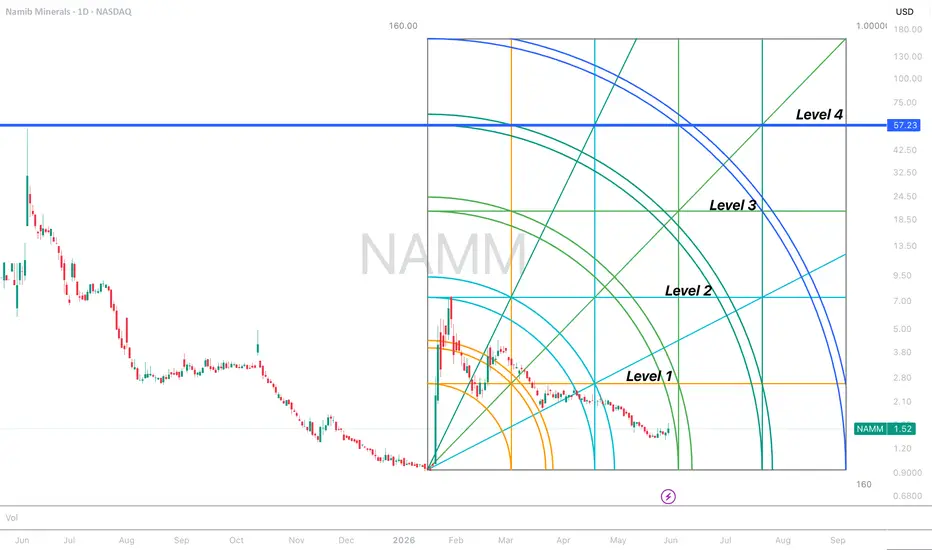
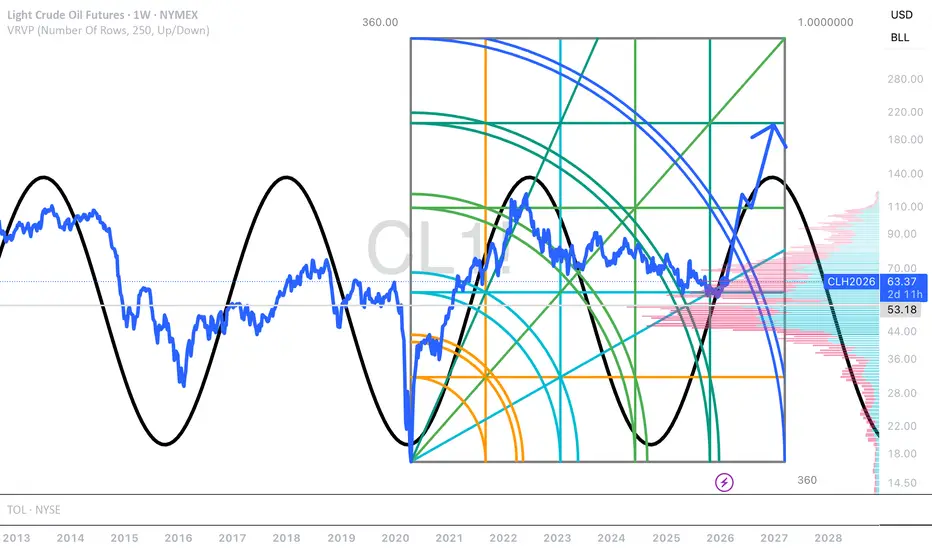
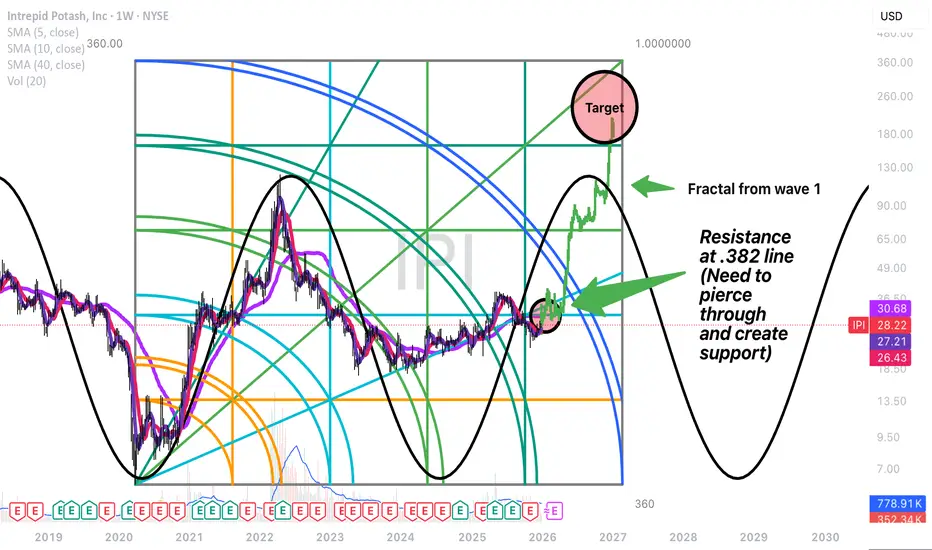
Gann Square
WuBlockchain Highlights Bitcoin Mining StrugglesWuBlockchain reports that Bitcoin has traded below its estimated production cost for five consecutive months, according to JPMorgan. This situation has left approximately 20% of Bitcoin miners unprofitable, raising concerns about the sustainability of mining operations in the current economic climate. The full details can be found in the original tweet from WuBlockchain.
Market Snapshot
The current state of Bitcoin mining reflects a significant downturn in profitability. Amid a wave of selling pressure across the crypto market, Bitcoin’s trading price has consistently lingered below the estimated production cost of about $78,000. This stark reality underscores the challenges miners face as they navigate a difficult economic landscape. Many miners are now grappling with the harsh consequences of these conditions, which could lead to a shake-up in the mining ecosystem as some are forced to halt operations or seek more efficient methods of mining to remain viable.
Bitcoin mining has always been a critical aspect of the cryptocurrency ecosystem, serving both to secure the network and to introduce new coins into circulation. However, the current regulatory pressures and economic conditions have raised numerous questions about the industry’s future. Historical trends show that profitability in mining is closely tied to Bitcoin’s market price, and the recent downturn poses serious implications for miners who operate on slim margins.
What Traders Are Watching Next
As traders and market observers analyze this situation, they should keep an eye on Bitcoin’s price action relative to its production costs. Future developments may include potential innovations in mining technology or shifts in energy consumption practices that could alter profitability dynamics. Additionally, market sentiment could shift as discussions around mining regulations and environmental concerns become more prominent. Understanding these factors will be crucial for traders looking to navigate the evolving landscape of Bitcoin mining.
This article is for informational purposes only and does not constitute financial advice. Please conduct your own research before making investment decisions.
BITCOIN VS USD DAILY CHART ANALYSISFirst of all, I would like to introduce myself. I am an intraday trader, and all my calculations are based on intraday trading But I thought I would help people in the trading view community in the long run by sharing some analysis in the community and become a supporter of this Trading view Publish idea.
I have analyzed the Bitcoin chart on a 1-day timeframe and identified two important price levels; based on fibonacci , there is a likelihood of the market finding strong support.
CLSK — Diamond Breakout, Earnings Monday, AI HyperscalerCLSK — Diamond Breakout, Earnings Monday, AI Hyperscaler Pivot Catalyst
Direction: Long
Timeframe: 1H
Description:
Spot: $14.20 (+0.64%). CleanSpark trades inside a clean ascending parallel channel after breaking out of the Diamond Pattern at the late-April reversal zone. Earnings drop Monday May 11 at 4:30 PM ET — the binary catalyst.
The chart's projection: $16.20 by mid-May. That aligns with Needham's $18 PT and the 1.618 fib at $16.42. Catalyst stack supports the path.
The pattern:
🪨 Diamond Pattern broke out around $11-$13 zone late April / early May — high-probability continuation pattern after the multi-week consolidation
🪨 Ascending parallel channel confirmed by 3-touch upper rail, multi-touch lower rail
🪨 Fib structure:
0.236: $9.27 (multi-touch demand)
0.5: $10.64 (channel midline base)
1.0: $13.22 (recent swing high reclaimed)
1.236: $14.44 (current zone)
1.382: $15.19 (next near-term level)
1.5: $15.81
1.618: $16.42 (primary target)
1.786: $17.28
1.854: $17.64
2.0: $18.39 (Needham PT alignment)
🪨 Channel projection: Upper rail extends to ~$22 by June if the slope holds
🪨 System signals: Multi-touch BUY confirmations on Apr 27 / May 1. Consistent TP firings through the climb.
Macro / fundamental backdrop:
🪨 Earnings: Q2 FY26 reports Monday May 11 at 4:30 PM ET
🪨 Consensus expectations:
Revenue: $152.32M (down 16% sequentially)
EPS: -$0.41 (loss, narrower than prior -$1.35)
EPS estimates UP 24.59% over 60 days (analyst optimism on profitability)
🪨 April 2026 operational metrics (released May 6):
640 BTC produced (avg 21.33/day, peak 22.38)
Operational hashrate: 50.0 EH/s
1.8 GW under contract
808 MW utilized (capacity expansion ongoing)
BTC holdings: 13,453 as of April 30
April BTC sale avg price: $74,807
CY2026 production: 2,439 BTC
🪨 The AI pivot — the structural re-rating:
Needham raised PT from $17 to $18 on May 4 after meeting with CLSK management. The catalyst: CleanSpark indicated advanced discussions with a direct investment-grade hyperscaler customer for its Sandersville, Georgia site.
CEO Matt Schultz: "Evolving into a comprehensive compute platform that is prepared to optimize value from both AI and bitcoin workloads."
A signed hyperscaler contract would re-rate CLSK from "Bitcoin proxy" to "AI infrastructure host." Power capacity + utility relationships at low-cost grids = exactly what hyperscalers need for AI training buildouts.
Analyst picture:
🪨 12 of 12 analysts: Strong Buy
🪨 Mean PT: $19.29 (+36% from current $14.20)
🪨 Needham: $18 (raised May 4)
🪨 Bull thesis: Power scarcity + AI re-rating + diversification away from BTC swings
🪨 Bear thesis: BTC margin compression + signed deal not yet done + capex/debt
Trade plan:
🪨 Patient entry: $13.22 zone (channel midline retest, 1.0 fib)
🪨 Aggressive entry: $14.20 current with stop $13.07 (recent BUY confluence)
🪨 Pre-earnings entry: Sized small — $14.20 with stop $13.50 (binary risk acknowledged)
🪨 T1: $14.44 (1.236 fib, current resistance)
🪨 T2: $15.19 (1.382 fib)
🪨 T3: $15.81 (1.5 fib)
🪨 T4: $16.42 (1.618 fib + chart projection target + within Needham PT range)
🪨 T5: $18.00 (Needham PT)
🪨 T6: $19.29 (analyst consensus)
🪨 Stretch: $22+ (channel upper rail by June if slope holds)
🪨 Invalidation: 1H close below $13.07 = channel break, structure broken
Risk framework:
🪨 R:R from $13.22 patient entry / $13.07 stop to T4 ($16.42): ~21:1 (extreme asymmetry IF you wait)
🪨 R:R from $14.20 current / $13.07 stop to T4 ($16.42): ~2.0:1
🪨 R:R from $14.20 / $13.07 to T5 ($18.00): ~3.4:1
🪨 R:R from $14.20 / $13.07 to T6 ($19.29): ~4.5:1
🪨 The patient entry on a pullback to $13.22 dramatically improves R:R. Pre-earnings at $14.20 trades convenience for binary risk.
Earnings binary framing:
The Monday print is the catalyst. Three scenarios:
🪨 Beat + signed hyperscaler announcement: $16-$18 gap up. Re-rating accelerates.
🪨 In-line + hyperscaler progress disclosure: Steady $14-$15 zone, AI narrative compounds
🪨 Miss + no hyperscaler clarity: Channel break to $12-$13 zone, structure resets
Implied move on weeklies historically: 8-12% post-print for CLSK. Position size accordingly.
Wave / projection truncation honesty:
The Diamond Pattern + ascending channel + fib structure align bullish. The $16.42 target is structurally justified by 1.618 fib + chart projection + Needham PT confluence. The $19.29 consensus is the analyst stretch. The $22+ channel upper rail is a slope projection — these always require continuation of momentum that may not materialize.
The first leg ($14 → $16.42) is the testable trade. Beyond that needs the hyperscaler signing event to confirm.
I cannot see the future. I can see the channel, the fib, the catalyst calendar, and the analyst alignment.
The thesis simply stated:
CleanSpark broke out of a Diamond Pattern. The chart trades inside a clean ascending channel. Earnings Monday is the binary. The AI pivot toward hyperscaler hosting is the structural re-rating thesis. Needham just raised PT after management meetings. 12 of 12 analysts rate Strong Buy. Mean PT 36% above current.
If the earnings call confirms hyperscaler progress, the chart pattern + the analyst alignment + the catalyst stack all converge. If it doesn't, the channel breaks and we re-evaluate.
Tags: CLSK, CleanSpark, Bitcoin, AI, hyperscaler, breakout, fibonacci, earnings, swingtrade, hourly
NFA. Process over prediction. Risk-first, always.
Prediction Markets A New Trend Trading The View of Valmors GroupFinancial markets continue to evolve rapidly, and with that evolution comes the emergence of new tools that are changing traditional approaches to trading. One such innovation is prediction markets — platforms where participants trade based on the outcomes of future events. Today, they are attracting growing attention from both professional traders and retail investors.
Valmors Group sees prediction markets as a promising direction that can complement traditional instruments while offering new ways to approach risk and returns.
Growing Interest in New Instruments
Interest in prediction markets is increasing as traders look for alternative ways to generate returns. Traditional markets are becoming more competitive, and margins are tightening, pushing participants to explore new formats.
Prediction markets offer a different approach. Instead of analyzing price movements, traders evaluate the probability of events. These events may include economic indicators, political decisions, or technological developments.
This format makes trading more accessible to a broader audience. It requires less technical chart analysis but encourages critical thinking and the ability to interpret information effectively.
Integration into Trading Platforms
As popularity grows, more platforms are integrating prediction markets into their ecosystems. This simplifies access and lowers the barrier to entry.
Valmors Group notes that integration goes beyond user interfaces. It also involves infrastructure development, leading to hybrid platforms that combine traditional trading with prediction-based markets.
This creates a more flexible environment where users can diversify strategies and manage risk more effectively.
New Opportunities for Traders
Prediction markets open up new opportunities. Traders can profit not only from price changes but also from the accuracy of their forecasts.
This is particularly valuable in highly volatile conditions, where traditional instruments may become less predictable. Working with probabilities provides an additional layer of decision-making.
In addition, popular events often generate strong liquidity, creating opportunities for short-term trading strategies.
Market Impact
The expansion of prediction markets is gradually influencing the broader financial ecosystem. They introduce a new layer of market sentiment that reflects collective expectations.
In some cases, these markets serve as indicators. The price of a contract can represent the perceived probability of an event, offering insight into market expectations.
Valmors Group believes that as this segment grows, its influence on investment decision-making will continue to increase.
Technological Development
Technology plays a key role in the evolution of prediction markets. Blockchain, smart contracts, and decentralized platforms improve transparency and accessibility.
Automation reduces the risk of manipulation and increases user trust. At the same time, advanced analytics tools help participants better evaluate probabilities and make informed decisions.
Technology also supports the global nature of these markets, allowing users from different regions to participate on equal terms.
Conclusion
Prediction markets are not just a new tool — they represent a shift in how trading is approached. The focus moves from price analysis to probability assessment, opening new opportunities for market participants.
Valmors Group believes that these formats have the potential to reshape the traditional structure of financial markets. In a rapidly changing environment, flexibility and willingness to adopt new tools are becoming essential for success.
As technology advances and user interest grows, prediction markets are well positioned to become a significant part of the modern financial ecosystem.
C
TCS - DAILY bounce against resistance zoneTCS - dAILY resistance Zone - if there is anything meaingful to this bounce, then immediate cluster of resistance zone from 2600-2700 is key watch and failure to hold and failure to hold one framing higher from recent balance break out makes it vulnerable for further pullback to watch symmetry/.618 level to check if balance break out from the recent holds vs continued to trade sideways is key to monitor from here.
OKX Launches Agentic Wallet For AI-Driven On-Chain TransactionsOKX has unveiled its Agentic Wallet as part of a broader push into AI-integrated blockchain solutions, marking a notable step toward automation in Web3. The wallet is designed to enable AI agents to perform tasks that traditionally required human involvement, including analyzing blockchain data, executing trades, and managing digital assets.
One of the defining features of the Agentic Wallet is its multi-chain capability. The system supports around 20 different blockchain networks, allowing users and developers to manage assets across ecosystems through a unified interface. This eliminates the need to switch between multiple wallets or platforms, simplifying operations in an increasingly fragmented blockchain landscape.
The wallet operates through a command-line interface, enabling AI agents to interpret and execute user-defined instructions. This setup allows automation of complex workflows such as token swaps, portfolio adjustments, and transaction execution. By reducing manual input, the system aims to improve efficiency and speed in handling blockchain operations.
Security remains a central focus of the platform. Before executing any transaction, the wallet simulates the operation and conducts risk assessments. These checks help detect potential vulnerabilities, including smart contract risks or unfavorable trading conditions. By integrating these safeguards, the platform seeks to minimize risks associated with automated decision-making and enhance user confidence in AI-driven processes.
Implications for AI and Web3 Integration
The launch of the Agentic Wallet reflects a broader trend of integrating artificial intelligence into decentralized ecosystems. AI agents are increasingly being explored for their ability to automate trading strategies, manage portfolios, and interact with decentralized applications without constant human supervision. This evolution could significantly change how users engage with blockchain technology.
By enabling AI to directly execute transactions, platforms like OKX are pushing toward a more autonomous financial environment. Faster execution, data-driven decision-making, and reduced operational friction are some of the potential advantages. However, this shift also introduces new challenges related to system reliability, transparency, and security.
OKX Wallet
The wallet’s multi-chain functionality also highlights the growing importance of interoperability in the crypto space. Major ecosystems such as Ethereum and Solana continue expanding their capabilities, creating a competitive environment where seamless cross-chain interaction becomes increasingly valuable.
Despite the potential benefits, the adoption of AI-driven blockchain tools will depend on real-world performance and user trust. Automated systems must consistently deliver accurate and secure outcomes to gain widespread acceptance. Market participants are likely to monitor how effectively such solutions integrate into existing workflows.
For now, the Agentic Wallet represents an early but meaningful step toward more intelligent and autonomous blockchain interaction. As both AI and decentralized technologies continue evolving, their convergence could play a key role in shaping the next phase of digital finance.
Gu trend flipping short?Gu currently dropping below my important 2 line (red) 20 week zone here which is indicating a bearish sign at least for the next coming week. The blue lines on my chart indicate another cycle at play that moves faster than the red one that also indicates the nearest line as resistance at 1.36599 with a mirrored angle at 1.34199. Although I do not need the full move to finish my phase 1 challenge, there is a likelihood that 1.34199 will be touched this week but I will only be aiming for the break of the previous week low. Finally we have the white lines that we can find at least 1- 2 entries a day that show up everyday but when you have 2 white lines such as these that are moving this close together it usually indicates a larger reversal is underway. Often times the chart may find confluence between the white support and resistance lines and the larger ones that line up either perfectly or within pips of each other. I am a seller at 1.36550 with a stop at 1.368 targeting last weeks low. If it does move higher than that for some reason then my alt short will be at 1.368 stops at 1.370 still targeting last weeks low at least! Good luck and happy trading!
$ONDS Gann square analysisThe 45 degree pivot line on the weekly chart has historically been the zone of greatest resistance for $ONDS. With the recent breakout NASDAQ:ONDS is ascending toward this zone once again. I'll be looking for momentum to carry us above this line in order to carve out support.
DO YOUR OWN RESEARCH; THIS IS NOT INVESTMENT ADVICE.
Gann time and price HBR The swing high is at 333.8. Price then fell to the swing low at 144 in 332 days. You can see the symmetry in price and time.
I have marked the square up on the chart back at 333.8 in 335 days.
Price has a lot of work to do in next 90/100 days. This falls in line with ganns idea of price acceleration in the last phase of swing.
The company has recently been on a purchasing spree to expand its reach into the gulf of America.
They have also been buying back shares.
XAUUSD 1h chart levels for the coming week 24 to 28 November
FOREXCOM:XAUUSD
Hey Everyone,
Please see My updated 1h chart levels and targets for the coming week 24 to 28 November
The price closed on 4065 so If the price BREAKOUT UP this area for will open 4093.
The 4061 & 4067 reversal zone and key decision points; if breached, it becomes the path to 4125.
Weekly close at a 90-degree angle from the peak of 4036
If it breaks through with momentum, it will head towards 4004-3998 as it shown on the chart
The week should move like this
Monday should move to 135° degrees (down to 4036 or up to 4093)
Tuesday 150° degrees (if it moved down we will see 4006 & if up will see 4102) First move 150° and We will see rejection of a Strong price when the (moon & sun & Mercury meet I call it = Test Price Day)
Wednesday 160° degrees ((if it moved down we will see 4004 & if up will see 4125 and then 4157) If the price touches the 180-degree angle, it is heading towards a volatile day followed by a strong rise or fall.
Thursday 170° degrees (the price will move between 4125-4157) and if the price moved down wee will move 225° degrees between 4036-4006) A day approaching the peak or undermost, not a reversal day.
Yousif
H-k-O-r-E
The secret to winning in gold trading! About your mindset!This article does not cover strategies. For trading, please refer to the previous article.
Gold Trading Mindset: Gold trading mindset is a key factor in determining trading success or failure. Here are some key points and tips about gold trading mindset to help you better navigate market fluctuations:
Overcoming Greed and Fear
Greed: Avoid chasing rising prices and selling falling. Don't blindly increase your position or delay taking profits due to short-term gold price increases. Set reasonable take-profit targets and lock in profits promptly.
Fear: Avoid panic selling during market declines. If a trade fits your strategy, calmly assess the risks to avoid missing out on rebound opportunities due to short-term fluctuations.
Accepting losses is normal. The gold market is highly volatile and losses are part of the cost of trading. Don't let a single loss get you emotionally upset. Instead, focus on the long-term effectiveness of your overall trading strategy. Strictly implement stop-loss rules and control the scope of losses.
Maintain patience and discipline. The gold market is often in a volatile or trendless state, so you need to wait patiently for clear trading signals. Avoid frequent trading to minimize emotional interference. Develop and strictly adhere to a trading plan, and don't change it arbitrarily due to short-term market fluctuations.
Avoid blindly following the crowd. Don't trade impulsively based on the actions of others or market sentiment. Gold prices are influenced by multiple factors, requiring independent analysis of fundamentals and technicals to form your own judgment.
View market fluctuations rationally. Short-term fluctuations in gold prices may be influenced by geopolitical factors, economic data, and other factors, but long-term trends are determined by supply and demand and macroeconomic trends. Don't be misled by short-term fluctuations and maintain a long-term investment perspective.
Manage your funds effectively to control the risk of individual trades. It is recommended that losses on individual trades should not exceed 1%-2% of your total capital. Operating with a small position can reduce psychological stress and promote a more stable mindset.
Continuously study and review your trading experiences regularly, analyzing the reasons for success and failure. Improve your understanding of the market by studying macroeconomics and technical analysis methods.
Gold trading is not just a battle with the market; it's also a battle with your own emotions. Maintaining a calm and rational mindset, and combining trading strategies with mindset management, is the key to achieving stable profits in long-term trading.
If you find it helpful after reading this article, please like and support it, or share it with other friends. We will update trading strategies and trading skills every day!