LWLG Daily Short Trading PlanLWLG Daily Short Trading Plan
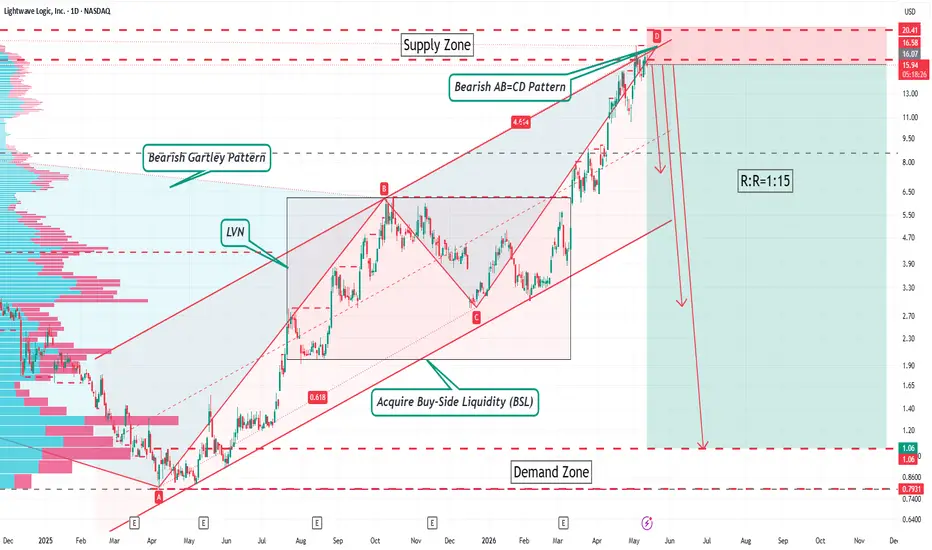
Symbol: LWLG
Timeframe: Daily
Direction: Short
Entry Price: 16.07
Stop Loss: 20.50
Take Profit & Position Management
1. First Target: 7.30 - Reduce half position, move stop loss to breakeven
2. Second Target: 2.80 - Reduce half of remaining position, adjust protective stop loss
3. Third Target: 1.00 - Reduce half of remaining position, adjust protective stop loss
4. Final Position: Hold remaining position with trailing stop loss
Risk Disclaimer
US stock trading faces huge price volatility, unexpected fundamental news and abnormal market fluctuations. All trades carry great investment risks. Please strictly abide by stop-loss rules, control position size reasonably and avoid reckless trading.
Gartley
SOL/USDT 4H Trading PlanSOL/USDT 4H Trading Plan
Trading Pair: SOL/USDT
Time Frame: 4-Hour
Trade Bias: Short
Entry Price: 95.20
Stop Loss: 98.00
Take Profit Levels & Position Management
1. First Target: 89.50
Close half of the position and move stop loss to protect profits.
2. Second Target: 84.50
Reduce position again and continue trailing the stop loss.
3. Third Target: 78.50
Cut more position and keep trailing stop loss for the remaining lots.
4. Remaining Position:
Follow the market trend with continuous trailing stop loss.
Risk Disclaimer
Cryptocurrency markets are highly volatile with risks of false breakouts, price spikes and liquidity slippage.
Strictly execute stop loss without holding losing positions or modifying the trading plan arbitrarily.
Exit immediately if the technical structure and trading setup are invalidated.
This analysis is for reference only and does not constitute any investment advice.
HYPE/USD H4 Short Trade PlanHYPE/USD H4 Short Trade Plan
Instrument: HYPE/USD
Timeframe: H4 (4 Hour)
Trade Bias: Short Sell at 50% retracement of large bearish candle
• Entry: Around 44.04962499
• Stop Loss: Around 45.75700780
• TP1: 41.46884020 → Close 50% position, move SL to break-even
• TP2: 39.39286670 → Reduce position, adjust SL to lock profit
• TP3: 36.450688778 → Partial exit, trail stop loss for profit protection
• Remaining position: Hold with trailing stop protection
Risk Disclaimer
Cryptocurrency trading carries extremely high volatility and unpredictable market risks. Sharp price swings, liquidity risks and regulatory changes may cause sudden losses. All analysis is for educational purposes only, not investment advice. All trading profits and losses shall be borne by traders personally.
MERL Daily Chart Short Trading PlanMERL Daily Chart Short Trading Plan
Basic Information
• Trading Asset: Mears Group PLC
• Timeframe: Daily timeframe, swing trading
• Expected holding duration: 3–8 weeks (1–2 months)
• Trade Direction: Short
Entry & Exit Levels
• Entry: Near 402.0
• Stop Loss: 422.0
Exit immediately once stop loss is triggered.
• TP1: Near 368.50
Close half position, move protective stop to break-even.
• TP2: Near 347.0
Close half remaining position, raise protective stop further.
• TP3: Near 322.00
Close half remaining position, tighten trailing stop loss.
• Remaining Position: Hold with dynamic trailing stop, no fixed final target.
Risk Warning
US stock market is heavily impacted by macro events, market volatility and corporate fundamental news.
Bearish structure fails if stop loss broken. Always execute stop loss strictly, never average down losing positions.
Manage position size properly for long-term swing trades. Do not over-allocate capital into single stock.
Follow position reduction and trailing stop rules strictly. Lock profits and control risks, never alter levels impulsively.
Trading Discipline
Follow planned levels rigidly. Adjust protective stop promptly after every partial exit.
Protect principal capital and secured profits steadily.
NZDUSD 4H Trading PlanNZDUSD 4H Trading Plan
Trading Instrument: NZDUSD
Timeframe: 4 Hours
Current Price: 0.59654
Long Trade Setup
1. Wait for price to break above 0.59915 and complete Sweep SSL Liquidity (sell-side liquidity sweep).
2. Enter long position after bullish confirmation, price must not break below 0.59539 to form a valid Structure Flip support.
3. Take Profit: Target at the completion zone of Bearish Gartley Pattern & Bearish AB=CD Pattern, near 0.60570.
Subsequent Short Trade Setup
After price reaches the TP level 0.60570, prepare for reverse short position trading.
Initiate short setup based on bearish reversal confirmation at the harmonic pattern completion zone, following daily trend structure and supply zone resistance.
Risk Warning
1. Market structure may shift unexpectedly, and false breakout & liquidity hunt may occur at any time. Strictly abide by risk management rules.
2. Do not overtrade, and strictly set stop loss for both long and short positions to control single-trade risk.
3. This trading plan is only for technical analysis and pattern reference, not investment advice. Please trade at your own risk.
RTX Daily Long Trading PlanRTX Daily Long Trading Plan
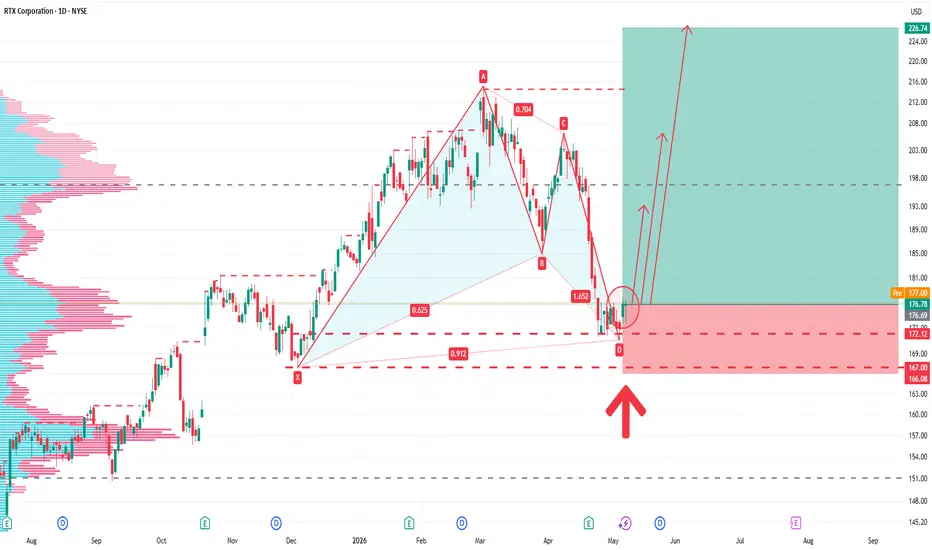
Stock Symbol: RTX (Raytheon Technologies)
Timeframe: Daily
Trading Direction: Long
Entry Price: Around $176.78
Stop Loss: $166.00
TP1: Around $195.00
Close 50% position, move stop loss to breakeven.
TP2: Around $208.00
Close half of remaining position, trail stop loss to lock profits.
TP3: Around $225.00
Reduce half of leftover position, continue trailing stop protection.
Remaining Position: Hold with trailing stop loss and follow market trend to exit.
Risk Warning
U.S. stock market is affected by geopolitics, Federal Reserve monetary policy, corporate earnings and macroeconomic data, with large price volatility. There exists risk of principal loss. Strictly abide by stop-loss discipline, do not arbitrarily adjust stop-loss levels or over-positioning. This plan is only technical reference, not investment advice. All transactions shall be based on personal risk tolerance.
XAGUSD TP 88.85On the daily chart, XAGUSD has stabilized and is trending upward, with short-term bullish forces holding the advantage. Currently, attention should be focused on the resistance level near 83.05; a breakout above this level would likely pave the way for further gains, with an upside target set around 88.85. Should the price reach the vicinity of 88.85, watch for the potential formation of a bearish Gartley pattern.
BULLISH GARTLEY IN PPL PHARMAEducational Guide: Understanding the Bullish Gartley Pattern
This chart features a classic technical analysis setup known as the Bullish Gartley. Developed by H.M. Gartley, this harmonic pattern uses specific Fibonacci ratios to identify high-probability reversal zones.
Let’s break down the mechanics of what we see on this monthly chart for Piramal Pharma.
1. The Anatomy of the Pattern (X-A-B-C-D)
The Gartley pattern is composed of four distinct "legs" that form a shape resembling an "M".
The XA Leg (The Foundation): This is the initial strong move up from the bottom (Point X) to a local peak (Point A). It sets the scale for the entire pattern.
The AB Leg (The First Correction): Price drops from A to B. In a textbook Gartley, this retracement should be approximately 61.8% of the XA leg.
The BC Leg (The Minor Recovery): Price bounces back slightly. This move should ideally stay within 38.2% to 88.6% of the previous AB leg.
The CD Leg (The Completion): This is the final leg down to Point D. This is where the "magic" happens.
2. The Potential Reversal Zone (Point D)
Point D is known as the Potential Reversal Zone (PRZ). This is not just a random guess; it is calculated where two Fibonacci levels converge:
A 78.6% retracement of the entire XA leg.
A 127% to 161.8% extension of the BC leg.
When price hits Point D, technical traders look for bullish confirmation—like the green candle we see currently forming—to signal that the correction is over and the primary uptrend is ready to resume.
3. Trade Management Strategy
Educational analysis isn't just about finding the pattern; it's about managing the risk:
Entry: Traders typically look to enter "Long" at or near Point D once bullish price action is confirmed.
Stop Loss: The "invalidated" point for this pattern is Point X. If the price drops below X, the bullish thesis is no longer valid.
Targets (Take Profit): Common targets for this setup are the Fibonacci levels of the AD leg—specifically the 38.2%, 61.8%, and eventually the Point C peak.
Why it Matters on a Monthly Chart
Because this is a Monthly Timeframe, the pattern takes years to form. This suggests a long-term "macro" shift in the stock's trend. While smaller fluctuations will happen daily, the Gartley provides a "big picture" roadmap for investors.
Key Takeaway: Harmonic patterns like the Gartley help remove emotion from trading by providing specific, math-based entries and exits based on historical market symmetry.
Disclaimer: This post is for educational purposes only. Technical patterns provide probabilities, not guarantees. Always use stop-losses and practice proper risk management.
INNOVA CAPTABInnova Captab Ltd. (CMP ₹734.65, NSE: INNOVACAP)
A fast‑growing pharmaceutical company, incorporated in 2006, headquartered in Himachal Pradesh. Innova Captab operates across contract manufacturing, branded formulations, and exports, with a strong presence in domestic and international markets.
Promoter Holding (Dec 2025): Founding group — majority stake
---
FY22–FY26 Snapshot
- Revenue Growth: Q3 FY26 revenue ₹4,502.93 million (+~20% YoY). → Good
- Net Profit: Q3 FY26 PAT ₹421.49 million, strong profitability. → Good
- Operating Margin: Profit before tax ₹556.77 million, margin expansion visible. → Good
- Equity Capital: Stable post listing. → Good
- Dividend Policy: Interim dividend of ₹2 per share declared (Jan 2026). → Good
- Asset Building: Expansion in manufacturing facilities and product portfolio. → Good
- Sales: FY26 run‑rate indicates >₹18,000 Cr annualized revenue. → Good
- Expense: Input cost pressures manageable, efficiency gains offset. → Neutral
- EPS: TTM EPS ~₹23.1, reflecting strong earnings. → Good
---
Institutional Interest & Ownership Trends (Dec 2025)
- Promoter Holding: Majority stake retained.
- FII Holding: Growing interest post IPO.
- DII Holding: Stable participation.
- Retail & Others: Active trading volumes (~80,000 shares/day).
---
Strategic Moves & Innovations
- Expansion in contract manufacturing and branded formulations.
- Investments in new therapeutic segments.
- Focus on export markets and regulatory approvals.
- Strengthening R&D capabilities.
---
Cash Flow & Balance Sheet Strength
- Strong operating cash flows supported by rising sales.
- Debt levels moderate, balance sheet conservative.
- Dividend payout signals confidence in financial strength.
---
Risk Factors
- Dependence on regulatory approvals and compliance.
- Exposure to raw material price volatility.
- Competition from domestic/global pharma players.
- Execution risks in scaling exports.
---
Investor Takeaway
Innova Captab has delivered robust revenue growth, margin expansion, and shareholder rewards via dividend, supported by strong promoter control and conservative balance sheet. With ongoing investments in manufacturing and exports, the company is well‑positioned for long‑term growth. Investors should monitor regulatory risks and input costs, but the outlook remains positive for long‑term holders.
Motorola Solutions, Inc. (MSI) – Long Setup Technical AnalysisMotorola Solutions, Inc. (MSI) – Long Setup Technical Analysis
MSI is currently trading above the Anchored VWAP, where a bullish Gartley harmonic pattern has formed precisely at the main Anchored VWAP level. This alignment highlights a technically clean value-based reaction zone, with price respecting volume-weighted fair value.
The Gartley structure suggests a controlled corrective move within an intact bullish framework, rather than distribution. The precise interaction with the Anchored VWAP reinforces the view that institutional participants are defending this level, maintaining constructive market structure.
From a tactical perspective, this configuration favors a long continuation setup. As long as price maintains acceptance above the main Anchored VWAP, the probability favors a renewed upside rotation toward prior highs and upper value areas.
Bias: Long on bullish reaction at the Anchored VWAP
Target: Upside continuation toward prior highs
Invalidation: Sustained acceptance below the Anchored VWAP
Context: Bullish Gartley completion + Anchored VWAP support = high-quality long setup
Ethereum Sees Sharp Drop In USDT And USDC UsageStablecoin activity on the Ethereum network has dropped to its lowest level in 2026. This shift has caught the attention of analysts and traders across the crypto space. Data from Santiment highlights a steady decline in transaction volume and wallet interactions involving USDT and USDC. This trend signals a potential cooling phase in the broader market.
Investors often rely on stablecoins as a gateway into crypto assets. When stablecoin activity slows, it usually reflects reduced buying intent. This decline does not happen in isolation. It connects closely with market sentiment, liquidity flows, and trading behavior across exchanges.
The drop in stablecoin activity comes at a time when market participants expected renewed momentum. Instead, the Ethereum network shows signs of reduced engagement. This change raises concerns about short term demand and overall crypto buying power.
Why Stablecoin Activity Matters In Crypto Markets
Stablecoins play a critical role in the crypto ecosystem. They act as a bridge between fiat currency and digital assets. Traders use them to enter and exit positions quickly without relying on traditional banking systems. This makes stablecoin activity a strong indicator of market health.
When stablecoin activity rises, it often signals incoming capital. Traders prepare to deploy funds into assets like Bitcoin or Ethereum. On the other hand, falling activity suggests hesitation. Investors may hold back due to uncertainty or lack of confidence.
The current decline in stablecoin activity reflects a cautious market environment. Traders appear less aggressive in deploying capital. This trend impacts liquidity across exchanges and reduces volatility in the short term.
USDT And USDC Trends Reflect Changing Investor Behavior
USDT and USDC trends provide valuable insights into market dynamics. These stablecoins dominate trading pairs across major exchanges. Changes in their usage directly affect liquidity and price movements.
Recent data shows fewer transfers and lower circulation velocity for both assets. This suggests traders hold stablecoins instead of actively using them. Such behavior often appears during uncertain market phases.
Crypto buying power depends heavily on stablecoin availability and movement. When investors pause activity, it limits the market’s ability to rally. This creates a cycle where low activity leads to reduced price action.
What This Means For The Short Term Market Outlook
The current decline in stablecoin activity does not necessarily signal a long term downturn. Instead, it highlights a temporary pause in market momentum. Such phases allow markets to reset before the next move.
Investors should watch Ethereum network usage closely. A recovery in activity could signal renewed interest and capital inflows. Similarly, rising USDT USDC trends would indicate stronger buying intent. Market cycles often include periods of low activity. These phases test investor patience and confidence. Understanding these patterns helps traders make informed decisions.
Final Thoughts On The Current Market Phase
The drop in stablecoin activity highlights a cautious market environment. Investors appear to wait for clearer signals before committing capital. This behavior has reduced crypto buying power and slowed Ethereum network usage.
While the short term outlook remains uncertain, such phases often create opportunities. Traders who track stablecoin trends can gain an edge. Monitoring these indicators helps identify potential market reversals. A recovery in stablecoin activity could quickly change sentiment. Until then, the market may continue to move with limited momentum.