EURAUD: Pullback From Support 🇪🇺🇦🇺
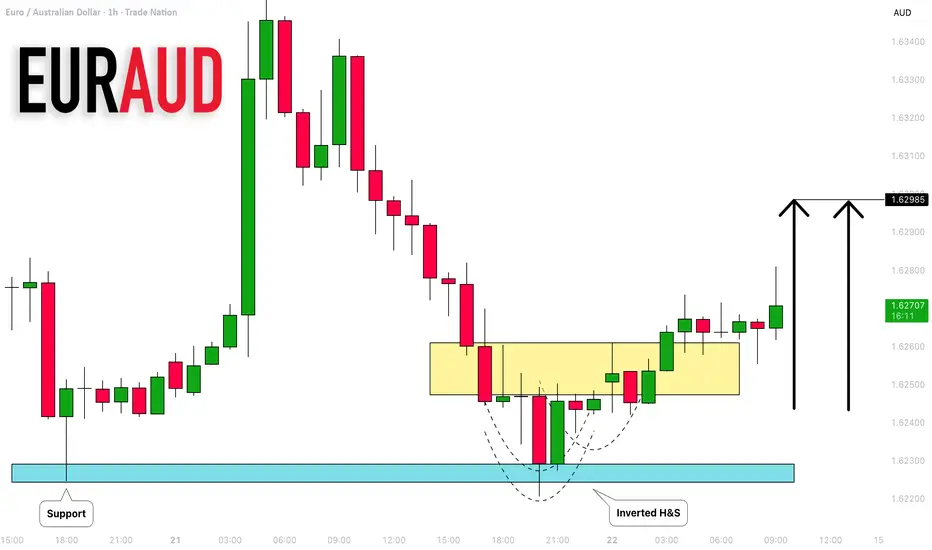
EURAUD will likely pull back from a strong intraday support
after a breakout of the neckline of an inverted h&s pattern on an hourly time frame.
Expect a bullish movement to 1.6299
❤️Please, support my work with like, thank you!❤️
I am part of Trade Nation's Influencer program and receive a monthly fee for using their TradingView charts in my analysis.
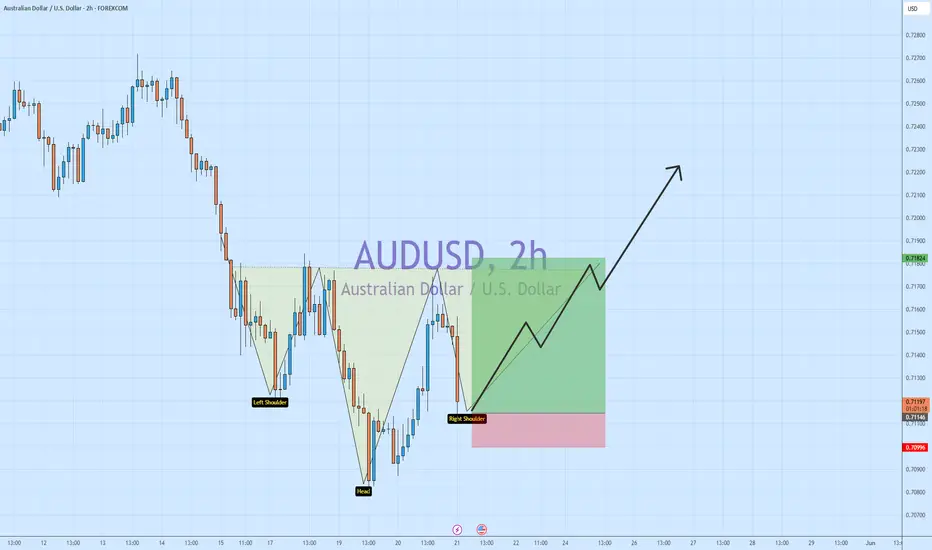
Head and Shoulders
NIFTY CORE HOUSING INDEX🏠 Nifty Core Housing – H&S Breakout Watch! 🏠
📊 Setup: Daily chart flashing a clean Head & Shoulders formation.
🔑 Current Price Range: 12,500 – 17,000.
🛡️ Support: Strong base at the Right Shoulder zone.
🚀 Upside Potential: Breakout above neckline could fuel a sharp rally.
💡 Why Traders Care:
Head & Shoulders is one of the most reliable reversal patterns.
Daily timeframe adds conviction to the move.
Buy/Sell signals lining up with the breakout zone.
⚡️ My Take: Nifty Core Housing is coiling
EURGBP has formed a potential Head and Shoulders top patternOn the weekly chart, EUR/GBP has formed a potential Head and Shoulders top pattern, indicating that short-term bearish sentiment prevails. Current support lies near 0.860; a break below this level would open up further downside potential, with downside targets set for the 0.835–0.845 zone.
DEEPAKFERTDeepakfert forming inverted head & shoulder pattern. The stock has already picked momentum and trading above all essential moving average. The result is on 26-May. Once it get market participation it gonna get next rally. Support seems near 1275. And pattern target can be seen near 1800. Keep it in yr watchlist.
Around 50% off from hereMy previous idea didnt turn out so well, after the massive rally from end of March! But still very much of the opinion that we will end up at the same place at 12/16k, due to the bigger picture as i see it. So around 50% off from current prices. Just somewhat delayed after that extra leg up.
Why? Index is still pricey. Less so that it has been in the past few years, but still elevated and priced for very a optimistic forward situation. But i still see the big picture remaining more or less the
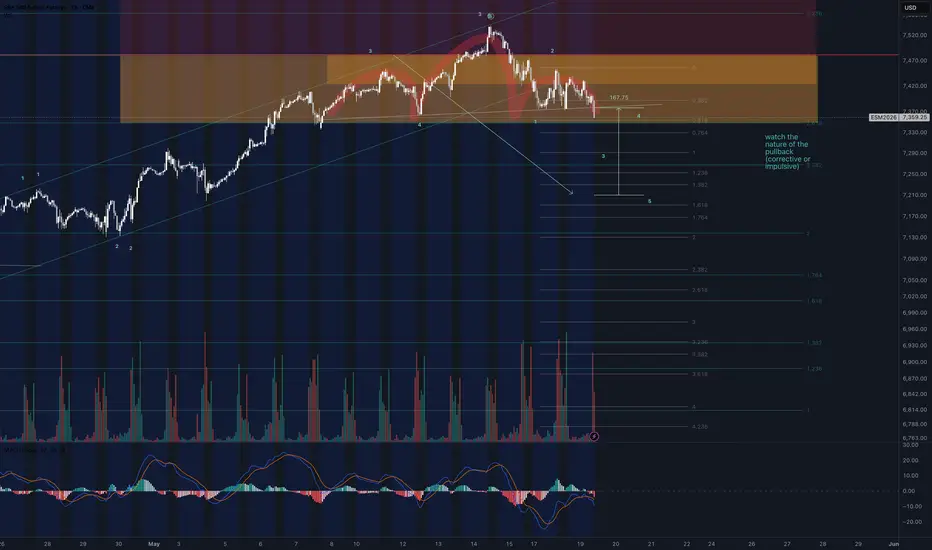
MESM May 20: Sweep of 7362, now watching 7440 and 7475MESM analysis for Wednesday, May 20
MESM already swept the downside liquidity at 7362 and bounced, and now price is trading around 7400. Because of that, my first expectation for today is a push higher into the 7440 area.
On the 4H chart, 7440 is the first upside level I’m watching. Once price reaches that level, I’ll be looking closely for a reaction because there is still overhead supply sitting above price.
If bulls stay strong after that and we eventually get a 4H candle close above 7475,
CHFJPY: Strong Confirmation After Pullback 🇨🇭🇯🇵
CHFJPY retraced deeply, reaching a strong intraday horizontal support yesterday.
This morning, the price formed an inverted head & shoulders pattern on that.
I see a confirmed breakout of its neckline.
It indicates a highly probable pullback at least to 201.62
❤️Please, support my work with like, thank you!❤️
I am part of Trade Nation's Influencer program and receive a monthly fee for using their TradingView charts in my analysis.
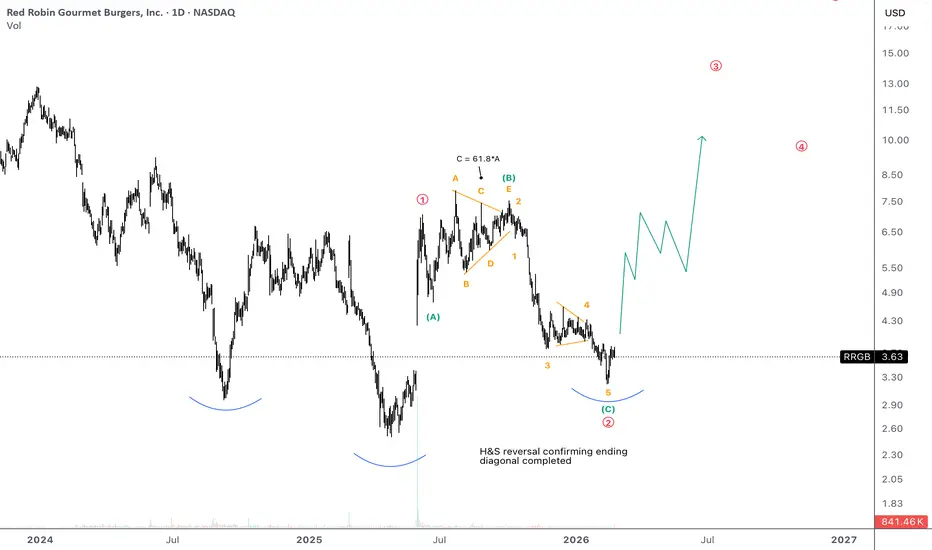
RRGB continues to gain strengthMy initial idea written in May'25
Ending diagonal per EW will be confirmed today basically as yesterday's earnings proved the company is at inflection and measures taken to improve traffic and financials actually work.
Monthly RSI divergence continues to work.
I expect that today nice volumes will drive the price to the north as red wave 3 is unfolding.
H&S is clear at this point confirming reversal.
Still risky but highly rewarding bet. One of my most promising.
BIDU: Why Large Patterns Deserve More RespectBaidu is a good example of why large technical patterns should not be ignored.
The chart is not just moving randomly. It is building structure.
Over the past several months, BIDU appears to be forming a potential head and shoulders pattern. The left shoulder came after the first strong rally, the head formed during the larger move higher, and the recent rebound may now be shaping the right shoulder.
The most important level is not the shoulder.
It is the neckline.
For BIDU, that zone sits a
XRP Is the World Bridge Currency,’ Says LIFTT Capital’s TedAt Hederacon, an official side event to Consensus 2026 in Miami, Ted from LIFTT Capital was asked one question about XRP and his answer was three words. ‘World Bridge Currency,’ he said.
Ted’s explanation starts with a simple observation about where the financial world currently sits. PayPal, Cash App, and every major payment platform operate as closed loops. Money goes in, money stays inside. Moving value between these walled gardens is slow, expensive, and dependent on intermediaries that add
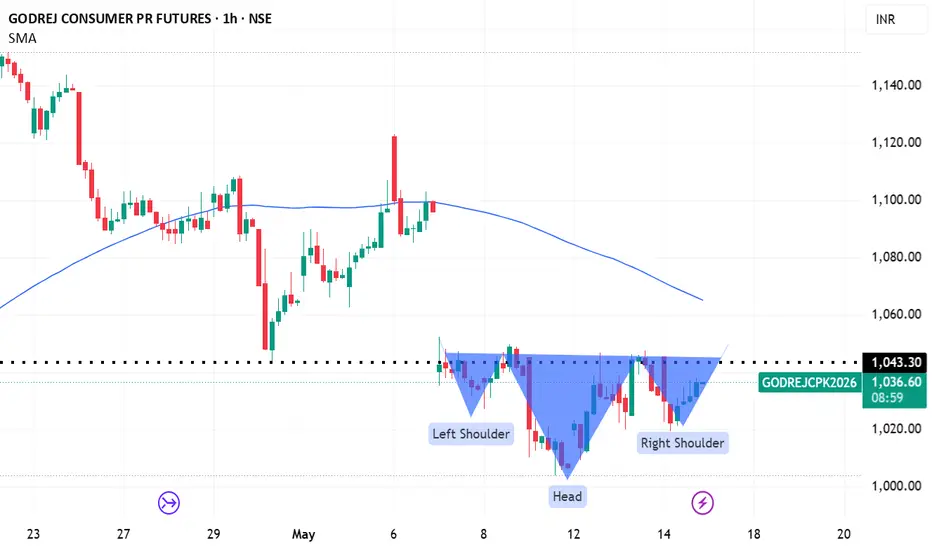
godrejcpEntry Range:
Current market execution at ₹1,032.80 offers an optimal risk profile ahead of the structural target.
Stop Loss: Set strictly at ₹1,010 to limit downside risk if the right shoulder structure fails.
Target Price: Technical projection sets the structural profit-booking objective at ₹1,100.
Risk-to-Reward Ratio: Executing near ₹1,030 yields an asymmetric 1:3.05 RR
GOLD (XAU/USD): Oversold Market & PullbackIt appears that GOLD is oversold following a significant bearish rally. The price seems to have found support near the 4500 level.
Analyzing the hourly timeframe, there are signals of buyer strength, specifically an inverted head and shoulders pattern formation, and a bullish breakout of its neckline.
Therefore, we might anticipate more growth, potentially reaching at least 4610.
NAZARA TECHNazara Technologies Ltd. (CMP ₹299.95, NSE: NAZARA)
Prepared by Sucrit Patil | The SmartWay Research Desk | 18 May 2026
A Mumbai‑based gaming and sports media company, incorporated in 1999. Nazara operates across mobile gaming, esports, gamified learning, and sports media, with subsidiaries like Sportskeeda, Nodwin Gaming, Kiddopia, WildWorks, Curve Games, and Nextwave Multimedia.
Promoter Holding (Mar 2026): Nitish Mittersain & Vikash Mittersain — 35.46% stake (pledged ~55.94%)
FY22–FY26 Sna
Bitcoin Sunday Analysis $BTC rejected almost perfectly from 82kBitcoin Sunday Analysis
CRYPTOCAP:BTC rejected almost perfectly from the 82K region, exactly the level I’ve been warning about for weeks. I told you many times that this zone was a major resistance area and a place where I would continue adding short positions.
Since the rejection, Bitcoin has already dropped more than 5%, but my plan has not changed. My limit orders between 85K–86K are still open and waiting to be filled if the market gives one final push higher.
Right now, my average shor
WYFI: The Invisible AI Giant —$865M Contract vs $412M Market Cap🚀 🚀 🚀
The Opportunity: Why is the market missing this?
While the world chases overextended AI names trading at 50x sales, WhiteFiber (WYFI) is sitting in plain sight at a laughable discount. W
We are looking at a business with a decade of contracted, predictable revenue that the market is currently punishing due to "Q4 noise."
The Bullish Fundamentals (The "Alpha"):
The Contract Arbitrage: WYFI has an $865M Nscale NC-1 contract that started billing on April 30.
Their current market cap is
TATVA CHINTAN PHARMA💊 Tatva Chintan – Inverse H&S Breakout Watch! 💊
📊 Setup: 15‑min chart flashing a clean Inverse Head & Shoulders.
🔑 Current Price: ₹1334.90 (+2.24%).
🛡️ Support: Strong base at the Head zone.
🚀 Upside Potential: Breakout above neckline could fuel intraday momentum toward ₹1345+.
💡 Why Traders Care:
Inverse H&S is one of the most reliable bullish reversal patterns.
Intraday timeframe makes this setup perfect for scalpers & momentum traders.
Volume confirmation adds conviction to the move.
⚡️
Left Shoulder PainThe price has confirmed the Break of Market Structure. Nested H&S, together with O&U is endorsed. Smart Money Trap in both major SnD zones (targets). Moreover, the price is extremely overbought reaching all-time highs.
NB: The opening of the markets can invalidate this analysis simply by breaking the neckline/ proceeding with bearish movement.
What's next for Gold? Analysis (17/05/2025) Before anything, you might be asking, "why would gold pumps again after that massive drop? that's impossible. " that's exactly what they want us to think! they want us to sell all the way up, just like how most of us bought all the way down. Why do I think the price could do it again? because we are in the middle of a bigger range. Focus, look closely, ignore the bias, that's what I do. That's what made me sell though we pumped so hard from last week "ceasefire". Sure narrative is good as a forc
Solana could rapidly fall to $40A massive potential Head and shoulders topping exists on Solana. And many other Altcoins exhibit similar tops.
Keep nimble and protect your gains if you have them.
On the positive side, I believe the bear market will be swift and we could potentially see this number as early as next March.
Why because Solana's network effect topped on the #Trump memecoin release last January.
The solana ecosytem also enjoyed a full cycle of activity unlike other chains.
I believe there will be plenty of