BTCUSDT: Consolidation Ends - Breakout Scenario in PlayHello everyone, here is my breakdown of the current BTCUSDT setup.
Market Analysis
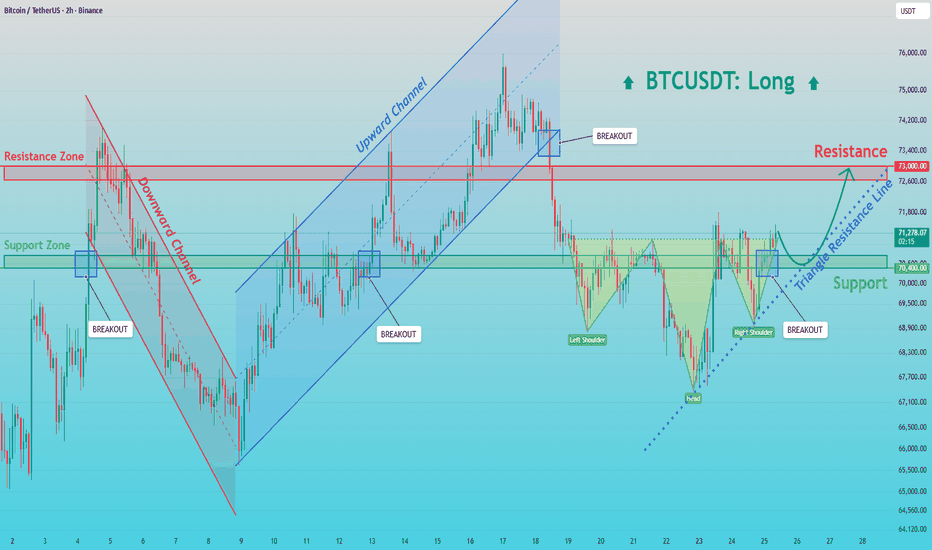
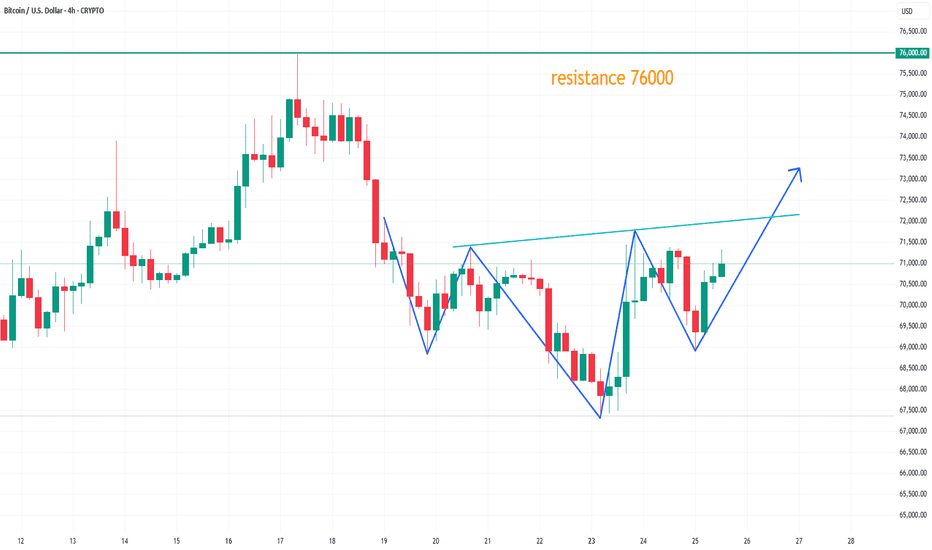
BTCUSDT previously traded in a consolidation range, followed by multiple breakout attempts, confirming increased volatility and active participation from both buyers and sellers. After the breakout, price started forming a short-term ascending structure with higher lows, indicating building bullish pressure.
Currently, price is holding above the 70,400 support zone and approaching the 73,000 resistance, with structure showing signs of a potential breakout continuation.
My Scenario & Strategy
As long as BTCUSDT holds above 70,400 support and maintains the ascending structure, the bullish bias remains valid. A successful breakout above 73,000 could push price toward higher resistance levels as the next upside targets.
However, if price breaks below 70,400, the bullish scenario would weaken and the market could shift back into consolidation or downside movement.
That’s the setup I’m tracking. Thank you for your attention, and always manage your risk.
Head and Shoulders
Hind Rectifiers: From Base to BreakoutHind Rectifiers Ltd operates in the power electronics & railway segment, benefiting from India’s railway electrification and infrastructure growth.
📈 Strong revenue & profit growth
💰 Healthy ROE & ROCE
🚀 Order book driven by railways & industrial demand
⚠️ Slightly higher debt due to expansion
📊 Premium valuation
👉 Overall: Strong growth company, but not cheap
📉 Technical View
The stock has formed a Bullish Inverse Head & Shoulders pattern, indicating a potential trend reversal.
🟢 Key Zone
Reversal Zone: 1361 – 1437 → Strong demand & accumulation area
📈 Current Strength
Price trading near ₹1588
Holding above neckline → bullish continuation
🎯 Targets
R1: 1720
R2: 1850
R3: 2075
Disclaimer: aliceblueonline.com/legal-documentation/disclaimer/
Bullish and Bearish Cases for Short-Term SilverSilver has had difficult few weeks. After rising above $120, bears saw an opportunity as bullish optimism and greed became more extreme. The gold-silver ratio fell as low as 45, nearly halving. When safe-haven demand failed to support gold and it began to decline, the unbalanced gold-silver ratio started to normalize, causing silver to take a much bigger hit than gold. It is well known that during periods of heightened risk, such as wars or recessions, gold tends to outperform silver, and this time was no different despite both becoming weaker than expected.
Now, with the possibility of peace re-emerging after remarks from Trump, silver is trying to recover. But the risks remain high, and both Iran and the US have very different views on who holds the stronger position in ceasefire talks.
On the 30-minute chart, silver formed an inverse head and shoulders pattern and then broke to the upside. After the breakout, price quickly jumped to the 74.50 resistance, which is now being tested. According to technical analysis, two scenarios are gaining probability.
The first is that the 74.50 resistance holds (perhaps with small but temporary breaches) and a rising wedge formation is completed. This bearish case could be triggered by a break below 72.
The bullish case is that both the orange trendline and the 74.50 resistance break to the upside, opening the way toward the 78–80 horizontal resistance zone while also reaching the target of the inverse head and shoulders pattern.
Although the technical picture currently offers strong opportunities on both sides, all of it could become irrelevant very quickly because a single sentence from Iran or Trump could change the trajectory massively. So whichever case plays out, bullish or bearish, it would be wise to stay prepared for sudden reversals.
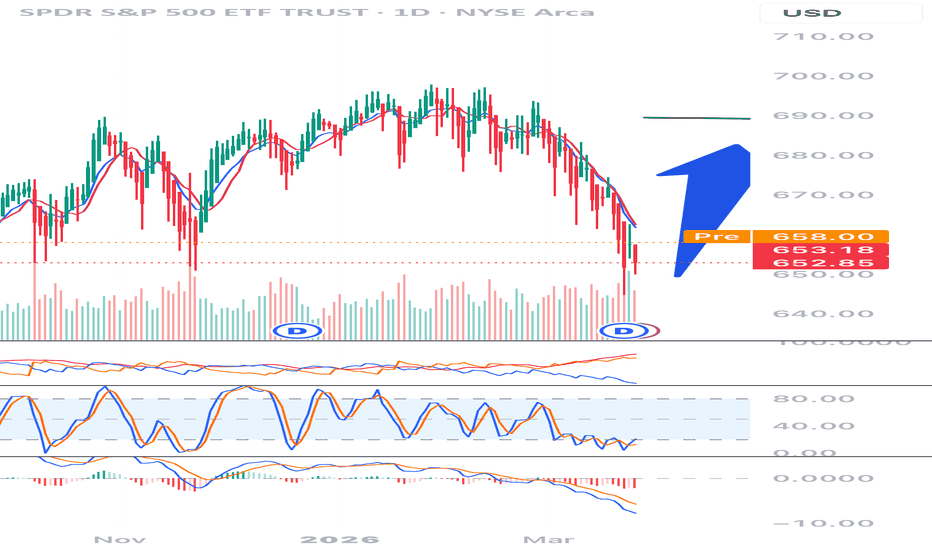
Market will go up today There is a Head and shoulders appearing.
The Spy will head up to its next shoulder at 689.
The reason I can tell the market is going up, is due to the 3 day indicators indicating a move up as well as the daily indicators. They weekly indicators are just about to confirm a move up.
As always, make sure you do your own anyalysis. There is always risk trading.
I entered at the end of day yesterday.
Happy trading, everyone!
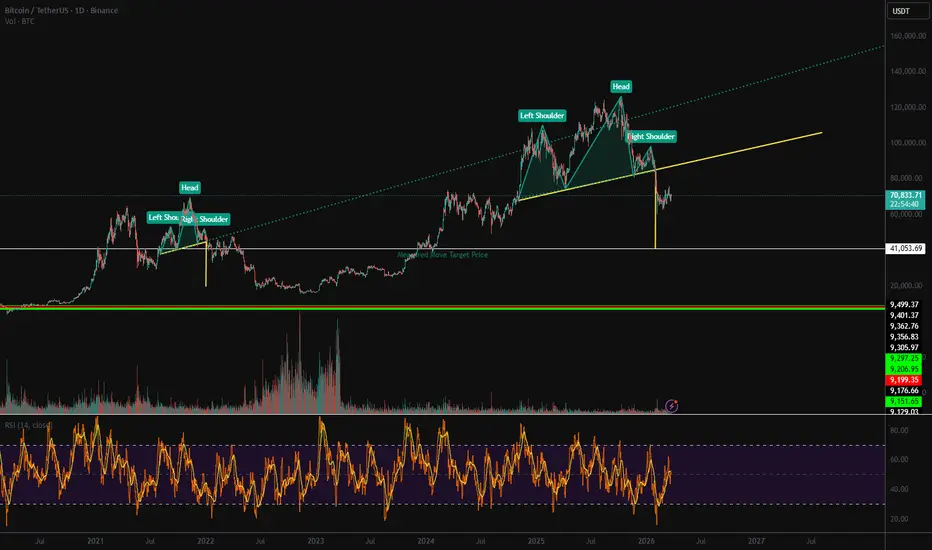
Bitcoin Daily Head and Shoulders PatternHere I am looking into a pattern that also appeared back in 2021, the daily head and shoulders pattern.
Previously it reached its measured move and if it was to do the same thing we should see bitcoin in the 40kish region eventually.
It's important to note that I am bearish bias, but I do believe that the chart looks eerily similar to the 2021 head and shoulders pattern, lets see if history repeats.
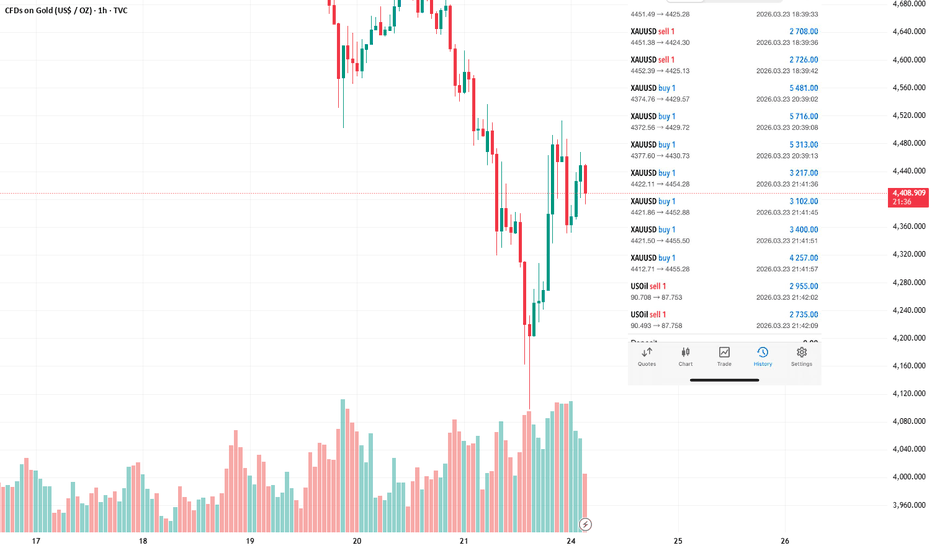
Buyers, take action!Buyers, take action! My buy order has begun execution.
The order is expected to close before the New York market closes. If the price doesn't reach 4460, then the order will need to wait until the Asian market opens to close.
When you see a good trading opportunity, remember to act. Don't miss out on a good buying opportunity by waiting.
Prediction Markets Tighten Rules As Insider Trading Ban BeginsPrediction markets just entered a critical phase. Platforms now face rising scrutiny from regulators and lawmakers. At the same time, user trust depends on fairness and transparency. This balance creates pressure on every major platform.
The recent prediction markets crackdown shows how fast the landscape changes. Kalshi and Polymarket introduced strict rules on the same day. Meanwhile, lawmakers pushed a bill that could shut these platforms down. This timing reflects urgency across the industry.
Traders now question how these platforms will operate moving forward. Both companies aim to protect their ecosystems. They also want to avoid legal battles that could disrupt growth. This shift marks a major turning point for crypto betting platforms.
Why The Prediction Markets Crackdown Arrived Suddenly
Regulators have watched prediction markets for months. They worry about market manipulation and unfair advantages. Lawmakers believe insiders could exploit sensitive information.
The new prediction markets crackdown responds directly to these concerns. Congress introduced a bill targeting these platforms. This move forced companies to act quickly.
Kalshi and Polymarket chose to tighten insider trading rules immediately. They aim to show regulators that they can self-regulate. This strategy could help them survive future legal challenges.
Kalshi Introduces Strict Controls To Prevent Conflicts Of Interest
Kalshi took a strong stance with its new policies. The platform now bans politicians from betting on their own campaigns. It also blocks athletes from betting on their own sports. These insider trading rules aim to remove direct conflicts of interest. Kalshi understands that trust drives user participation. Without trust, prediction markets cannot function effectively.
The platform also introduced whistleblower tools. These tools allow users to report suspicious trades. This step encourages community involvement in maintaining fairness. Kalshi’s approach shows how platforms adapt during a prediction markets crackdown. It focuses on transparency and accountability. This strategy may help build long-term credibility.
Polymarket Expands Its Rules To Cover Illegal Information Use
Polymarket followed a similar path but added broader restrictions. It now bans trades based on stolen information. It also blocks trades using illegal tips. The platform targets individuals who can influence outcomes directly. This includes insiders with access to confidential data. These insider trading rules reduce the risk of manipulation.
Polymarket wants to protect its reputation among crypto betting platforms. It understands that regulatory pressure will continue to rise. By acting early, it positions itself as a responsible player. This move also signals a shift in how platforms operate. They now prioritize compliance alongside innovation.
How Insider Trading Rules Could Reshape Market Participation
The new insider trading rules will change how users engage with these platforms. Traders must rely on public information instead of privileged access. This shift levels the playing field. However, stricter rules could reduce short-term trading activity. Some users may leave due to reduced advantages. Yet, long-term trust may attract more participants.
The prediction markets crackdown could improve overall market quality. Fair systems encourage broader adoption. This outcome benefits both platforms and users. Crypto betting platforms now face a new reality. They must balance innovation with strict compliance. Those who succeed will likely dominate the market.
Final Thoughts On Prediction markets
Prediction markets now face intense scrutiny from both regulators and users. Platforms respond with stronger insider trading rules and better monitoring tools. This shift signals a maturing industry.
The prediction markets crackdown highlights the importance of trust. Without fairness, these markets cannot survive. Kalshi and Polymarket understand this reality and act accordingly.
The coming months will reveal how effective these changes are. If platforms maintain transparency, they could secure long-term growth. If not, regulatory pressure may increase further.
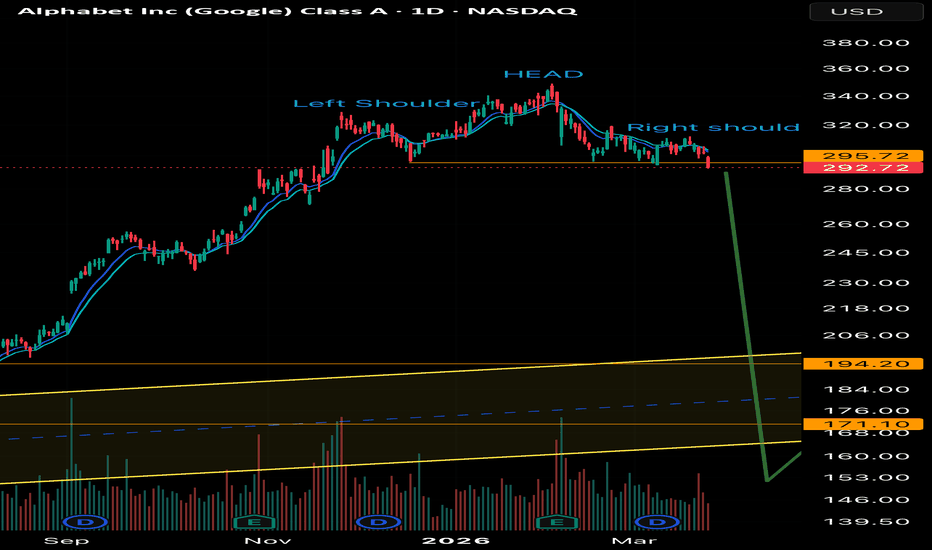
Google loosing short term supportDaily chart has visible head and shoulders structure that is currently breaking down. Measured move should get price minimum to about ~$240.
As I just posted in weekly GOOGL view, I am very bullish this stock longer term but right now discount is very much welcomed.
Google developing their own chips; they invested in SpaceX and of course have their legacy suite of products. Also Buffet invested at average price of $209, essentially creating a floor for the stock price. I hope it goes a bit lower than $209 when fear takes over the marker, but with so much cash on hand and such large investment into the stock Buffet signaled he is seeing huge value at that price point, and my guess he will buy more of it should that level be revisited. I should say Berkshire, not Buffet I guess.
What’s crazy is that Google traded sub $200 just 8 months ago. So when it goes to that price point via huge uncertainty in the market and sky falling type conditions should tell one that even all the fear can’t bring price much lower.
Just like with ASML, I am really hoping this thing doesn’t run away from me.
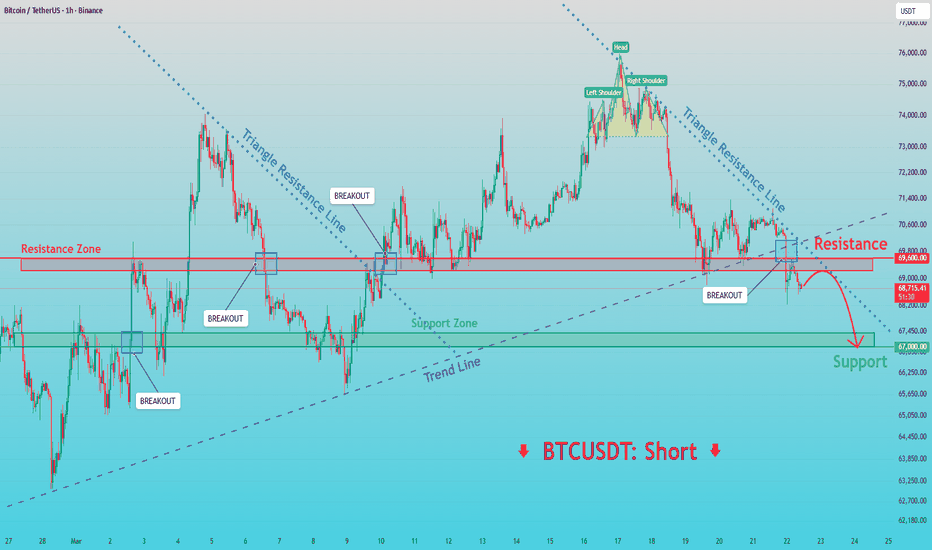
BTCUSDT: Failed Breakout and Trendline Loss Open Path to 67,000Hello everyone, here is my breakdown of the current BTCUSDT setup.
Market Analysis
BTCUSDT is trading below a key resistance zone after forming a head and shoulders pattern, which signals a potential trend reversal to the downside. Price previously respected a triangle resistance line and failed to break higher, confirming selling pressure.
Currently, after the breakdown, BTC lost the ascending trend line support and is now consolidating below the 69,600 resistance zone, showing weak bullish attempts and rejection from this level.
My Scenario & Strategy
As long as price remains below 69,600 resistance, the bearish bias remains valid. A rejection from this area could push BTCUSDT toward the 67,000 support zone, which is the main downside target.
However, if price breaks and holds above 69,600, the bearish scenario would weaken and the market could shift into consolidation.
That’s the setup I’m tracking. Thank you for your attention, and always manage your risk.
MDA Space: when orbit is no longer a dream, but a trajectoryMDA Space is one of those companies that doesn’t just participate in the space industry - it quietly builds its backbone. Canadarm on the ISS, satellite constellations for Telesat Lightspeed and Globalstar, advanced Earth observation radar systems - this is not a startup story, this is 55 years of engineering discipline scaling into a new cycle of global demand. With headquarters in Brampton, over 4,000 employees, and deep integration into both commercial and defense ecosystems, MDA is positioning itself at the intersection of two accelerating forces: space infrastructure and geopolitical rearmament.
The numbers confirm the shift. The company reported on March 4, 2026, delivering 51% revenue growth to CAD 1.63B, with adjusted EBITDA reaching CAD 324M and GAAP net income at CAD 108.5M. Free cash flow came in at CAD 165M. Q4 alone delivered CAD 499M in revenue (+44% YoY), marking a record quarter. More importantly, backlog expanded to $4B, while the five-year pipeline now stands at an impressive $40B, providing long-term visibility that most companies in the sector simply don’t have.
Growth is not abstract - it is concentrated and operational. The satellite systems segment surged 85.5% to CAD 1.1B, driven by large-scale constellation builds. The company is preparing to scale production up to two digital satellites per day at its new Montreal facility, effectively transitioning from project-based execution to industrial-scale manufacturing.
At the same time, MDA is strengthening its strategic positioning. In March 2026, the company completed its NYSE listing, raising $300M, unlocking access to U.S. capital markets and expanding its M&A flexibility. Government demand continues to accelerate: partnerships with the Canadian government and Telesat for Arctic defense communications, agreements with South Korea’s Hanwha Systems, and a $32M contract from Canada’s Department of National Defence. Notably, all five major U.S. defense contractors source satellite components from MDA - a signal of deep integration into Western defense supply chains. The launch of its subsidiary 49North further reinforces its focus on national security priorities, while the acquisition of SatixFy adds vertical integration in space-grade semiconductor technology.
Now to the technical structure - and this is where things align.
On the daily chart, a classic head & shoulders pattern has already played out. The neckline break was confirmed, followed by a clean retest, and price is now transitioning into a continuation phase. This is not a speculative setup - this is a completed structure moving into trend expansion.
Momentum indicators support the move. ADX at 39.54 confirms a strong, established trend, while DI+ (24.45) significantly exceeds DI- (16.28), indicating clear bullish control. CCI (20) at 65.06 shows upward momentum without entering overbought territory, leaving room for continuation. BBP (13) at 0.092 suggests price is positioned within the upper range of Bollinger dynamics but not overheated, which is typical for sustainable trends. Price remains above key moving averages, reinforcing structural strength.
The risks are real, but they are structural rather than immediate. The business remains exposed to government contract cycles, capital expenditures are expected to increase to CAD 225–275M in 2026, potentially pressuring short-term free cash flow, and insider selling has been present in recent months. However, these factors are typical for companies transitioning into expansion phases rather than signals of deterioration.
On the other side, the opportunities are asymmetric. A $40B pipeline, expansion into U.S. markets, vertical integration through semiconductor capabilities, and rising defense budgets across North America create a multi-year tailwind that is difficult to ignore.
MDA is currently riding two macro waves simultaneously: the militarization of space and the commercialization of orbital infrastructure. Revenue is growing above 50%, backlog provides forward visibility, and the technical structure confirms continuation rather than exhaustion.
The head & shoulders pattern has completed its cycle, the retest has held, ADX confirms trend strength, CCI shows no overheating, and BBP suggests the move is still developing, not ending.
As one aerospace engineer once said: “A satellite doesn’t forgive mistakes. But once it reaches orbit, no one remembers the launch tension.”
Right now, MDA looks less like a launch and more like a trajectory already locked in.
Stop your long positions and execute a short trade.Oh my god, I woke up to find that the price of gold has plummeted again. Fortunately, we stopped our losses at 4450, otherwise the losses would have been even greater. I just checked the gold price. It touched a low of 4100. The current price is 4264.
Amidst the escalating geopolitical tensions, the probability of interest rate hikes by central banks worldwide has increased. Asian and European stock markets opened with a sharp drop. The low of $4100 broke the new low since November. Inflation is strengthening from its nascent state, and oil has once again received a significant boost. The reason it hasn't risen sharply yet is because the market still has some undigested energy reserves.
The current gold price is 4247. Based on the situation, the New York market may continue to test the 4000-4050 price range. Therefore, the trading strategy still recommends shorting at higher levels.
Sell at 4300-4350, target 4150-4100.
Head and ShouldersBearish, break of 200 EMA too
🔴 1. Weak IT Spending / Global Macro Slowdown
HCLTech is heavily dependent on US and Europe enterprise IT budgets
If recession fears rise, companies delay or cut discretionary tech spending
This directly hits:
Digital transformation deals
Cloud migration projects
Historically, IT services stocks fall quickly when deal pipelines slow
🔴 2. Deal Pipeline Weakness / Fewer Large Deals
Growth depends on large multi-year contracts
If:
Deal wins slow
Deal sizes shrink
→ revenue visibility weakens
Even one or two quarters of weak bookings can trigger sharp corrections
🔴 3. Margin Pressure
Key risks:
Wage inflation in India
Higher subcontractor costs
Pricing pressure from clients
HCLTech already operates with tighter margins vs peers like TCS
Any margin miss → strong negative market reaction
🔴 4. Currency Headwinds
Revenues largely in USD/EUR, costs in INR
If INR strengthens:
Profitability declines
FX volatility can create earnings uncertainty
🔴 5. Underperformance vs Peers (TCS / Infosys)
If HCLTech:
Misses guidance
Lags peers on growth or margins
→ investors rotate into stronger names
Relative underperformance often leads to multiple compression
🟠 6. Client Concentration Risk
Large exposure to top clients and specific verticals (e.g., tech, financials)
If a major client cuts spending → noticeable revenue impact
🟠 7. Slower Growth in Key Segments
HCLTech has strong exposure to:
Infrastructure services
Engineering/R&D
These areas can lag if cloud or product cycles slow
🟠 8. Execution Risks
Issues like:
Integration of acquisitions
Delivery delays
Talent attrition
Can hurt both reputation and margins
🟠 9. Valuation Compression
Even if earnings hold:
Market may reduce valuation multiples
Common in IT when:
Interest rates rise
Growth expectations fall
🟡 10. Regulatory / Geopolitical Risks
Visa rules (US)
Data regulations
Trade tensions
→ could increase costs or restrict operations
Rising 10_Yields Ahead?Here’s How It Could Hit BTC, Gold, StocksWhy the US 10-Year Yield Matters
The US 10-Year Treasury yield is one of the most important benchmarks in global finance. It reflects investor expectations for inflation, growth, and Federal Reserve policy. Because it influences everything from mortgage rates to equity valuations and the strength of the US dollar( TVC:DXY ), understanding its direction helps traders anticipate major market shifts.
Key Scenarios to Watch
1. Yield Rising (Bullish Yield / Bearish Bonds)
Signals stronger economic expectations or sticky inflation.
Usually pushes the USD higher and puts pressure on risk assets like tech stocks and crypto.
Markets begin pricing fewer rate cuts or even potential tightening.
2. Yield Falling (Bearish Yield / Bullish Bonds)
Indicates rising recession risk, softer inflation, or expectations of Fed rate cuts.
Supports equity markets and risk assets (including crypto).
Typically weakens the US dollar.
3. Sideways / Stable Range
Suggests economic uncertainty or balanced expectations.
Markets remain in consolidation until new macro data or Fed signals arrive.
Why Traders Follow It:
Small moves in the 10-year yield can shift global liquidity, risk sentiment, and currency flows — making it a core indicator for forecasting market direction.
Given the current data and signals, my short-term forecast is for yields to remain flat or move slightly higher, but the likelihood of a significant decline in the near term seems slim.
-----------------------------------------------------
Now let's take a look at the US 10-Year Government Bond Yield chart on the daily time frame.
The US 10-Year Government Bond Yield is currently moving near the support lines and the 4.00% (Round Number).
In terms of classic technical analysis, we can expect that the US 10-Year Government Bond Yield's uptrend could start with an Inverse Head and Shoulders Pattern.
In terms of Elliott Wave theory, it appears that the US 10-Year Government Bond Yield has succeeded in completing the main wave 4 with a Double Three Correction(WXY).
I expect the US 10-Year Government Bond Yield to attack Resistance lines after breaking the Neckline and Resistance zone(4.24%-4.14%).
-----------------------------------------------------
Impact of a Rising US 10-Year Yield
•Bitcoin( BINANCE:BTCUSDT ):
A higher 10-year yield usually reduces liquidity and increases funding costs, which puts pressure on risk assets. BTC typically faces short-term downside or slower momentum when yields rise.
•Gold( OANDA:XAUUSD ):
Gold often moves inversely to yields. Rising yields increase the opportunity cost of holding gold, making it less attractive. This usually leads to weakness or consolidation in gold.
•Stocks (Equities):
Higher yields tighten financial conditions and lower valuations, especially for tech and growth stocks. Equities generally face selling pressure when yields rise sharply.
If you would like to see technical analysis on the weekly timeframe, I recommend you take a look at the link below.👇
-----------------------------------------------------
💡 Please respect each other's opinions and express agreement or disagreement politely.
📌US 10-Year Government Bond Yield Analyze ( TVC:US10 ), Daily time frame.
🛑 Always set a Stop Loss(SL) for every position you open.
✅ This is just my idea; I’d love to see your thoughts too!
🔥 If you find it helpful, please BOOST this post and share it with your friends.
BTC - $50k Likely, is the war affecting BTC ?Hello Bitcoin Watchers 📈
BT has made a bold and bearish pattern in the weekly, and it's a massive head and shoulders pattern, as per my previous BTC update.
However, we notice something interesting if we o further back to the previous cycle, almost like a pattern, a fractal - in the bearish H&S.
If we go back to 2022, we see a retracement past the beginning of the H&S pattern - it starts earlier, at a peak we then though was the ATH. It's similar to the current setup where, in Mach 2024, it seemed like we peaked. After which, a brief dip, and the price continues upward.
It is therefore reasonable to say that the price may likely retrace to around the same zone.
This puts us between 40-50k, likely a great buy back zone. With scattered dollar-cost-averaging in this zone, you could make a decent profit for the next bullish cycle which will likely only be in a few months, or after the current war crises has resolved.
What's your take on how the current crises in the Middle East will affect BTC?
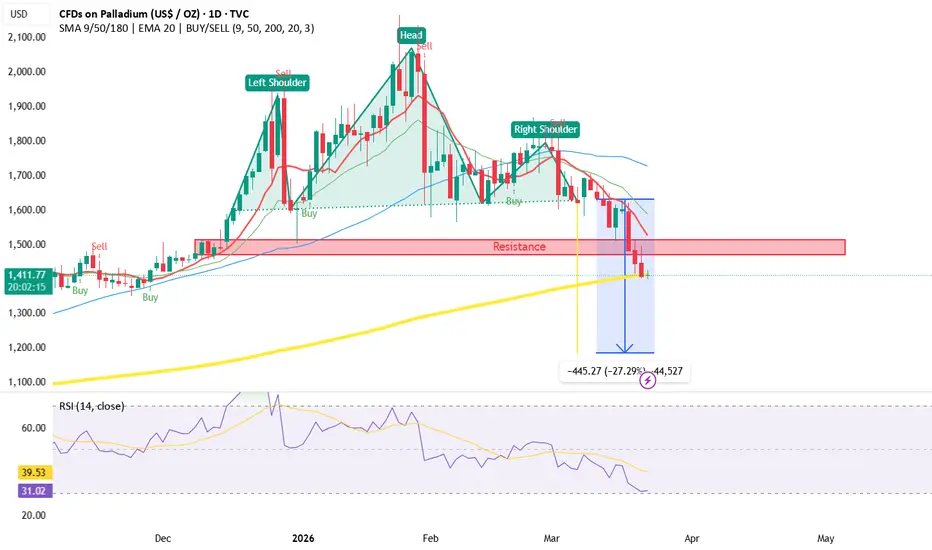
Platinum (PL) BounceHello Everyone
I observed a head and shoulders pattern on the platinum daily chart. RSI is currently showing to be overbought and although the general trend is still bearish with the head and shoulders drop to have only come to half way of its expected measure move, there will be a bounce off the 200 week moving average. Not sure if this will break the head and shoulders and reverse the entire trajectory of the chart or is the drop will continue. Price will run into resistance on the $1680 to the $1686 price point.
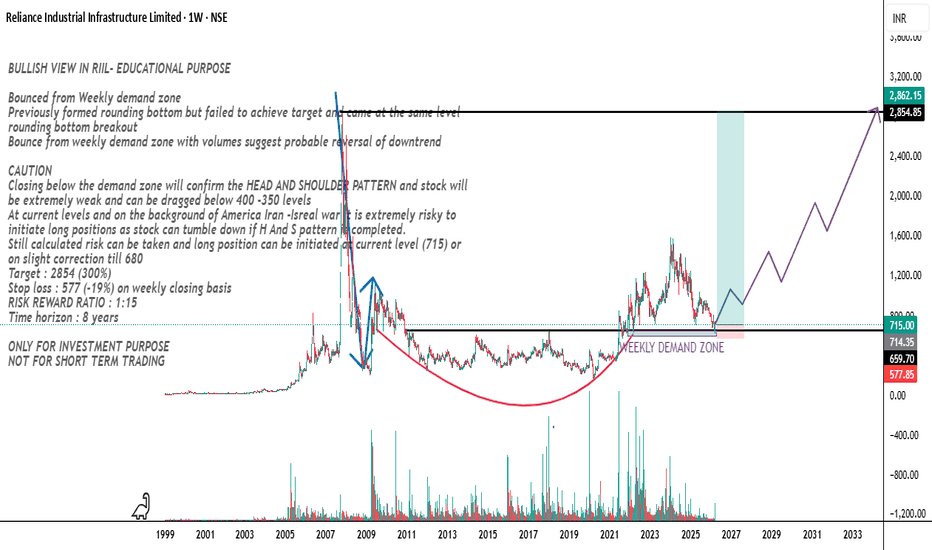
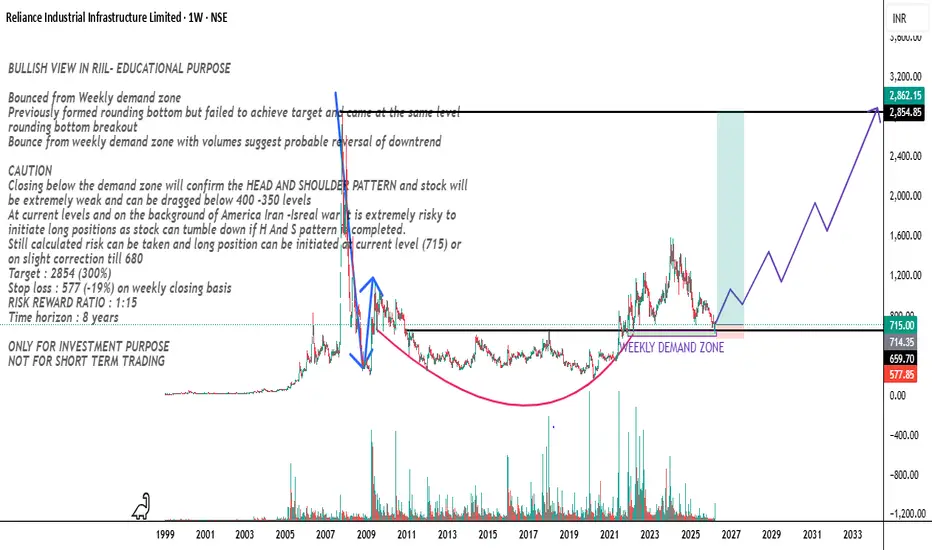
BULLISH VIEW IN RIIL- EDUCATIONAL PURPOSE
Bounced from Weekly demand zone
Previously formed rounding bottom but failed to achieve target and came at the same level rounding bottom breakout
Bounce from weekly demand zone with volumes suggest probable reversal of downtrend
CAUTION
Closing below the demand zone will confirm the HEAD AND SHOULDER PATTERN and stock will be extremely weak and can be dragged below 400 -350 levels. So Loss booking is very essential if stop loss is triggered
At current levels and on the background of America Iran -Isreal war it is extremely risky to initiate long positions as stock can tumble down if H And S pattern is completed.
Still calculated risk can be taken and long position can be initiated at current level (715) or on slight correction till 680
Target : 2854 (300%)
Stop loss : 577 (-19%) on weekly closing basis
RISK REWARD RATIO : 1:15
Time horizon : 8 years
ONLY FOR INVESTMENT PURPOSE
NOT FOR SHORT TERM TRADING
XAUUSD/ Bear market trading?
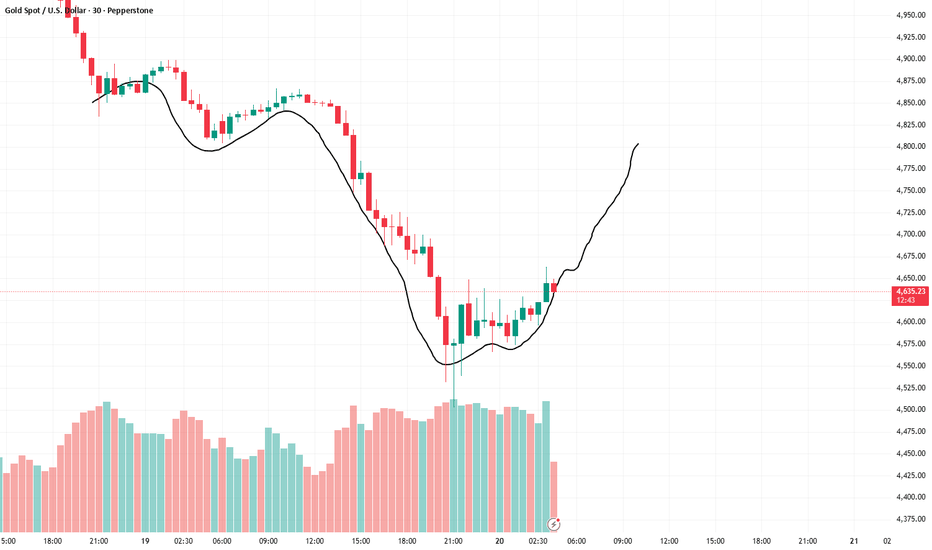
The long positions executed last time have started generating considerable profits again. It's still advisable to buy now; buying below 4640 remains a healthy entry point.
Traders who follow my posts and trade accordingly, please remember to keep an eye on the notifications I send through internal channels. This way you can see my subsequent closing positions and won't miss any new trading opportunities. Because as a trader, the timing of any buy/sell or order closing is crucial. A single mistake can lead to losses or reduced profits. So, to prevent such situations... Remember to follow. Feel free to leave me a message if you have any questions.
How to Trade, Part 4!
The intraday market volatility has increased. $4737-4574, approximately $160. Observing the current trend, a double bottom structure has formed in the short term, and the support below is relatively strong, so a small buy position is recommended.
The fundamentals haven't changed much, and the impact of geopolitics continues. Fortunately, we didn't buy at a higher level and incur significant losses.
The short selling seems to have stopped around 4500. So we can consider a small long position.
Current price: 4580. Target: 4640. This is a short-term buy order.
Blue Star – Multi-Timeframe Breakout Setup (Inverse H&S + Roundi💰 Trade Plan
CMP: ₹1971
Stop Loss: ₹1800
Targets:
🎯 ₹2197
🎯 ₹2417
🎯 ₹2589
Defined structure with favourable risk–reward if the trend expands.
📊 Technical Structure
Inverse Head & Shoulder formation visible on weekly timeframe
Rounding Bottom developing on monthly chart
Multi-timeframe bullish structure often leads to strong trending moves
Price action indicating accumulation turning into expansion
If momentum sustains, probability increases for higher highs continuation.
🌡️ Sector Tailwind
Rising heatwave conditions in North India
Strong seasonal demand for AC and cooling products
Reports indicate ~15% price increase in AC units
Demand tailwind may support earnings momentum
But remember: price action leads, news follows.
📌 Trading Approach (Read Carefully)
High volatility → keep quantity light
Staggered entry, no lump-sum aggression
Strict position sizing
This is a patience trade, not a chase
Ignore noise & news flow — price > opinion
SL must be respected at all costs
No prediction.
No emotional bias.
Only structure + discipline.
⚠️ Clarification:
This is an independent analysis based purely on technical and market study. No part of Religare is involved in this view or recommendation.
📝 Important:
I am not responsible for any loss or profit incurred. I am not taking any fees for these views – just sharing my analysis for educational and informational purposes.
📉 Disclaimer:
Not SEBI-registered. Please do your own research or consult a financial advisor before taking any investment decision.