Why 82,500 Matters So Much for Bitcoin?Hey traders!
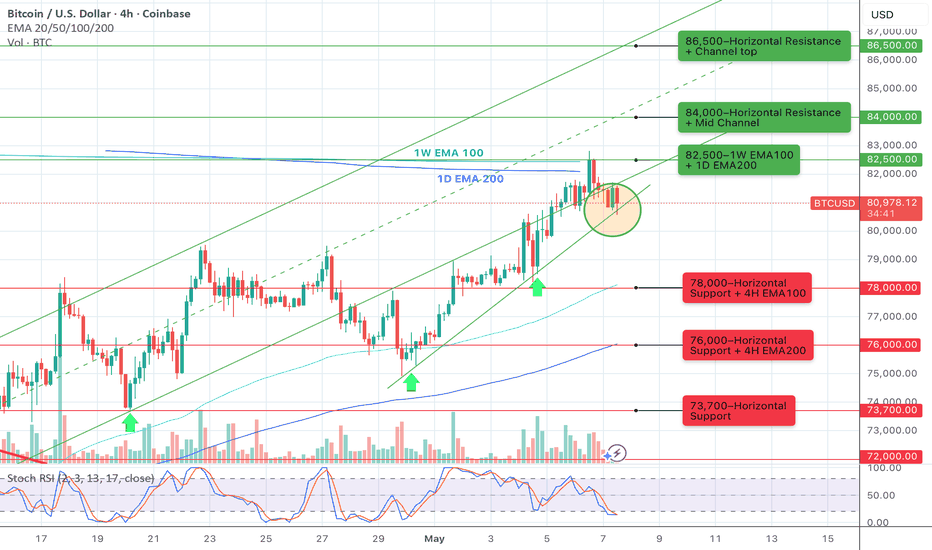
Once again, congratulations to everyone on reaching the 82,500 level 🦬✅
This is already the fifth consecutive target successfully achieved, but this level still remains the key point for Bitcoin’s further upside continuation.
In my previous posts, I mentioned:
“...that this would be a difficult zone for Bitcoin, since higher timeframe moving averages are located there: the 1W EMA 100 and the 1D EMA 200. These are strong resistance levels.
The further direction of the move will depend on how confidently Bitcoin does or does not break through 82,500.”
Yesterday, the price managed to hold above the 82,500 level for only 15 minutes, reaching a high of 82,814, after which a fairly strong rejection followed, once again confirming the importance of this level.
Possible short-term scenarios:
🚀🦬 A breakout above 82,500 with confirmation and a return into the parallel channel — upside targets: 84,000 / 86,500 / 90,000
❌⚰️ Failure to hold above 82,500 — a correction toward 79,500 / 78,000 is possible, with a reset of the accumulated divergence.
Peace everyone 🌍
⚠️ Disclaimer:
All information shared on this channel is for educational and informational purposes only and is not investment advice. The author is not responsible for your trading decisions. Always manage your risks and make decisions independently.
Moving Averages
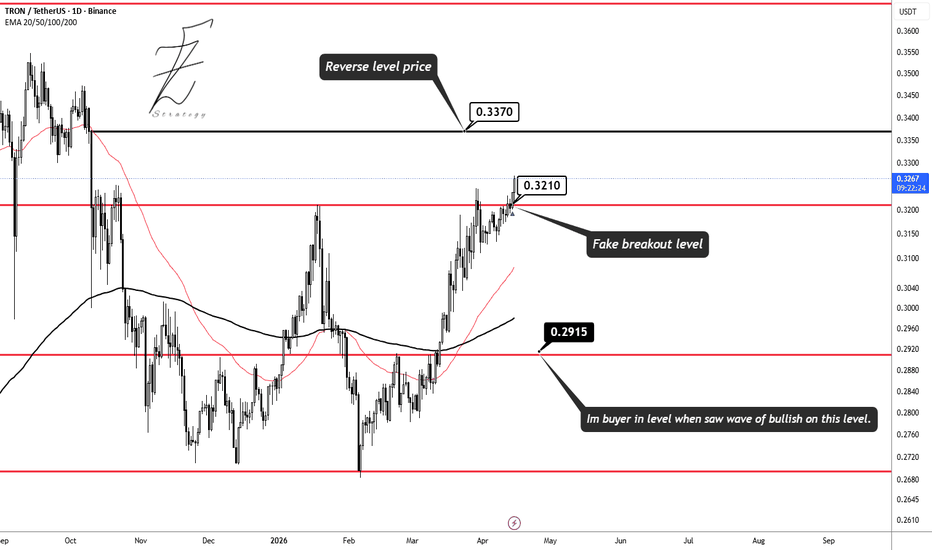
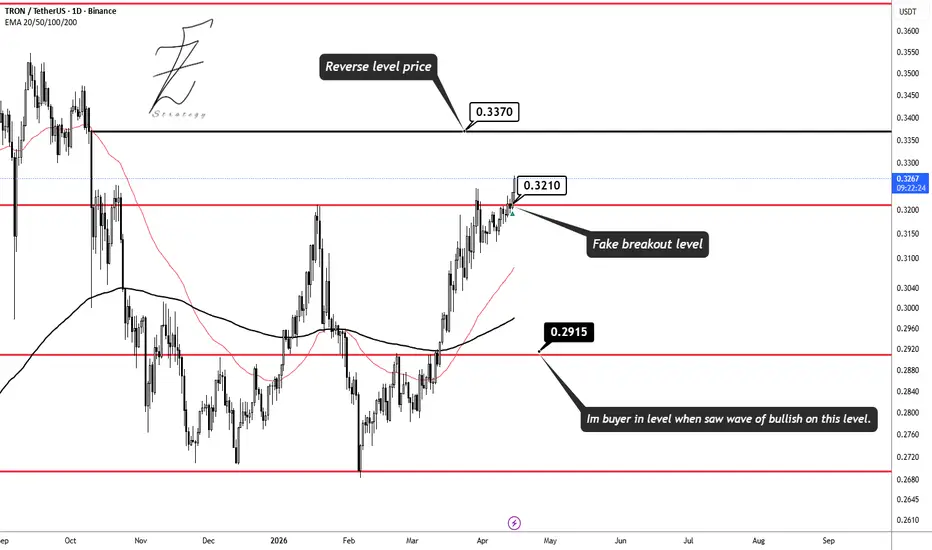
TRXUSDT 📈 Overall Trend & Future Outlook BINANCE:TRXUSDT 🗼
The market maintains a strong bullish trend as price stays above the 200-period EMA with the 50-period EMA acting as dynamic support. Following the recent bullish wave and strong candle bodies, the price is expected to clear the fake breakout zone and reach the next major targets. 🚀
🟢 Key Support Levels
$0.2915 🛡
$0.2710 📍
🔴 Key Resistance Levels
$0.3210 🎯
$0.3370 🏁
$0.3650 🛑
⚠️ Notice: This is a technical analysis; please ensure strict risk management in your trades. ⚖️
ASX 200: Markets Price Peace in the Middle East… AgainLike Bill Murray in Groundhog Day, I find myself sitting here on a cold morning in Australia talking about the end to the Iran war, or at least speculation it’s about to happen. Excuse my cynicism, but this is not the first time markets have priced an end to the conflict. I don’t know exactly how many times, but as a rough guess I’ve probably run out of fingers to count.
Which gets me to the trade idea involving my home equity market, the ASX 200.
It’s jackknifed higher on the war supposedly ending again, bouncing from the bottom of its prevailing sideways range to the top, providing a useful level to build trades around depending on whether the perpetual cycle between de-escalation and re-escalation headlines involving the Gulf has finally come to an end.
This market has shown itself to be interested only in geopolitics and technicals lately, meaning domestic factors matter little when gauging directional risks.
If this really is the end to the war and we see an extension of the bullish move, longs could be initiated on a break above 8900 with a tight stop beneath, targeting 9063 initially with 9120 and the record high at 9226.4 other potential upside levels after that.
But if this is just another headline-driven pump with no real resolution that meaningfully reduces risks around Hormuz, the option is there to initiate shorts beneath 8900 with a tight stop above for protection, targeting the cluster of key moving averages found from 8800.
If the price were to slip beneath the 50-day moving average at 8766, forming the bottom of that cluster, the next logical downside target would be where the contract found itself earlier this week at 8600.
I’m not putting a lot of emphasis on the signal given the headline-driven environment, but the oscillators hint bulls may be starting to gain the ascendency when it comes to momentum, with RSI (14) pushing above 50 while MACD looks set to cross above the signal line imminently.
Good luck!
DS
Rubellite Energy descending triangle breakout momentumRBY.TO is seeing major upside momentum in its logarithmic moving average (LOGMA) as it broke out of a multi-year descending triangle pattern to the upside, signaling bullish. Watch for price volatility as it ranges between the formation support (orange line) and the price ceiling (green line).
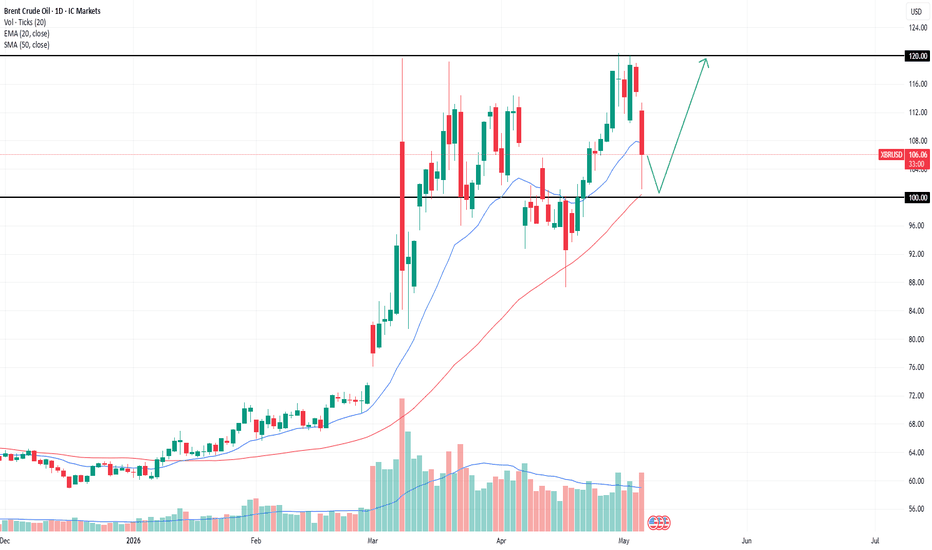
Oil may rebound despite rumorsSo today there were some rumors that Iran and USA are about to sign a treaty. Will see. Personally me don't believe in that. Highly likely Hormuz will be shut for more time. Technically, SMA50 on a daily chart supports prices. Additionally, nearby the level of $100 per barrel plays as a strong support. I am waiting for the price to retest $120 level once again at least. However, if there will be peace and the strait will be opened, then $100 level will become a strong resistance.
ONE SMALL STEP AWAY FROM 82.5K TARGETHi traders🌴📈
Bitcoin is now just one small step away from the 5th TP target out of the 5 targets I shared back on April 14 🎯👀 (check my post on TradingView).
We are actively testing this zone (marked in green ✅), but as I mentioned earlier:
“I assume this will be a difficult zone for Bitcoin, since the higher timeframe moving averages are located here — the 1W EMA 100 and the 1D EMA 200. These are strong resistance levels.
The next direction of movement will depend on how confidently Bitcoin does (or does not) break through 82,500.”
Nothing new to add for now. Watching this zone closely.
✌🏽🌍
⚠️ Disclaimer:
All information shared on this channel is for educational and informational purposes only and is not investment advice. The author is not responsible for your trading decisions. Always manage your risks and make decisions independently.
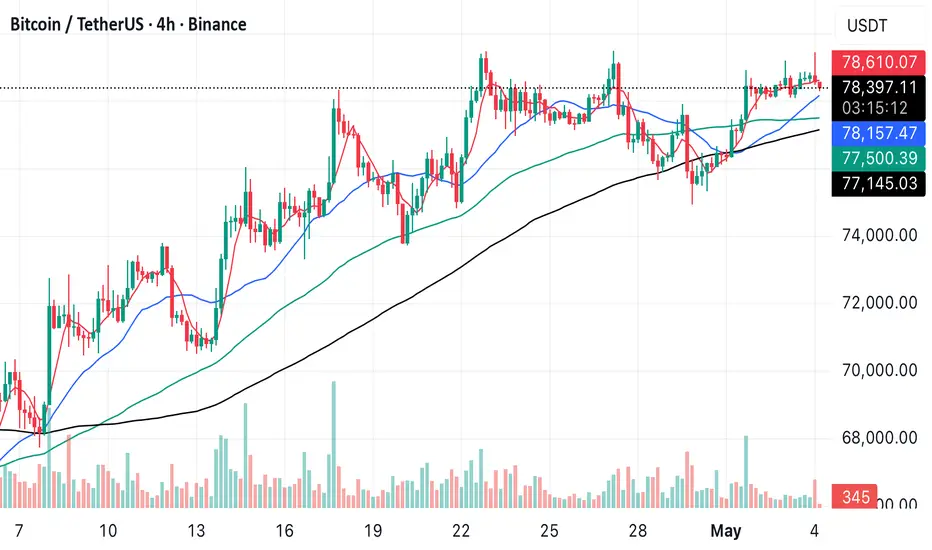
BTCUSDT 4H — Bullish Trend Continues, Waiting for Re-Entry1. Bullish Structure Remains Strong
The market continues to maintain a solid bullish alignment with 5 > 20 > 60. Price action remains strong, and the broader trend is still pointing upward.
2. Profit-Taking Signal Appeared
A bearish candle crossed below the 5MA, which triggered a short-term take-profit signal. This suggests momentum cooled temporarily after the recent push higher.
3. Trend Still Intact
Despite the pullback, the overall structure has not broken. As long as the moving average alignment remains intact, the bullish trend remains valid.
4. Next Long Opportunity
If a bullish candle reclaims and crosses back above the 5MA, it could provide another long entry opportunity in line with the ongoing trend.
5. What I’m Watching
* Reclaim of the 5MA
* Strength of the next bullish candle
* Whether 5 > 20 > 60 remains intact
6. Stay Reactive
This is currently a trend-following environment. I’m not trying to predict tops — I simply follow structure and react to confirmation signals.
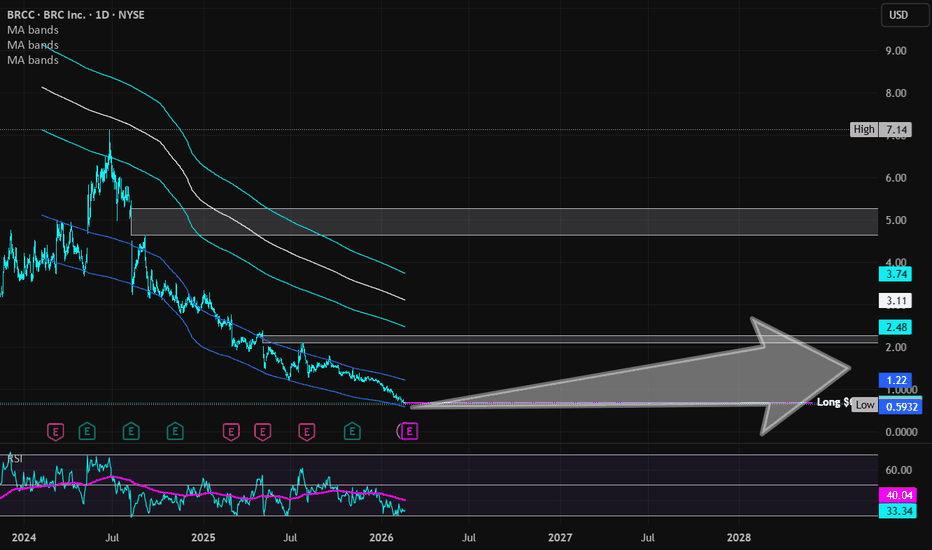
Black Rifle Coffee Company | BRCC | Long at $0.69Likely will be a "compliance boost" in share price soon for NYSE:BRCC to prevent delisting (notice was 6 days ago). Hopefully no dilution in the near-term. Insiders bought $1.2 million at an average of $1.29.
Significant chance price may dip into the $0.50 - $0.60 range before a major move up.
Otherwise, company is unprofitable with high debt and I am entering at $0.69 purely for the gamble.
Targets
$1.00 (+44.9%)
$1.25 (+81.2%)
Biotechs May Be Trending HigherBiotech stocks broke out in late 2025, and now some traders may see potential for further upside.
The first pattern on today’s chart of the Nasdaq Biotechnology Index is the 2021 high of 5,518. NBI cleared that level in November and has remained above it since.
Second, the index jumped to a new record high in mid-April before pulling back. It then bounced at a weekly low from April 7, which could suggest support is in place.
Third, the 50-day simple moving average (SMA) is above the 100-day SMA. Both are above the 200-day SMA. That kind of sequence, with faster SMAs above slower SMAs, may reflect a bullish long-term trend.
TradeStation has, for decades, advanced the trading industry, providing access to stocks, options and futures. If you're born to trade, we could be for you. Learn more here about TradingView’s Broker of the Year!
Past performance, whether actual or indicated by historical tests of strategies, is no guarantee of future performance or success. There is a possibility that you may sustain a loss equal to or greater than your entire investment regardless of which asset class you trade (equities, options or futures); therefore, you should not invest or risk money that you cannot afford to lose. Online trading is not suitable for all investors. View the document titled Characteristics and Risks of Standardized Options at www.TradeStation.com . Before trading any asset class, customers must read the relevant risk disclosure statements on www.TradeStation.com . System access and trade placement and execution may be delayed or fail due to market volatility and volume, quote delays, system and software errors, Internet traffic, outages and other factors.
Securities and futures trading is offered to self-directed customers by TradeStation Securities, Inc., a broker-dealer registered with the Securities and Exchange Commission and a futures commission merchant licensed with the Commodity Futures Trading Commission). TradeStation Securities is a member of the Financial Industry Regulatory Authority, the National Futures Association, and a number of exchanges.
TradeStation Securities, Inc. and TradeStation Technologies, Inc. are each wholly owned subsidiaries of TradeStation Group, Inc., both operating, and providing products and services, under the TradeStation brand and trademark. When applying for, or purchasing, accounts, subscriptions, products and services, it is important that you know which company you will be dealing with. Visit www.TradeStation.com for further important information explaining what this means.
Day 57 of 90 — Decision Zone ExecutionDay 57 of 90 — Decision Zone Execution
XAUUSD | M15 | Sentinel Core
Situation
• Strong bearish expansion created a Lower Low (LL) at 4500
• Price reacted from demand
• Now pushing into intraday supply (4558–4562)
What This Chart Shows
• Confirmed structure: HH → LH → LL
• Current move = reaction, not reversal
• Price testing a key Lower High (LH) zone
👉 Transition phase — not bullish confirmation
Price Value Map
🟥 4568 – 4572 → Major Supply
• Previous breakdown zone
👉 Sellers in control
🟥 4558 – 4562 → Intraday Supply (LH Zone)
• Current reaction area
👉 Decision level
🟩 4525 – 4532 → Minor Demand
• Base of current move
👉 Must hold
🟩 4500 – 4510 → Major Demand (LL)
• Strong rejection
👉 Buyers stepped in
Market Structure
Before:
HH → LH → LL
👉 Bearish confirmed
Now:
LL → bounce → supply test
👉 No break = still bearish
👉 Break = possible shift
Market Flow
HH → LH → LL → bounce → LH test (current)
👉 Price is at the decision point
Execution (Sentinel Core)
❌ Do not trade the bounce
🔴 Sell Scenario
• Rejection at 4558–4562
• Forms Lower High (LH)
• Confirmation candle
👉 Continuation short
🟢 Buy Scenario
• Break above 4562
• Pullback
• Forms Higher Low (HL)
👉 Then long
Session Context
• London → continuation selloff
• NY → reaction from demand
👉 No confirmed reversal
Insight
• Reaction ≠ reversal
• Supply still active
• Structure not shifted yet
👉 This is a decision zone, not a signal
Sentinel Principle
You do not trade the move
You trade the confirmation
🛡️ No confirmation = No trade
Series Note
Day 57 = Trading the decision zone
#XAUUSD #Gold #PriceAction #MarketStructure #SupplyDemand
Bitcoin Is One Step Away From A MASSIVE MoveGood morning traders☀️🌴
Today Bitcoin reached 81,000 and continues moving toward the fifth target at 82,500 🎯
I expect this to be a difficult zone for BTC because major moving averages are located there: the 1W EMA 100 and the 1D EMA 200. These are strong resistance levels🛡️🛡️🛡️
The next move will depend on how confidently Bitcoin does or does not break through 82,500.
✅🚀If we get a confident breakout, then the next resistance levels at 84,000 and 86,500 no longer look that strong.
❌🧨If we get a rejection from the level, a correction toward the marked support levels is possible.
I updated the upside targets on the chart.
Support levels remain unchanged.
Peace✌🏽🌍
ASX 200 testing 8600 with RBA risk loomingOur ASX 200 contract has returned to the bottom of the prevailing sideways trading range it has been in since the latter parts of April, providing a level where several trade setups can be built depending on how the near-term price action evolves.
8600 is the immediate downside level to focus on, having acted as resistance in late March before flipping to support over the past week. Should the price retest and bounce from the level again, longs could be set above with a tight stop below, targeting the confluence of the 50, 100 and 200-day moving averages initially starting at 8772.9. If the price were to push above 8800, the obvious target overhead would be 8900 which previously acted as support, with 9040 another resistance zone where the index stalled on several occasions back in early April.
How the price interacts with the moving average zone, should it get there, may provide insight on whether to hold, cut or reverse the long position.
Alternatively, if the price were to break and hold beneath 8600, the setup could be flipped with shorts set on the break with a stop above, targeting the swing low of 8254 set on March 20. Some support may be encountered around 8400, so keep an eye on price action in that vicinity if the trade starts to work in your favour.
The message from the oscillators marginally favours selling into strength, although neither RSI (14) nor MACD suggests bears are in complete control. In a headline-driven market such as this one, price action may be more informative than where the prevailing momentum is shifting.
For anyone trading the index today, the RBA rate decision will be in focus, and likely have an impact on its performance depending on which way the bank decides to go, along with its messaging regarding the policy outlook. While I think the cash rate will increase today, I suspect the updated forecasts, statement tone and vote, which is likely to be a split decision, may struggle to live up to the three full hikes swaps markets have priced in by March 2027. If that eventuates, it may act as a release valve for the broader index, tilting directional risks higher near-term.
Good luck!
DS
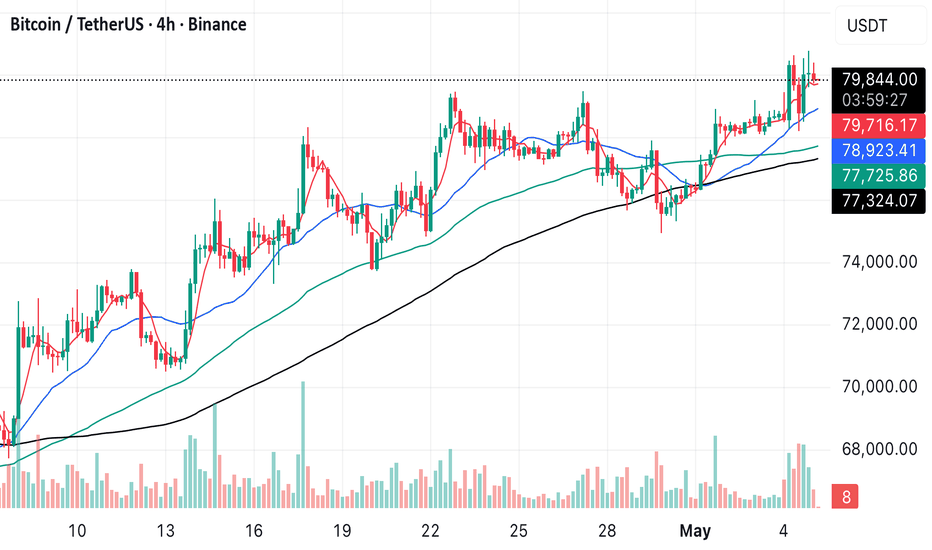
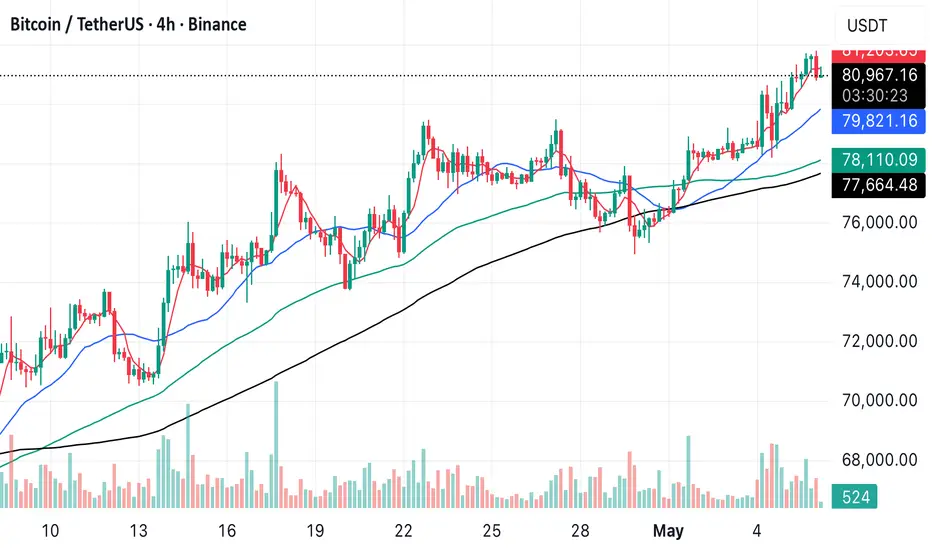
BTCUSDT 4H — Bullish Structure Holding, Watch for Pullback1. Bullish Structure Intact
The market continues to maintain a clean bullish alignment with 5 > 20 > 60. This indicates that the overall trend remains to the upside.
2. Strong Upward Momentum
Recent price action shows continued strength, with higher highs being formed. Buyers are still in control for now.
3. Early Signs of a Pause
However, a bearish candle is approaching the 5MA. If price breaks below the 5MA, it could signal a short-term pullback or consolidation.
4. Key Condition for Continuation
As long as price holds above the 5MA, the bullish structure remains valid and further upside can be expected.
5. What I’m Watching
* Whether price holds or loses the 5MA
* Strength of any pullback
* Continuation after consolidation
6. Stay Flexible
The trend is still bullish, but conditions can shift quickly. I’ll stay reactive and adjust based on how price behaves around the 5MA.
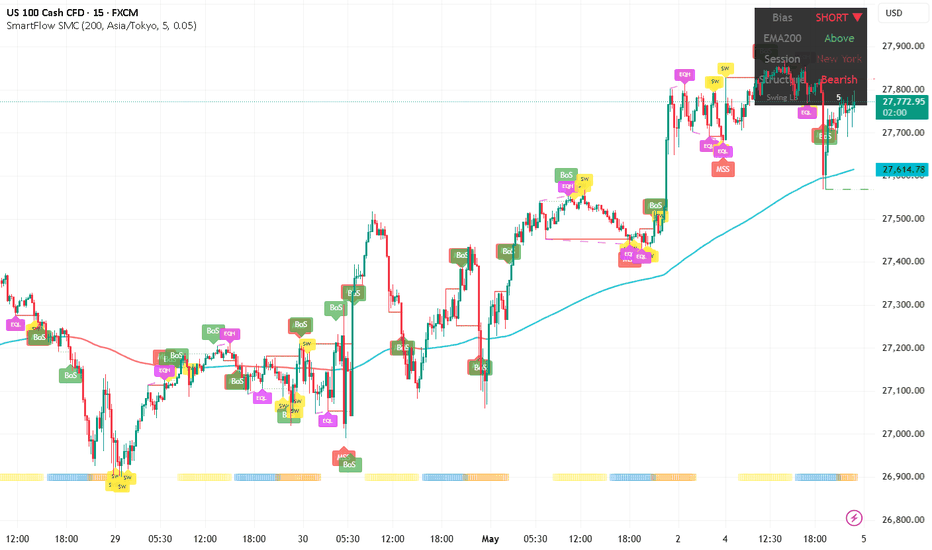
NAS100: Steady Bull No More — Structure Cracked at $27,900SmartFlow SMC Daily Cross-Asset Analysis — May 4
NAS has been the most consistent bull throughout this entire tracking period. That streak ended today. Structure flipped Bearish after the rejection from $27,900, though price remains $173 above EMA200 ($27,614). Conflict state.
Key Observations:
The push above $27,800 met resistance and produced a structural breakdown. BoS labels confirm the shift, and an MSS label is visible near $27,700 marking the crack. EQL labels in the $27,400 zone show liquidity building below — a potential sweep target.
NAS was the anchor throughout this tracking period — the first to achieve bullish alignment, the last to crack. Its structural break is significant because it completes a 4-for-4 bearish structure sweep.
The EMA200 margin of +$173 is the largest among all four assets — NAS is the last line of defense for the bulls.
Watch for: a break below $27,614 (EMA200) would complete full bearish alignment on all four assets — a reading we've never seen in 8+ weeks of tracking. The $27,400 EQL zone is the key support.
Cross-Asset Context:
If NAS and BTC both drop below their EMA200s, we achieve 4-for-4 fully aligned bearish — unprecedented in this tracking period. NAS's EMA200 margin (+$173) and BTC's (+$112) are the last barriers.
| Asset | EMA200 | Structure | Status |
| XAUUSD | Below | Bearish | 🔴 Aligned Bearish |
| BTCUSD | Above | Bearish | ⚠️ Conflict |
| EURUSD | Below | Bearish | 🔴 Aligned Bearish |
| NAS100 | Above | Bearish | ⚠️ Conflict |
Not financial advice. For educational purposes only.
EURUSD: Bullish Alignment Collapsed — Full Bearish in 3 DaysSmartFlow SMC Daily Cross-Asset Analysis — May 4
EUR's full bullish alignment — achieved just 3 days ago — has completely collapsed. Price at 1.1717 is now below EMA200 (1.1722). Structure is Bearish. Full bearish alignment confirmed.
Key Observations:
On May 1, EUR was the celebration story — the knife's edge resolved bullish at 1.1748 with +29 pips of cushion. Today, all of that is gone. The sell-off from the 1.1790 high was sharp, with BoS and MSS labels confirming the structural breakdown. Price sliced through EMA200 and the margin is now -6 pips.
EUR has been the most volatile swinger in this tracking period — and this confirms it. Full bullish to full bearish in 3 sessions. The EMA200 zone around 1.1720 continues to act as the gravity center.
Watch for: the 1.1660 zone as the next structural support. A reclaim above 1.1722 (EMA200) would re-enter conflict.
Cross-Asset Context:
EUR and Gold are now fully aligned bearish. BTC and NAS are in Bearish/Above conflict. The symmetry is clean: safe-haven and FX resolved first, risk assets holding their EMA200s for now.
| Asset | EMA200 | Structure | Status |
| XAUUSD | Below | Bearish | 🔴 Aligned Bearish |
| BTCUSD | Above | Bearish | ⚠️ Conflict |
| EURUSD | Below | Bearish | 🔴 Aligned Bearish |
| NAS100 | Above | Bearish | ⚠️ Conflict |
Not financial advice. For educational purposes only.
BTCUSD: Structure Cracked — Bearish Above EMA200SmartFlow SMC Daily Cross-Asset Analysis — May 4
BTC's full bullish alignment lasted just 3 days. Structure has flipped Bearish after the rejection from the $80,000 level, but price remains $112 above EMA200 ($78,793). The conflict state is back.
Key Observations:
The push to $80,000 was met with aggressive selling, creating a clear structural break. The BoS labels on the way down from $79,800 to $78,700 confirmed the bearish shift. An MSS↓ label is visible at the structural break point near $79,000.
This is a mirror image of BTC's Apr 24 conflict (also Bearish/Above) — which eventually resolved fully bearish before the May 1 bullish reversal. BTC has been the most volatile oscillator in the group, completing a full bearish→bullish→bearish structure cycle in under two weeks.
The EMA200 gap is just $112 — a thin margin. Price is testing right near the line.
Watch for: a break below $78,793 (EMA200) would create full bearish alignment. A reclaim above $79,800 would flip structure back bullish.
Cross-Asset Context:
All four structures are Bearish — the broadest bearish consensus since this tracking period began. BTC and NAS are still above their EMA200s, holding the last thread of conflict.
| Asset | EMA200 | Structure | Status |
| XAUUSD | Below | Bearish | 🔴 Aligned Bearish |
| BTCUSD | Above | Bearish | ⚠️ Conflict |
| EURUSD | Below | Bearish | 🔴 Aligned Bearish |
| NAS100 | Above | Bearish | ⚠️ Conflict |
Not financial advice. For educational purposes only.
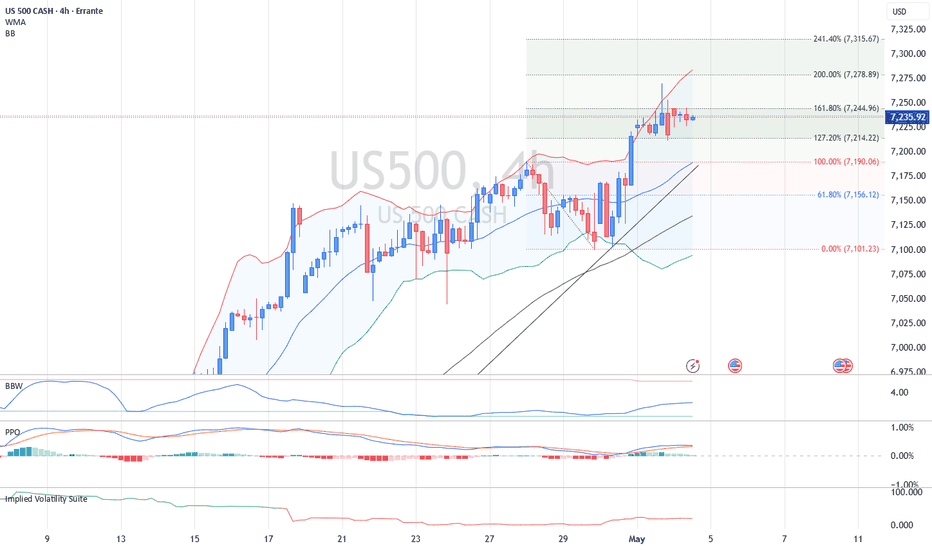
S&P 500 holds near highs as earnings strength offsets Hormuz risKey Takeaways
Project Freedom and tentative diplomacy keep risk appetite intact, while oil near $108 limits but does not break the equity rally.
Strong earnings momentum supports the index, with S&P 500 profit growth running around 25% to 27.8% and more than 100 reports due this week.
The chart stays constructive while price holds above 7,214 and especially above 7,190.
ISM services today, JOLTS tomorrow, and payrolls on Friday can still reset the rates and growth narrative.
Main scenario: the base case stays bullish while price remains above 7,214.22 and especially above 7,190.06. The next thing price must do is hold above the 161.8% extension at 7,244.96 or at least stay accepted above 7,214 on pullbacks. If that happens, 7,278.89 becomes the next upside objective. The bullish view is invalidated by a sustained four-hour close below 7,190.06.
Key levels
7,244.96: 161.8% extension and immediate breakout gate
7,278.89: 200% extension and next upside target
7,214.22: 127.2% extension and first pullback support
7,190.06: 100% marker and breakout base
7,156.12: 61.8% retracement and key trend support
7,101.23: 0.0% marker and deeper support
Alternative scenario: the opposing case is a failed extension driven by oil or yields. A close back below 7,190.06 would show the latest breakout has lost traction. That would likely expose 7,156.12 first, with deeper retracement risk if ISM surprises weak and shipping risks intensify at the same time.
BTCUSDT.PTechnical analysis of the BINANCE:BTCUSDT.P 4-hour chart based on my specific strategy:
📈 Overall Trend & Future Outlook
The price has successfully crossed above the 200-period EMA (black line), which serves as a key indicator for the start of a bullish trend. With the price also holding above the 50-period EMA (red line) and showing strong upward momentum, a breakout above the current resistance zone is expected to trigger a significant jump toward the next major target. 🚀
🟢 Key Support Levels
$71,000.0 🛡️
$65,700.0 📍
$61,500.0 🔒
🔴 Key Resistance Levels
$76,000.0 🎯
$86,500.0 🏁
⚠️ Notice: This is a technical analysis; please ensure strict risk management in your trades. ⚖️
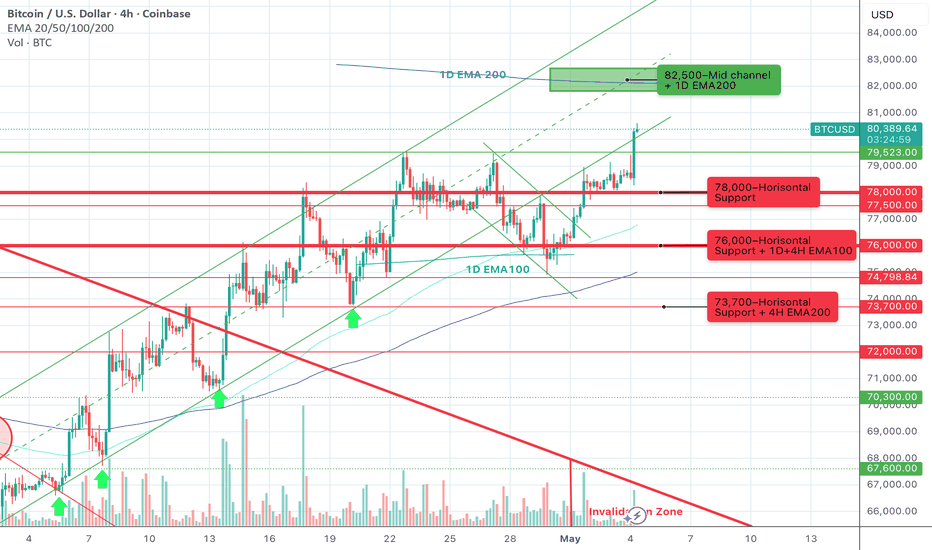
BTC JUST FOLLOWED THE PLAN PERFECTLYHi traders!
Today’s post will be short, because “the scenario on the lower timeframes remains more relevant than ever. Nothing to add.
…holding above 78,000 opens the way to 80,000+ and the fifth target at 82,500.
Holding below 76,000 means the correction continues toward the support levels marked on the chart.”
🚀🚀🚀🦬 As you can see on the chart, on Friday we broke above 78,000 and confidently held the level throughout the weekend. Today’s move to 80,000 is not a coincidence, but a precise continuation of the scenario outlined in advance.
Peace 🌍
BTCUSDT 4H — Bullish Structure with Short-Term Rejection1. Rejection at Key Resistance
Price moved higher but faced rejection around the recent high near 79,500. This level continues to act as a strong resistance zone.
2. Short-Term Weakness Appearing
A bearish candle has crossed below the 5MA, suggesting a pause in momentum. This signals a short-term cooldown rather than a confirmed reversal.
3. Bullish Structure Still Intact
Despite the pullback, the overall structure remains bullish with 5 > 20 > 60. This keeps the broader uptrend bias intact.
4. Next Potential Move
If price can reclaim the 5MA with a bullish candle, it may attempt another move toward 79,500. A breakout above that level could lead to further upside.
5. Still a Sensitive Phase
However, the structure is still relatively fragile. A continued move below the 5MA could weaken momentum further and delay the next bullish attempt.
6. What I’m Watching
* Reclaim of the 5MA
* Reaction at 79,500
* Strength of follow-through after any bounce
BTCUSDT 4H — Near Bullish Alignment, But Still Fragile1. Structure Improving
The market was previously in a 5 > 60 > 20 structure, but the 20MA is now crossing above the 60MA. This suggests a transition toward a cleaner bullish alignment.
2. Approaching Full Bullish Structure
If this shift completes, the structure will become 5 > 20 > 60 — a strong bullish trend configuration that often supports continuation to the upside.
3. Signs of Short-Term Weakness
However, at the same time, a bearish candle is approaching the 5MA. If price breaks below the 5MA, it could quickly weaken the structure again.
4. Unstable Phase
This creates a fragile situation where the structure could easily shift in either direction. The market is close to confirmation, but not there yet.
5. What I’m Watching
* Whether 5 > 20 > 60 fully confirms
* Price holding above or breaking below the 5MA
* Strength of follow-through after the shift
6. Wait for Confirmation
This is a key transition phase. I’ll wait for confirmation rather than anticipating the move. If the structure holds, continuation is likely — if not, conditions can change quickly.
Bearish USDCAD-analysis for the week of 04 MayIs it going to gap up or down when market opens for the week? No one knows so I want to say that there will be no gap and analyze this pair. This current war creates strange price movements, co-relations don’t seem to work, so best to just do a technical analysis knowing that price will respect what the charts are telling us.
Recent price movements
Undoubtedly this pair has been bearish for the past 4 weeks and I cannot see any reason why this trend should not continue. A support/resistance area (1.3600 – 1.3630) was formed recently and price broke below it with good momentum on Thu and a weak pullback followed on Fri. This looks like a nice breakout / pullback formation and I would like to trade this to the short side. All other time frames also support my bearish bias.
Trade parameters
These are times of fake news and a high level of market manipulation. Trading with smaller position size and giving extra space for stops is recommended. Gaps are regularly seen and anticipating the market open and initial moves is impossible. However, the following scenario would make sense:
Entry – The pullback will likely continue for a while and evidence of bearish evidence would be the right location to enter.
Stop – above the nearest major swing high (currently 1.3720).
Target(s) depend on the trading style, but I have marked a couple of options. I would stay flexible and remain open to taking profit and re-entering if price action confirms a continued move.
General comment
Nothing in trading is ever 100%, so please allow price action to fully develop in your desired direction before executing a trade.
This is not a trade recommendation
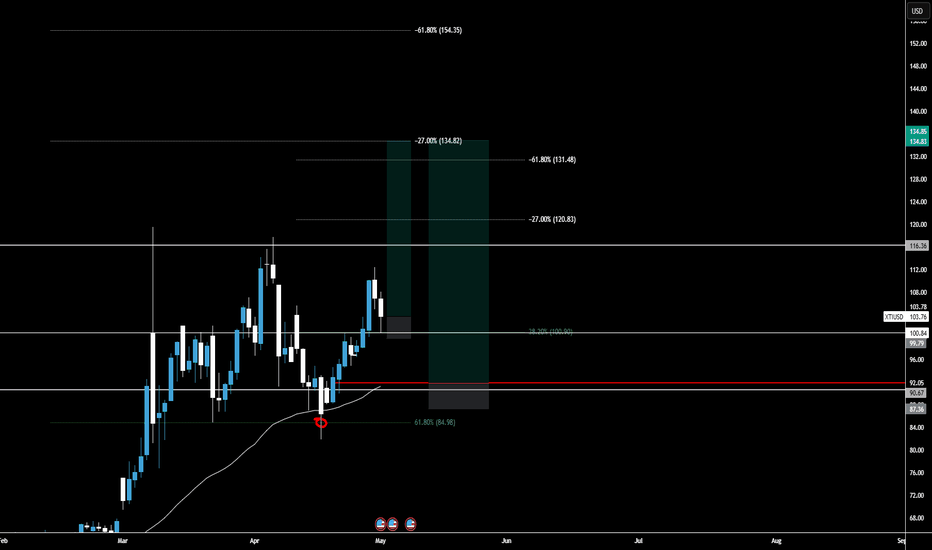
OIl BUYSPrice continuation for Oil at market open.
Looking for price to respect the 38.2 Fib level given the amount of bullish pressure once price broke above $100. We also have price respecting the 50 EMA on the 4h and closing with an indecision doji candle.
If price does move lower, I will look for entries at the red line with stops below the bullish candle