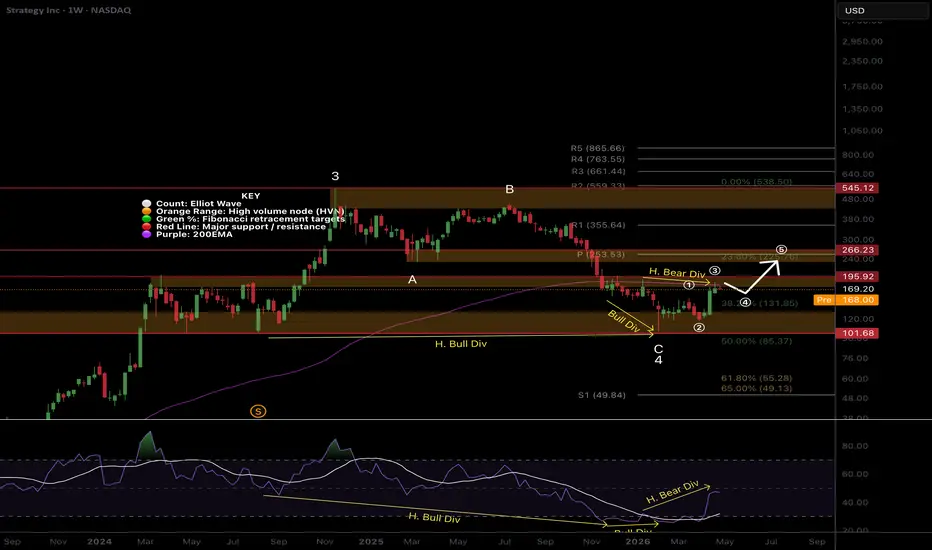
MSTR Macro analysis | The bigger picture | Long-term holdersNASDAQ:MSTR continue to stack BTC and is now well over 800,000. Price action is reliant on Bitcoin moving with a Beta >1. Price completed a textbook ABC for wave 4 and now appears to have completed 3 waves up, ending at the weekly 200EMA. Bulls need to see this overcome, then the weekly pivot and HVN double resistance at $266 for confidence we return to ATH.
📈 Weekly RSI hit oversold with hidden bullish divergence, bullish divergence, and now printing hidden bearish divergence. Price must get above $194 to negate this.
👉 Analysis is invalidated if we close below $101, keeping the bear trend alive and well
Safe trading
Pivot Points
MSFT Short-term analysis | Trading and expectationsNASDAQ:MSFT had a great rally straight back to the daily 200EMA, where wave 1 appears complete, and price is likely to be rejected on the first test as resistance. Wave (2) has a target of the HVN at $387, just above the daily pivot. Until the daily 200EMA is overcome, the bears are still in control. The structure remains bearish with no higher highs or higher lows yet.
📈 Daily RSI is showing hidden bearish divergence in overbought, so a rejection here is highly likely.
👉Analysis is invalidated if price falls below wave (II) $345, keeping the bear trend alive
Safe trading
BTDR Short-term analysis | Trading and expectationsNASDAQ:BTDR recovered the daily 200EMA, but has been rejected, losing it again. It remains above the daily pivot, so there is ambiguity in the trend locally as well as on the macro. So far, the structure is 3 waves up, which is a corrective wave, not impulsive, so the bulls need to see another local higher high sooner rather than later.
📈 Daily RSI hit overbought with hidden bearish divergence, but is resetting fast, which is a good sign for the bulls.
👉 Analysis is invalidated if price closes below the HVN at $9, suggesting this was just a counter-trend rally
Safe trading
BTDR Macro analysis | The bigger picture | Long-term holdersNASDAQ:BTDR found support at the Fibonacci (Fibs) golden pocket and rallied hard. Wave © of B appears to have ended truncated (above wave (a), which is unusual but can happen. The weekly 200EMA has been recovered, but the price remains below the weekly pivot, demonstrating ambiguity in the trend. The bulls need to see the weekly 200EMA hold and the High Volume Node (HVN) resistance overcome for confidence.
📈 Weekly bearish divergence in RSI played out from the all-time high. RSI has lower to go until oversold, and a bearish divergence is building, though not confirmed.
👉 Analysis is invalidated if price goes below wave © keeping the bear trend alive, with a target of the 0.786 Fibs $4.65
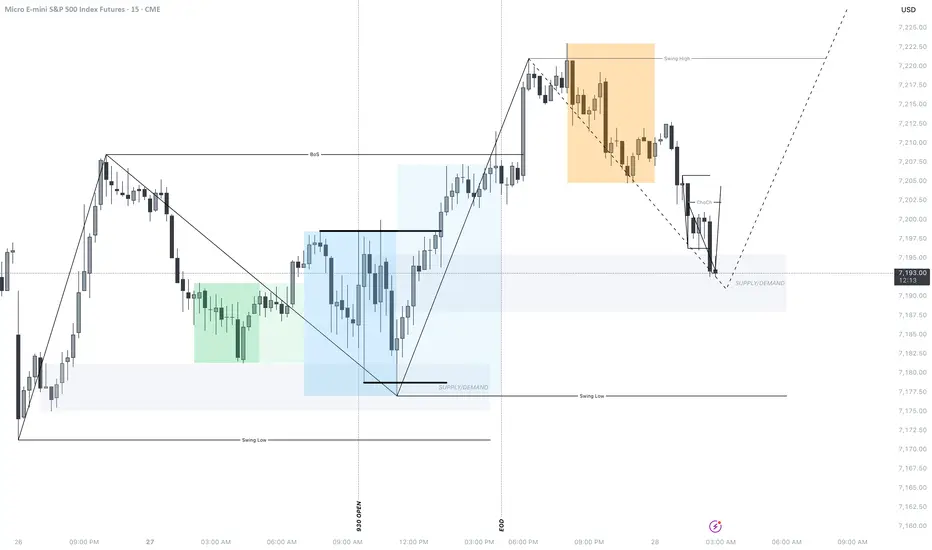
04/27/2026 Market Structure OverviewToday was a classic high-volatility session environment (especially open) where market structure is being manipulated to hunt liquidity before the real trend establishes.
1. The Liquidity Sweep (9:30 AM Open)
The market immediately attacked the London Session boundaries.
By spiking above the London High and then immediately flushing below the London Low, the market cleared out both "breakout" buyers and "protection" stops.
The Support/Demand Zone: Notice the reaction at the bottom. This isn't just random support; it’s a mitigation of a higher-timeframe demand zone. The long wicks at indicate massive buy orders being filled, effectively "trapping" the shorts who sold the 9:40 flush.
2. The Internal Change of Character (iCHoCH)
This is the most important part of your current view.
After hitting that Demand Zone, price moved aggressively upward, breaking the internal lower-highs created during the morning sell-off.
The Internal ChoCh confirms that the HTF pullback from the morning is over. The market has shifted back to a bull trend using the morning's volatility as fuel. Above image shows structure going into tomorrow, 04/28/2026.
The Pullback
Currently the market is pulling back into demand on the 15m chart.
The HTF bullish trend is still in tact.
I would be looking for a lower time frame ChoCh that pushes us out of that demand zone and back up into the current range
This would confirm that the HTF structure should continue, and at this point you could target liquidity above as well as the current Swing High. Above image shows expected move (generally speaking) Above image shows what I would be looking for on the lower time frame as a signal for HTF Bullish Continuation.
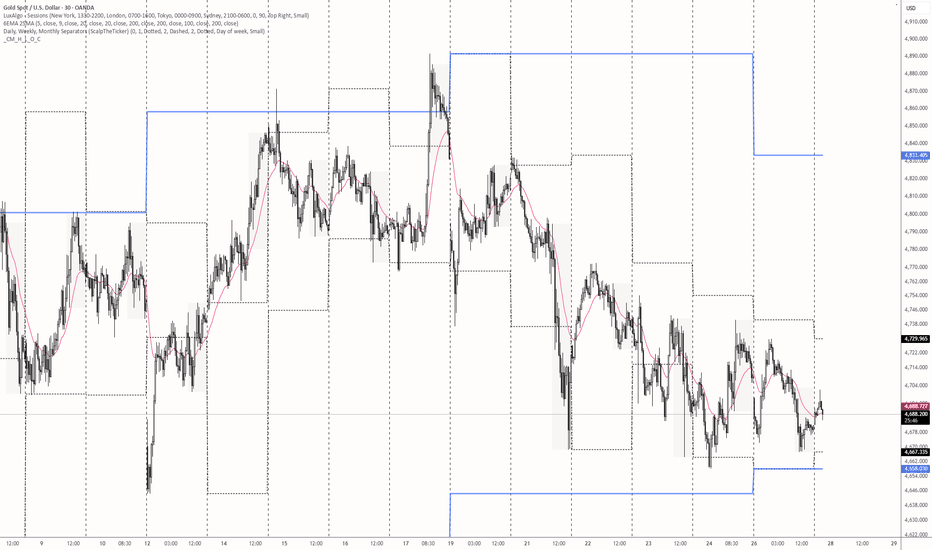
Gold Inside Day Signal - Backside of the Month Reversal Idea
Gold gave us an inside day on Monday (opening range). Price is hovering over last week's low of the week (4658) and the low of the week before on April 10 (4644). If an opportunity presents during the NYSE open (9:30 AM EST), we'll look for a quick move towards the lowss that breaks all 3 (1) yesterday's LOD (Inside low) at 4668 (2) last week's low at 4658, and (3) April 10 low at 4644) triggering short sellers and breakout traders in the process as well as potentially hunting higher timeframe (HTF) trader's long stops.
From there, our best trade setup BTS would be a quick rebound and close above the 20 EMA on the 1 or 5 minute timeframe for a reversal long towards yesterday's inside day high as TP1 (4730). Depending on our entry, our stop can be below the most recent low when price closes above the 20EMA.
Our second favorable setup after squeezing all lows would be a continuation trend, inline with the backside of the month (week 4). Method of entry would only be if price breaks and closes below 4644 with an entry on the rejection of the 20EMA on the same 1 or 5 minute timeframe.
If the market moves during the London Session or if those 3 extremes are not tapped during the first opening hour of the NYSE, there will be no trade and the idea is deemed invalid.
Panduhh's Tesla Blueprint for Swingers So I have given the intraday pivots, however I was at limit before I was able to post this one for Swing Traders. Here are the pivot levels, Price directly at PP.
----------------------------------------------------------------------------------------------------------------------
These are the equilibrium levels for the current structure in Tesla
Levels are derived from internal framework using structure and geometric relationships—not time-based inputs.
Focus is not on prediction, but on order flow response at price.
Reaction at each level determines outcome:
– Acceptance → continuation within value
– Rejection → rotation away
– Failure → discovery beyond the range
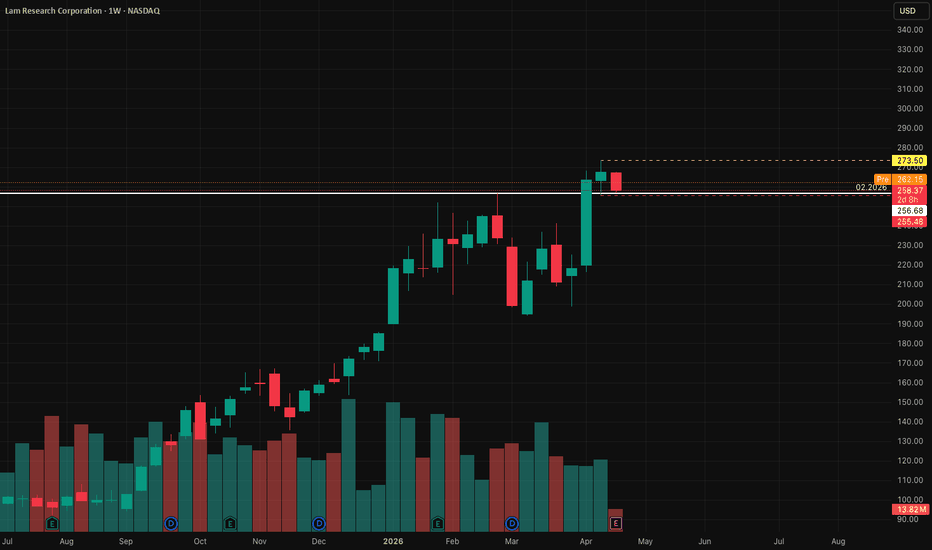
April 22, 2026 LRXC. Continued stock growth.- Exchange: Kraken
- Instrument: xStocks
- Timeframe: Weekly
- Trade type: Buy limit order
- Price: 273.50
- Take Profit: Open
- Stop Loss: 255.48
Idea: Enter on a breakout of the high of last week’s candle—a signal of continued upward momentum.
Entry: Buy Stop above last week’s high.
Stop-loss: Below the low of the same candle. A pullback below this level invalidates the trade.
Take Profit: Trailing stop following the lows of new weekly candles.
This is not an individual investment recommendation.
Nifty Analysis EOD – April 27, 2026 – Monday🟢 Nifty Analysis EOD – April 27, 2026 – Monday 🔴
Inside Bar Coiling: Nifty Pauses as Volatility Contracts.
🗞 Nifty Summary
After a refreshing rejuvenation break from the markets, I returned to my desk today to observe the semi-final sessions before the May series begins.
The Nifty started the week with a 73-point Gap Up, although this was notably weaker than the +200 point indications from Gift Nifty earlier in the morning.
After the opening tick, the index showed early strength, adding a further 130 points to mark an initial high at 24,107.60 before establishing the Initial Balance (IB).
The intraday journey was a classic range-bound struggle. After marking the high, the index gradually drifted back to the Current Day Open (CDO), only to find support and bounce back toward the day’s peak.
In the final hours, bulls attempted to shatter the IBH but remained stuck within a tight 30-point small box near the ceiling. Nifty eventually ended the day at 24,110.20 (Adjusted close: 24,092.70), gaining +194.75 points (+0.81%).
Technically, today’s price action is significant due to the extreme volatility contraction. The total range was only 195 points—exactly half of the previous session’s range—and movement remained contained within the previous day’s high and low, successfully forming an Inside Bar setup. In our strategy, this coiling effect usually precedes a high-velocity expansion. Based on this setup, the projected targets are 24,520 for a bullish breakout and 23,540 for a bearish breakdown.
🛡 5 Min Intraday Chart with Levels
📉 Daily Time Frame Chart with Intraday Levels
🕯 Daily Candle Breakdown
Open: 23,945.45
High: 24,130.70
Low: 23,936.20
Close: 24,092.70
Change: +194.75 (+0.81%)
🏗️ Structure Breakdown
Type: Bullish candle (Inside Bar).
Range: ≈ 195 points — Moderate volatility (Volatility Contraction).
Body: ≈ 147 points — Reflects strong buying pressure within the tight range.
Upper Wick: ≈ 38 points — Mild resistance encountered near the day’s peak.
Lower Wick: ≈ 9 points — Very limited downside rejection; bulls held the open well.
🛡 5 Min Intraday Chart
⚔️ Gladiator Strategy Update
ATR: 362.04
IB Range: 171.40 → Medium
Market Structure: Balanced
Trade Highlights:
12:26 Long Trade: Target Hit (R:R 1:2.48) (Support Bounce toward IBH).
Trade Summary: Coming back from the break, I maintained a strictly observant stance for most of the morning. However, the system identified a high-probability long entry at 12:26 PM as the index defended the CDO and rotated back toward the highs. It was a disciplined trade that hit its target smoothly within the established range, providing a good confidence builder for the start of the week.
🧱 Support & Resistance Levels
Resistance Zones: 24,175 ~ 24,210 | 24,310 | 24,424 | 24,520 (Expansion Target)
Support Zones: 23,815 ~ 23,775 | 23,555 ~ 23,540 (Breakdown Target) | 23,400
🧠 Final Thoughts
“A compressed spring stores the most energy.”
The Inside Bar setup is the primary narrative for tomorrow.
We have clear battle lines drawn at today’s extremes.
If the market opens within today’s range, we must wait for a decisive breakout of the IB to confirm direction. A breach of 24,130 could spark the move toward the 24,520 target, while a slip below 23,936 would shift the focus to the downside. I will stay patient and let the Initial Balance guide my resumption of active trading in the May series.
✏️ Disclaimer
This is my personal digital diary and represents my own analysis and point of view. It is not financial advice; please consult a professional advisor before making any trading decisions.
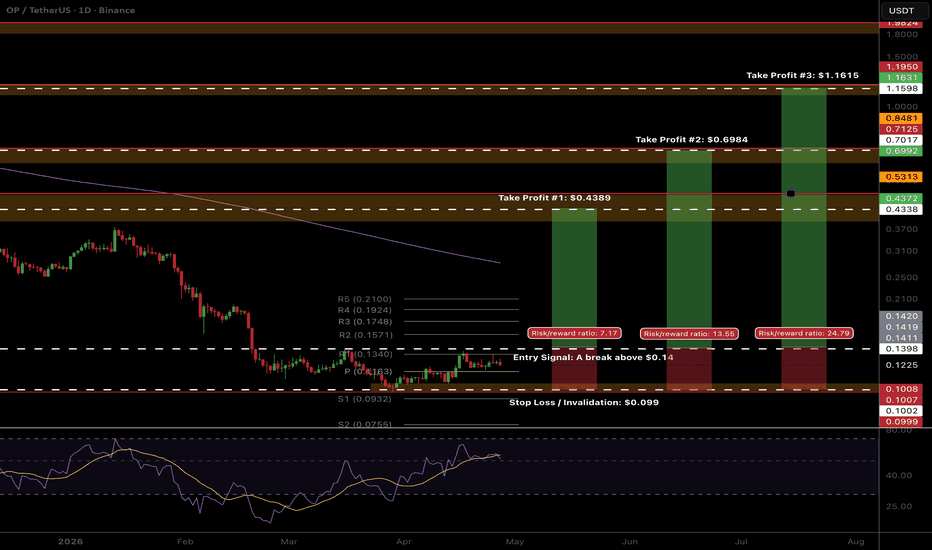
OP:USDT Ready to break out?TSE:OP CRYPTOCAP:ETH layer 2 could put in a strong reversion to mean if it can break above the all-time low resistance.
I would expect the daily 200EMA to at least be tested as resistance.
Any failure to rally alongside the broader crypto market could signal another dead coin..
ZAMA Sell/Short Setup (4H)ZAMA has encountered an important area after forming a SW H.
Then, a bearish iCH was formed on the chart.
The internal structure indicates that a larger structure is likely to become bearish soon.
If the price reaches the specified supply zone, it could drop downward. You can enter the supply box with a DCA approach or wait for confirmation.
The targets are marked on the chart.
Closing a daily candle above the invalidation level would confirm a violation of this analysis.
If you would like us to analyze a coin or altcoin for you, first like this post, then comment the name of your altcoin below.
What is your opinion about ZAMA?
GBPUSD Weekly Market Map - Bullish Structure & Liquidity DevelopPair: GBP/USD
HTF Bias (4H / 2H): Bullish
HTF Overview:
Higher time frame structure remains bullish, and the overall mapping is now in an advanced stage. This is a process-driven framework—price doesn’t move randomly, it delivers through phases, and our job is simply to track those footprints.
In previous weeks, price delivered a controlled pullback within the bullish range. After internal liquidity was swept, there was no immediate midterm shift. Instead, price extended deeper, targeting higher time frame internal liquidity and mitigating a key HTF order block (blue zone) within discounted territory.
That mitigation confirmed the area of interest.
Midterm Structure:
Following the HTF reaction, price delivered a bullish midterm shift by breaking a key lower high. This established a new structural high and initiated early-stage distribution/positioning on both a minor and macro scale.
At this stage, price is likely to:
Seek a minor internal liquidity sweep
Retrace into the orange zone (refinement/test area)
Then look for continuation upon confirmation
Execution Model (30M → 5M):
I’ll be watching for:
Internal liquidity to be taken
A clean lower timeframe shift back bullish
Alignment with the HTF narrative before entry
No confirmation = no execution.
Narrative Insight (Advanced View):
Instead of viewing this through a candle-based model like CRT, I’m reading this as structural phases.
What I anticipate:
A sweep of internal liquidity
Quick structural formation (liquidity leg)
Reaction from the orange zone (manipulation phase)
Expansion higher
This aligns closely with a phase-based “count of three” concept, where the final phase delivers the true move.
Targets:
Midterm highs
(Only after confirmation and alignment)
Current State:
HTF mapping: Complete
POI (blue zone): Confirmed
Structure: Shifted bullish
Now: Tracking phase development
The move has started, but the full delivery still needs time.
Plan Moving Forward:
When the market opens, I’m not rushing execution.
My job is simple:
Track structure
Observe phases
Let price come to me
Updates:
Midweek refinement (Wednesday/Thursday)
End-of-week recap (Friday)
For real-time tracking and footprint reads, follow my Speak My Minds—that’s where I stay active during live conditions.
Mindset Note:
Patience is what allows structure to develop.
No patience = no edge.
Let the market reveal… then execute.
Patience is key
Tracking is the edge
let's go
#TON LONG Back in IVZ support zone🟢 LONG #TON Back in IVZ support zone
Coin has been ranging for 83 days. Looks like a large player is accumulating position. While they accumulate — we can profit from the range.
🟢 Entry zone: 1.2512–1.1746
🔴 Stop: 1.0889
🎯 Targets: 1.4775 / 1.7897
#TON #Altcoins #Crypto #Long #TechnicalAnalysis #CryptoSignals #TradingSignals #CryptoTrading
📌 My profile: Wall Street Levels
🔗 www.tradingview.com
TLong
The STG structure is turning bearish (4H)A bearish iCH can be seen in the internal structure, indicating that the larger trend may soon turn bearish.
We have marked a zone on the chart for a potential downside price rejection. In that area, after getting confirmation, one can look for sell/short positions.
Targets are marked on the chart. Move your stop to breakeven at the first target.
A daily candle close above the invalidation level will invalidate this analysis.
If you would like us to analyze a coin or altcoin for you, first like this post, then comment the name of your altcoin below.
What is your opinion about STG?
Bitcoin has formed a bear trap | Will Bitcoin reach 90K?First of all, make sure to check my signature so you don’t miss important updates and key analyses.
Market makers have planned for short positions and have manipulated price volatility in a way that makes it seem like the bearish trend will continue — but suddenly, they may wipe out your capital. How? In the following, we’ll explain how this happens and what signs we can see on the chart.
Bitcoin bounced upward after hitting a strong demand zone and formed a bullish iCH.
Then, after a period of sideways movement that exhausted traders, it formed a liquidity trendline and broke it strongly to the downside. Breaking such trendlines near strong support levels can be a bear trap and is very dangerous!
Bitcoin is expected to continue moving upward, putting short positions at a loss and possibly even liquidating them.
Also, if you look closely, a bullish head and shoulders pattern has formed at the bottom.
The targets for this move could reach 90K. There are billions of dollars in liquidity around that level!
We must act smart and ride the whales’ momentum!
What do you think? Do you also believe Bitcoin is bullish and that market makers will push it higher?
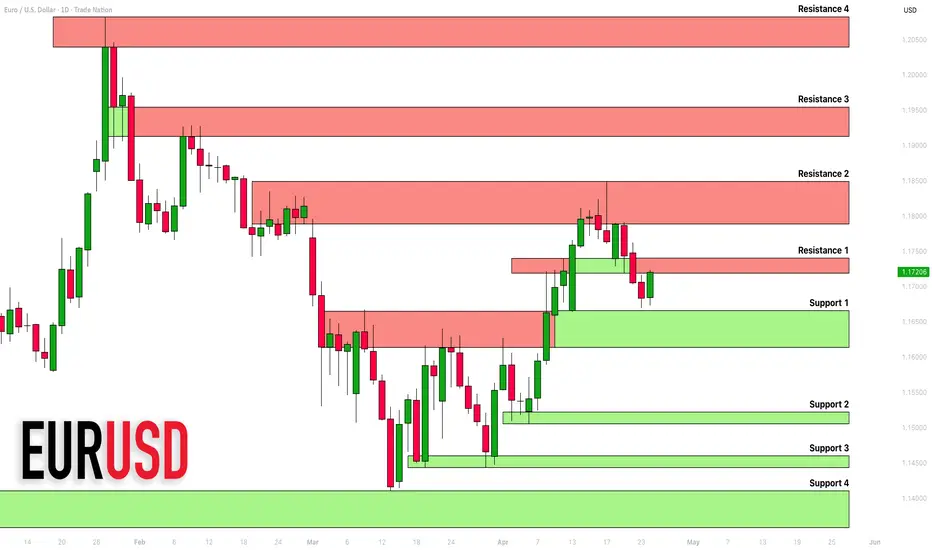
EURUSD: Support & Resistance Analysis for Next Week 🇪🇺🇺🇸
Here is my latest structure analysis and important supports and resistances
for EURUSD for next week.
Consider these structures for pullback/breakout trading.
❤️Please, support my work with like, thank you!❤️
I am part of Trade Nation's Influencer program and receive a monthly fee for using their TradingView charts in my analysis.
DYDX seems ready for an upward surge (4H)A trigger line has been broken, and the price is currently pulling back to retest this trigger line.
After forming a swing low (SWL), the price has moved upward and created a bullish change of character (CHoCH), indicating the presence of buyers.
Considering the price compression and the loss of bearish momentum, we will look for buy/long positions within the specified zone.
Targets are marked on the chart; move your stop to breakeven at the first target.
A daily candle close below the invalidation level will invalidate this analysis.
If you would like us to analyze a coin or altcoin for you, first like this post, then comment the name of your altcoin below.
What is your opinion about DYDX?
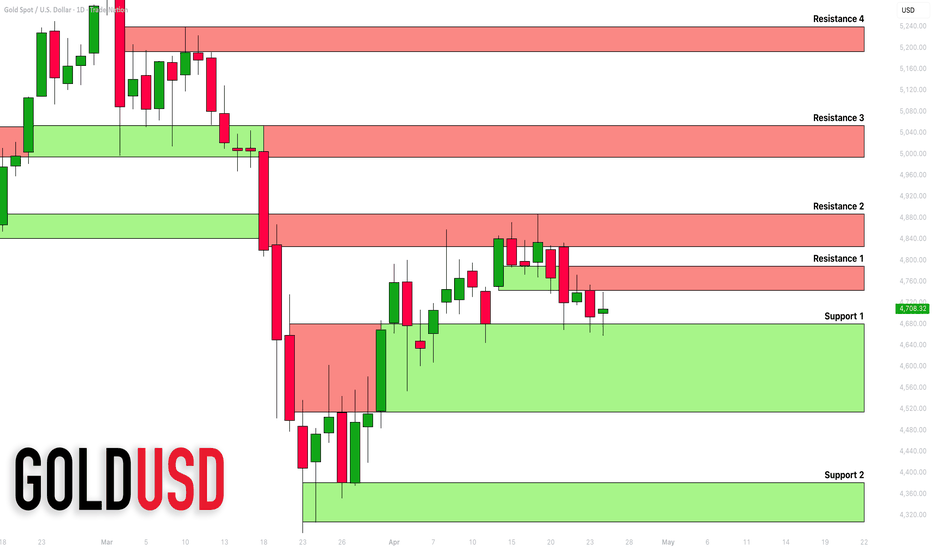
GOLD (XAUUSD): Support & Resistance Analysis for Next Week
Here is my updated structure analysis for Gold.
Resistance 1: 4744 - 4790 area
Resistance 2: 4825 - 4887 area
Resistance 3: 4994 - 5055 area
Resistance 4: 5192 - 5239 area
Support 1: 4513 - 4681 area
Support 2: 4307 - 4381 area
Consider these structures for pullback/breakout trading.
❤️Please, support my work with like, thank you!❤️
I am part of Trade Nation's Influencer program and receive a monthly fee for using their TradingView charts in my analysis.
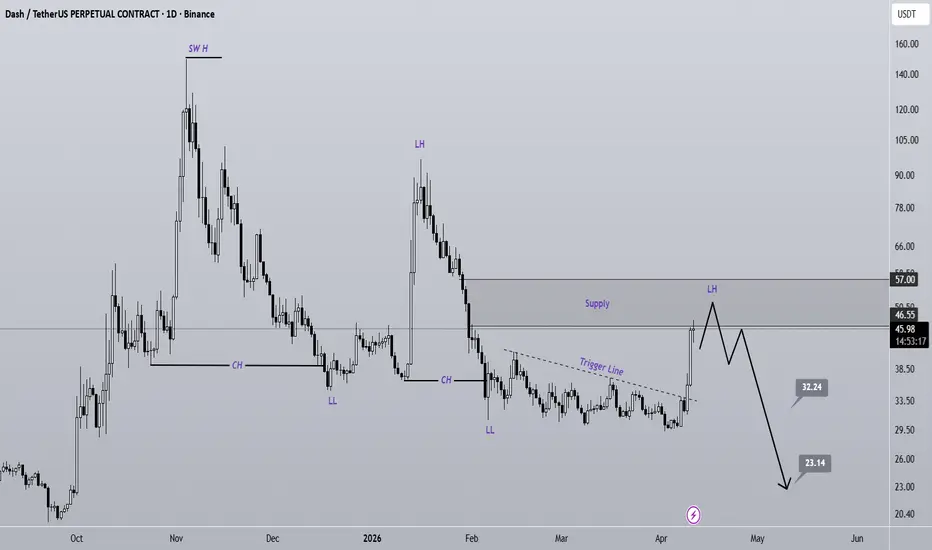
DASH Looks Bearish (1D)The structure of DASH appears bearish on higher timeframes. Upon reaching the desired supply zone, we expect a rejection toward the specified targets.
Bearish CHs indicate the presence of sellers.
At the supply zone, either wait for confirmation or enter using DCA.
Take partial profits at the first target and move to breakeven. If you are risk-averse or a short-term trader, close the entire position at the first target.
If you would like us to analyze a coin or altcoin for you, first like this post, then comment the name of your altcoin below.
What is your opinion about DASH?
ATOM looks ready to take off (12H)A trigger line has been broken, and we have a bullish CH on the chart both are signs of buyer strength. Price is also trading near a key level that is important for us.
We have two entry points on the chart, and positions should be built using a DCA approach.
Targets :1.842 _ 2.032
secure partial profits at the first target and then move your stop to breakeven. A hit of the stop level will invalidate this analysis.
If you would like us to analyze a coin or altcoin for you, first like this post, then comment the name of your altcoin below.
What is your opinion about ATOM?
Bears are in control of COMP price action (8H)Price has reacted to a supply zone and then broke below the bullish trendline to the downside. We also have a bearish ICH structure on the chart, and the candle that touched the supply was rejected immediately with a wick. Based on this, it is expected that COMP may move toward lower levels.
Two clear entry points have been marked for DCA entries.
Targets are marked on the chart, and at the first target you should move to break even.
A daily candle close above the invalidation level will invalidate this analysis.
invalidation level: 27.10$
If you would like us to analyze a coin or altcoin for you, first like this post, then comment the name of your altcoin below.
What is your opinion about COMP?