Bitcoin Gann Fan Analysis: Is BTC Entering a New Bullish Phase?
Bitcoin’s weekly chart is at an interesting point.
Instead of trying to forecast exactly where BTC will trade months from now, this analysis uses a Gann Fan to map the larger structure and identify the areas where price may give us the next important piece of information.
What makes the current setup especially interesting is that the structure isn’t new. The Gann Fan has been drawn from the major market low around November 2022, and Bitcoin has interacted with its different levels several times since then.
Now another important reaction has taken place.
🧭 A Structure That Started in 2022
The Gann Fan in this chart originates from the major Bitcoin low in November 2022 and uses the following early market structure to establish its geometry.
From that point forward, the Fan creates a series of diagonal reference levels across the weekly chart.
Looking at the larger move, BTC has repeatedly approached, respected or broken different parts of this structure.
That doesn’t mean the Gann Fan predicts every reversal.
For me, its value is different:
It creates a framework for understanding where price is located within a larger trend.
🔻 When One Gann Level Breaks, the Next One Matters
An important change occurred during the decline from late 2025 into early 2026.
Bitcoin moved below a Gann level that had previously been relevant to the broader structure.
Once that happened, there was little reason to assume the broken level would automatically save the market again.
Instead, attention shifted toward the next lower Gann line.
Eventually, BTC reached that area and produced a noticeable reaction.
This is one of the simplest ways I like to think about technical analysis:
Level breaks → identify the next structure → observe the reaction.
No prediction is required.
🚀 The Downtrend Has Now Been Broken
The reaction from the lower Gann area was only the beginning.
During the correction, Bitcoin had also developed a clear descending trendline on the weekly chart.
BTC has now pushed through that structure to the upside.
That breakout changes the situation.
It does not guarantee that Bitcoin has entered a major new uptrend, but the market is no longer behaving exactly as it did during the previous decline.
For now, this makes the bullish scenario more interesting to me, provided Bitcoin can maintain the improved structure.
📊 The Next Resistance Areas Matter First
Before focusing on distant price targets, Bitcoin still needs to deal with several resistance zones above the current market.
These are the areas I would watch first.
If BTC continues reclaiming resistance while maintaining the breakout structure, the higher lines of the Gann Fan can gradually become more relevant.
The idea is therefore not:
Breakout = buy and wait for a huge target.
It is:
Breakout → next resistance → reaction → reassess.
That keeps the analysis flexible.
🎯 What About $160K–$180K?
Following the larger Gann structure higher eventually brings a region around $160,000–$180,000 into view.
It’s an interesting possibility, but I would not treat that region as a fixed price target.
Bitcoin has several important areas to work through before such a scenario becomes meaningful.
If BTC continues building bullish structure, those higher Gann levels could eventually become relevant.
If it fails along the way, the analysis changes.
The projected path on the chart should therefore be viewed as a scenario rather than a forecast.
📉 There Is Still a Bearish Scenario
The downside should not be ignored simply because the descending trendline has been broken.
If Bitcoin fails to hold the current structure and loses the important Gann area beneath price, I would shift attention away from the higher projection.
The next lower Gann level would then become increasingly important.
That leaves us with two basic scenarios:
📈 Bullish:
BTC holds the breakout structure → resistance levels are reclaimed → higher Gann areas become relevant.
📉 Bearish:
BTC loses the current structure → breakout weakens → attention moves toward the next lower Gann level.
We don’t need to choose the final outcome today.
🧠 The Gann Fan Is a Framework, Not a Signal
This is probably the most important part of the analysis.
A Gann line should not automatically be interpreted as a buy or sell signal.
The line tells us where to pay attention.
Price tells us what happens next.
That’s also why understanding tools such as the Gann Fan goes beyond simply knowing where to draw them. In our trading courses, this type of analysis is part of a broader approach to understanding market structure, reactions and changing scenarios.
The full methodology goes considerably deeper, but the underlying principle is straightforward:
The tool provides structure. Price provides confirmation.
🔍 Final Thoughts
Bitcoin has reacted from an important lower Gann area and subsequently broken its descending weekly structure.
That makes the upside increasingly interesting.
But BTC still needs to prove itself through the resistance areas ahead before distant regions such as $160K–$180K deserve serious attention.
And if the current structure fails, the lower Gann levels remain part of the map.
That’s why I prefer preparation over prediction:
📐 Map the structure.
👀 Watch the reaction.
📊 Wait for confirmation.
🔄 Update the scenario.
The chart doesn’t need to tell us Bitcoin’s entire future.
It only needs to show us what matters next.
For educational and informational purposes only. Not financial advice.  Long
Long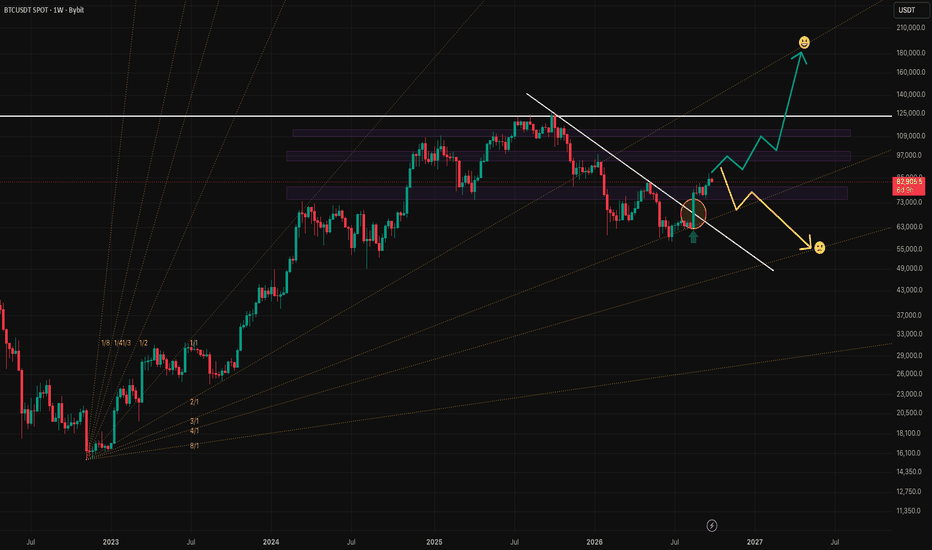
 Long
Long
ETHUSD 1H: Range Breakout & Liquidity Sweep Reclaim (Long Setup)
1. Market Context
On the 1H chart, ETH/USDT has been consolidating inside a wide horizontal range bounded between 2,370.00 and 2,530.00 for over two weeks. After sweeping liquidity down to the 2,439.75 support floor, price is aggressively pushing back up to test and break out above the range resistance ceiling at 2,526.97.
2. Sentiment & House Trap Analysis
Where Traders Place Orders: Retail traders seeing the upper resistance boundary holding repeatedly around 2,526.97 – 2,540.00 opened SELL positions, expecting ETH to reject again and fall back toward the range mid-level or bottom.
Trader Stop-Loss & Target: Shorters placed their Stop-Loss orders tightly above the range ceiling at 2,540.00 – 2,550.00, while early buyers placed SLs beneath 2,439.75.
How the House Plays It: The House flushed price down to 2,439.75 to liquidate weak long positions and collect sell-side liquidity. Once absorbed, the House engineered a strong V-shaped recovery. A 1H breakout above 2,526.97 will trigger a short-squeeze (forced buy-stop market orders from trapped shorters), fueling an expansion toward 2,614.19 (TP1) and 2,701.41 (TP2).
3. Trade Setup
Entry: 2,526.97 (Confirmed 1H close breaking above horizontal range resistance)
Stop Loss (SL): 2,439.75 (Placed safely below the liquidity sweep swing low)
Take Profit 1 (TP1): 2,614.19
Take Profit 2 (TP2): 2,701.41
Risk-to-Reward Ratio (R:R): Approx 2.0:1 (Calculated toward TP2)  Long
Long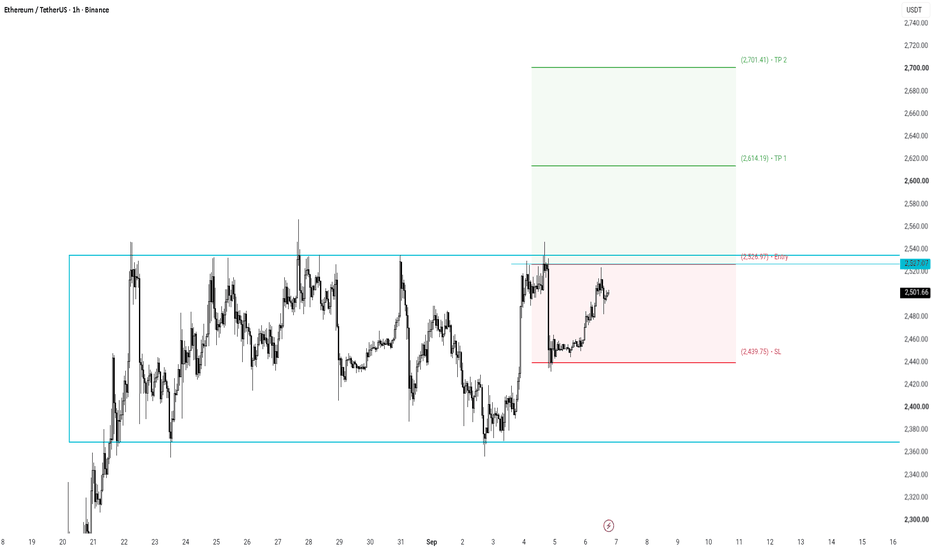
Long 
 Long
Long
 Long
Long
DECODING BTC TOPS & BOTTOMS: THE ANATOMY OF PRICE TRAPS1. Core Philosophy: How Tops & Bottoms Are Formed
The market does not run on textbook technical indicators. The market runs on Liquidity.
Top: Not a safe buying zone, but where the House triggers retail FOMO to DUMP inventory onto late buyers at the highest possible price.
Bottom: Not where the market dies, but where the House creates extreme panic to STEAL cheap bags from panicking sellers.
2. Breaking Down the 4 Trap Phases on the Daily (1D) Chart
Phase 1: Top Buying Trap (Macro High ~124,696 USDT)
Retail Sentiment: Retail sees BTC break $100,000 and surge to $124,696, aggressively buying out of FOMO expecting $150,000 – $200,000+.
House Execution: Once retail buying capacity reaches its peak at the most expensive price, the House quietly unloads inventory. Buying volume dries up, locking in the macro top at $124,696.
Phase 2: Structural Breakdown & The "Kill Zone" (84,000 – 86,000 USDT)
Retail Sentiment: As price drops from the peak, the $84,000 – $86,000 region acts as a major support floor where retail clusters to buy the dip.
House Execution: The House slices right through this floor, flipping support into major resistance. This $84,000 – $86,000 area officially becomes the "Kill Zone"—a trap zone designed to neutralize both sides.
Phase 3: Panic Sell Trap at Macro Bottom (49,024 – 53,880 USDT)
Retail Sentiment: The House slams price through $53,880 down to $49,024 (cyan bottom box). Retail panics, cuts losses, and crowds into short positions (marked "Seller") expecting BTC to crash to $30,000.
House Execution: The House absorbs all maximum panic-sell liquidity at rock-bottom prices. Once no retail trader dares to BUY anymore, the House engineers a rapid V-shaped recovery out of the accumulation zone.
Phase 4: New Expansion into the "Kill Zone" (~77,190 -> 84,000 USDT)
Current Market: BTC breaks out of the red accumulation box, completely wiping out late bottom shorters.
The Next Trap: Price is driving straight toward the critical Kill Zone (84,000 – 86,000 USDT). This is where the House decides: collect remaining short liquidity to push toward $101,004, or reverse to trap late breakout buyers.
3. Street Rules for Traders
Never predict price with emotion. Always ask: Whose money is the House trying to take right now?
Don't BUY when price looks too pretty; don't SELL when price looks too scary.
The highest probability entry: Right after the Liquidity Sweep completely wipes out retail stop-losses. SOYUSD 4H: Lower-High Rejection & Trendline Breakdown (Short Set1. Market Context
On the 4H chart, Soybean Oil (SOYUSD) is forming a clear series of lower highs marked by "No Seller" along the major red descending trendline. Price rejected the latest lower-high peak near 7,180.0 and has broken below local 1H trendline support ("A Few Seller 1h") around 6,950.0.
2. Sentiment & House Trap Analysis
• Where Traders Place Orders: Seeing the bounce off the lower blue trendline, retail traders opened BUY orders around 6,950.0, expecting a breakout above the red trendline toward 7,400.0+.
• Trader Stop-Loss & Target: These buyers placed their Stop Loss orders immediately below 6,900.0, while short-sellers placed SLs above the 7,180.0 peak.
• How the House Plays It: The House capped price at 7,180.0 ("No Seller") to establish another lower high. As retail crowds into buy orders at support, the House pushes price down to slice through 6,950.0. Trapped buyers cutting losses trigger forced sell-stop orders, fueling a drop toward 6,750.0 (TP1 - retesting the major blue trendline), 6,520.0 (TP2), and 6,350.0 (TP3).
3. Trade Setup
• Entry: 6,950.0 (Confirmed close breaking below 1H dotted trendline / local support)
• Stop Loss (SL): 7,180.0 (Placed safely above the "No Seller" rejection peak)
• Take Profit 1 (TP1): 6,750.0 (Retesting major blue ascending trendline)
• Take Profit 2 (TP2): 6,520.0
• Take Profit 3 (TP3): 6,350.0
• Risk-to-Reward Ratio (R:R): Approx 2.6:1 (Calculated toward TP3)  Short
Short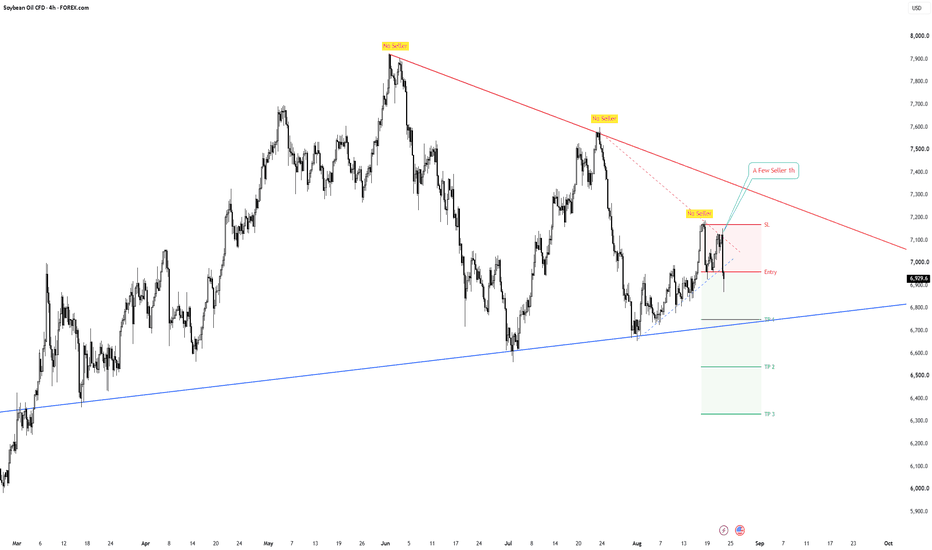
BTCUSDT 4H: Parabolic Spike into Resistance Zone & Macro Short 1. Market Context & Update
BTC executed an explosive parabolic surge straight out of the 67,000.00 consolidation floor, slicing through 72,942.27 and hitting the top of the orange expansion box at 78,112.38. Price is now pressing up toward the macro resistance ceiling at 82,522.24.
2. Sentiment & House Trap Analysis
• Retail Buyers (FOMO Trap): Late retail traders are blindly opening BUY positions above 78,000.00 expecting an immediate moonshot, placing tight Stop Losses below 73,000.00.
• Retail Sellers (Wiped Out): Short-sellers were heavily liquidated during the vertical short-squeeze from 67,000.00 to 78,000.00.
• House Manipulation: The House engineered a rapid vertical pump to force short liquidations and lure late retail buyers into buying at overbought peaks. As price reaches the macro resistance ceiling (82,522.24), the House will cut buying pressure and dump price. This traps all late FOMO buyers, triggering cascading stop-loss sell orders back toward 72,942.27 and ultimately the macro base at 58,424.10.
3. Trade Setup (Short Plan)
• Entry: 78,112.38 – 79,000.00 (Shorting the overextended exhaustion peak)
• Stop Loss (SL): 82,578.71 (Placed safely above the major Resistance ceiling at 82,522.24)
• Take Profit 1 (TP1): 72,942.27 (Retest of key 1H breakout support)
• Take Profit 2 (TP2): 67,000.00 (Previous orange consolidation box top)
• Take Profit 3 (TP3): 58,424.10 (Sweeping macro bottom support floor)
• Risk-to-Reward Ratio (R:R): Approx 4.4:1 (Calculated toward TP3) Short 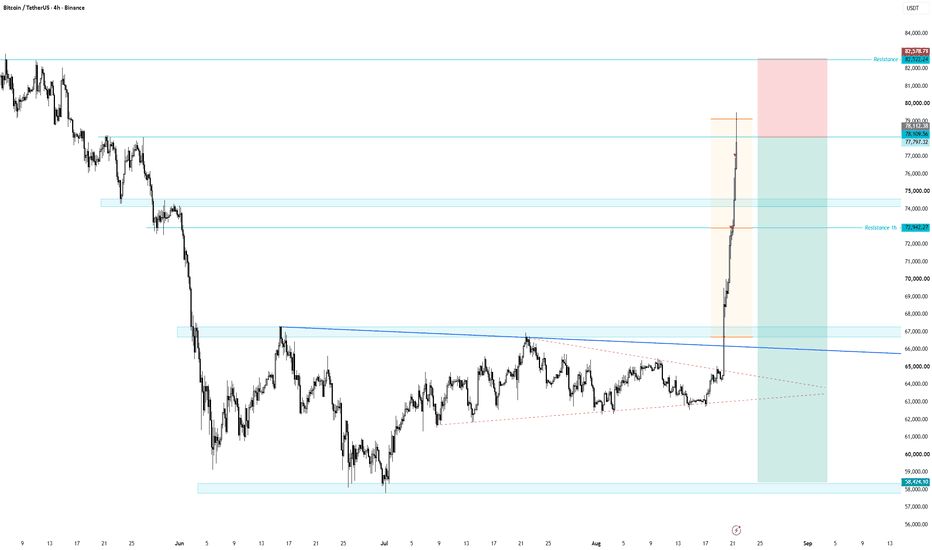
 Short
Short
BTC/USDT (4H Chart) Trade Plan – Big Short Setup to 50,000
1. Price Trap & Liquidity Sweep Analysis
The parabolic impulse move from 64,000 straight into 75,500 is a textbook Buy Climax / Liquidity Grab. It was engineered to trigger short stop-losses and trap FOMO breakout buyers at the swing high.
Price has tapped directly into the major resistance zone (74,000 - 75,500 cyan box) and is showing immediate rejection wicks on the 4H timeframe.
2. Big Short Trade Parameters
Trigger: 4H reversal rejection wick at resistance or a solid 4H candle close below the local support at 72,800.
Entry Zone:
Aggressive: Short around 75,000 - 75,500 upon 4H rejection confirmation.
Conservative: Wait for a 4H close below 72,800 → Sell Retest around 73,200 - 73,500.
Stop Loss (SL): 78,310 (Placed safely above the liquidity sweep wick high).
Take Profit (TP):
TP 1: 67,000 (Previous breakout resistance turned key support).
TP 2: 58,000 - 58,500 (Major base support of the July-August consolidation).
TP 3 (Macro Target): 50,000 (Major psychological round-number demand zone).
3. Risk Management & Execution Rules
Counter-Trend Warning: Shorting against a strong parabolic impulse requires strict position sizing (maximum 1-2% account risk).
Position Management: Once price hits TP 1 (67,000), take 50% partial profits immediately and move SL to Breakeven (Entry) to risk-free hold the Big Short toward 50,000. Short 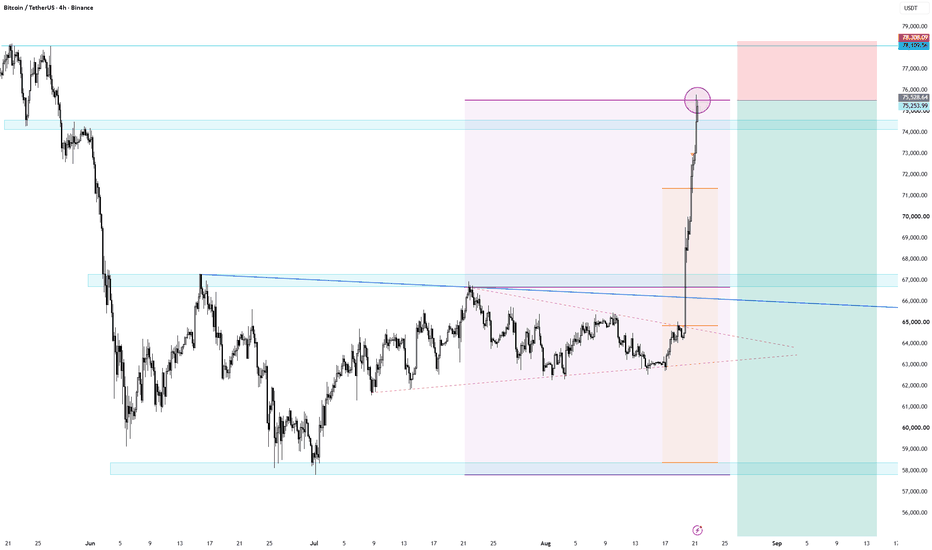
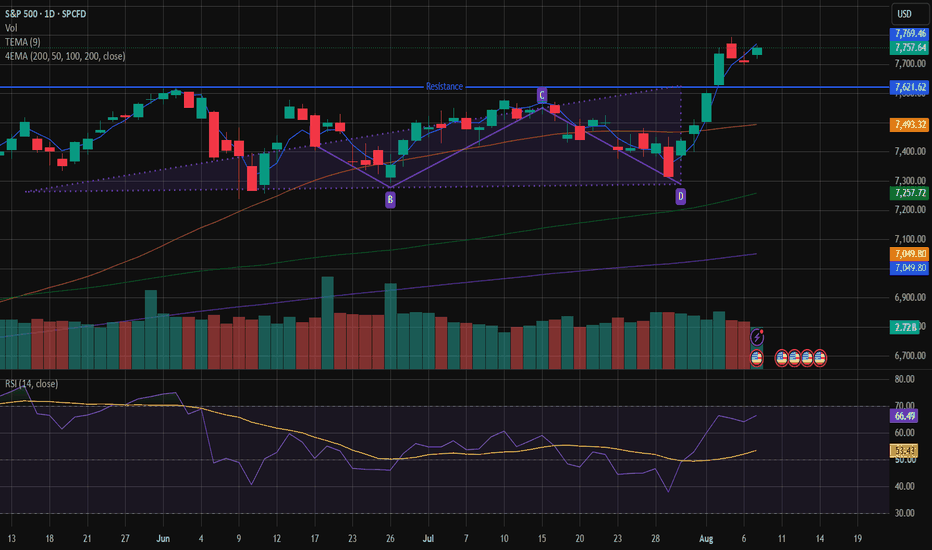
S&P 500: Jobs fell, market rose, triangle held!This video is an update on the S&P 500 trade setup that I put out on 7 August 2026, the day of the release of the July jobs report. The economy lost a shocking -23,000 jobs, the first negative jobs print in this cycle and contrary to expectations of +80,000 jobs, and the S&P 500 went on to close the session near record highs at 7,757. In this video, I discuss precisely how bad news turned good news for the stock market and how the decline in the Fed rate hike probability from 57% to 43.9% led to a 1.3% gain in the Nasdaq and an even stronger run for the semiconductor ETF to +7% on the week. Also discussed is how the ascending triangle breakout at 7,620 held even as the markets saw one of the worst data prints of the year. We discuss the updated trailing stop, the targets that are now achievable, and one statistic from the job report 921,000 temporary layoffs;that you need to watch out for in September.  Long
Long
Long 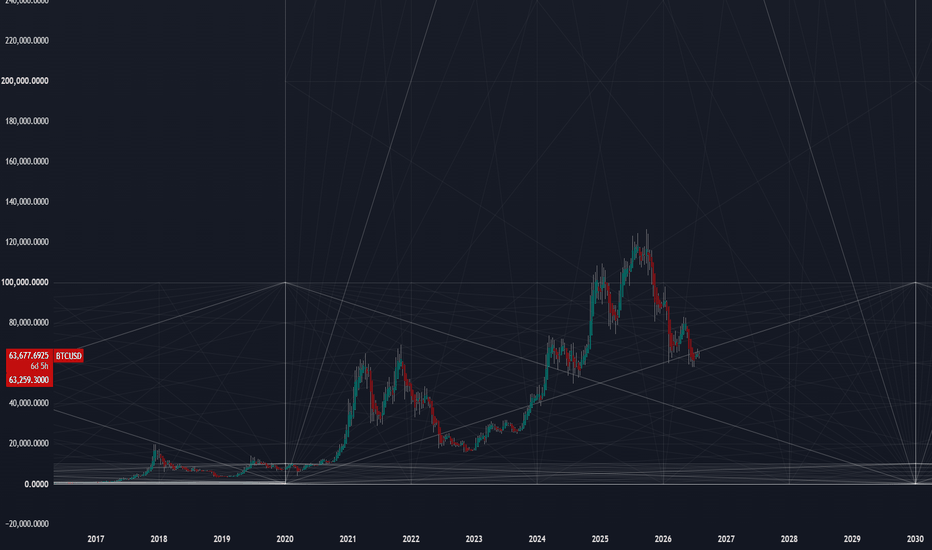
Long