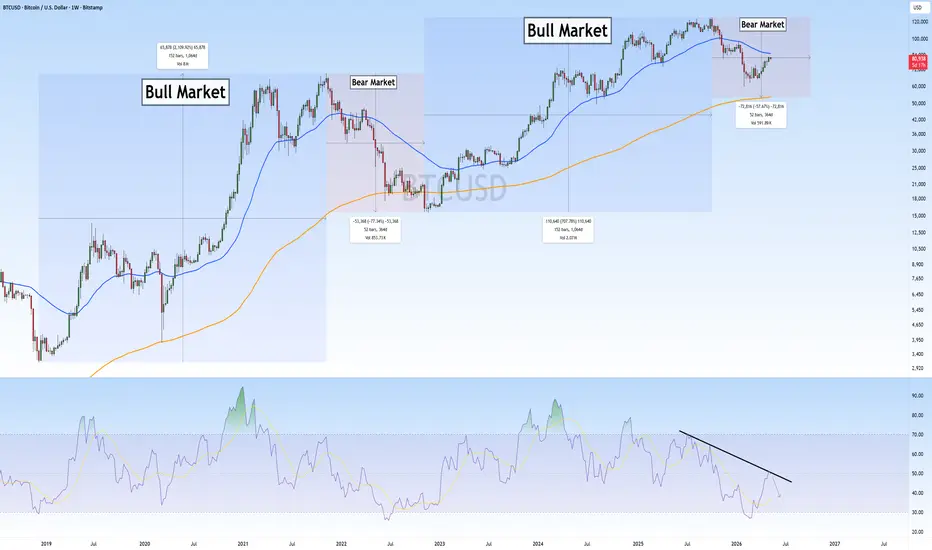
Bitcoin Weekly Update: Bear Market Rally or Real Reversal?#Bitcoin weekly update:
On the weekly timeframe, BTC is trading just below the 50 EMA resistance, a level that has acted as strong resistance during previous bear market phases.
Right now, many traders and your favourite influencer believe the bottom is already in and that BTC is ready for a straight move toward new all-time highs.
But looking at historical cycles, the structure still doesn’t fully support that idea yet.
In past bear markets, BTC has usually spent around a year in the correct
W-pattern
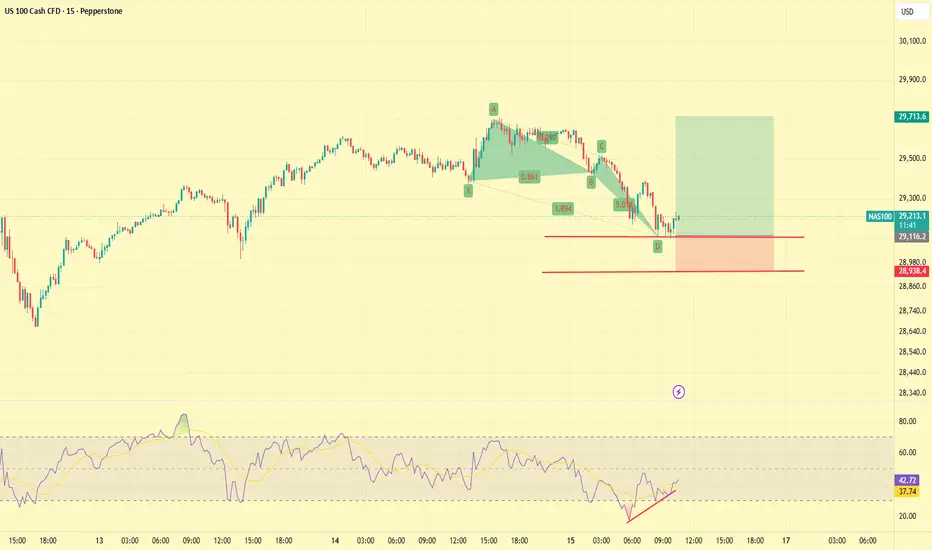
NAS100 LongI’m currently watching a potential long setup on NASDAQ around the 29090 level, with several technical confluences suggesting a possible continuation higher following a retracement.
• Deep Crab Harmonic Pattern on M15
A bullish Deep Crab harmonic pattern has completed on the M15 timeframe, creating a potential reversal zone at current price levels. This setup often signals exhaustion from short-term selling pressure and the possibility of a move back into trend direction.
• Oversold Condition
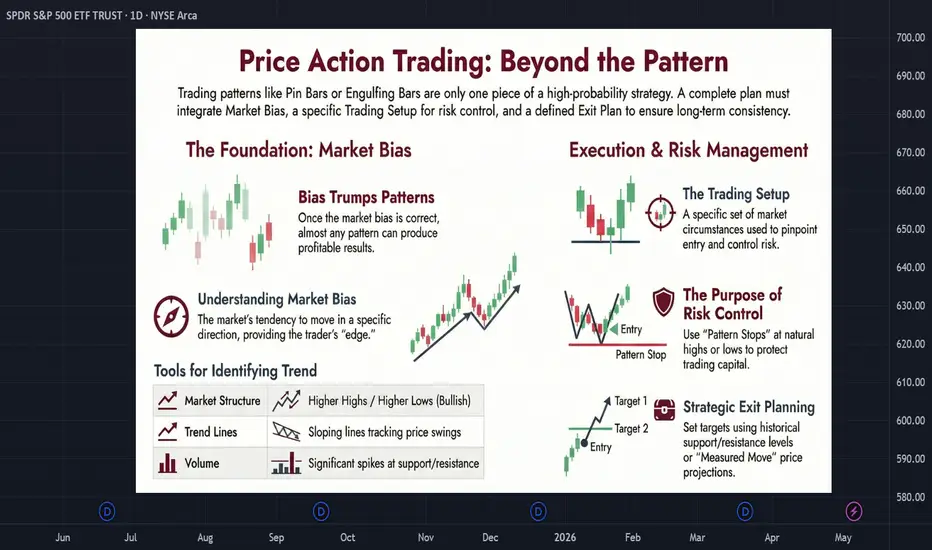
Price Action Trading: Beyond the Pattern🔥 Price Action Trading: Beyond the Pattern 🔥
Many traders focus on individual candlestick patterns as if they contain predictive power on their own.
In isolation, they do not.
A pattern is only meaningful when viewed within the surrounding market structure. Context determines whether a signal is valid.
📌 THE ILLUSION OF PATTERN PRECISION
Candlestick recognition is often seen as the core of price action trading. Pin bars, engulfing candlesticks, and reversal patterns are studied extensivel
Understanding the Counter-Intuitive Nature of MarketsMarkets appear counter-intuitive because widely held intuition becomes part of the market structure itself.
Technical patterns often show near-zero expectancy across full historical samples, yet still produce meaningful edge inside specific regime windows. The implication is simple: pattern success is not a fixed geometric property. It is conditional on the consensus regime surrounding the pattern.
A pattern can cycle through recognition, crowding, exploitation, inversion, inverse conditioning
Quick Lesson: How to Trade Falling Wedge (Study & Benefit)Falling Wedge is one of the most common and recognisable chart pattern. However, many (and may be even most of) people trade it in a wrong way, which often results in taking losses. Knowing when to enter the market can make the difference between catching a clean breakout and getting trapped in a fake move . The chart above compares two similar wedge setups that look alike at first glance, but are built on completely different conditions.
On the left, we see a textbook example of a healt
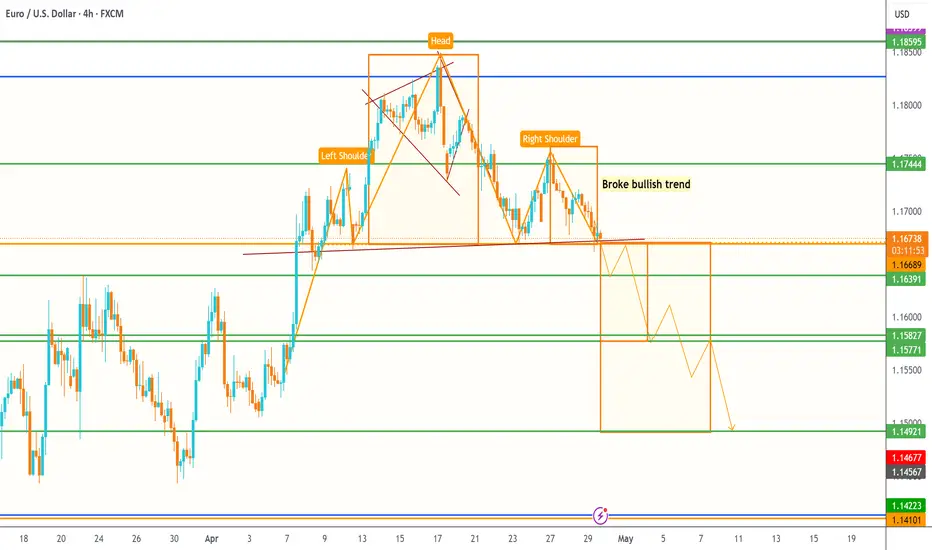
Thoughts on EURUSDGood evening everybody,
After keep tracking EURUSD and figuring out the next moves on the market, I have noticed a head and shoulders pattern that coincides with the retracement of the previous bullish trend. It is expected and ideal that we wait for bounce to get an entry point around 1.16754. An ideal TP 1.158 and if the market continuous bearish it can go until the completion of the pattern at price 1.149.
Follow up previous ideas!
Bitcoin - Is the next move towards 40k?Bitcoin is once again trading within a structured pattern, showing clear reactions to trendlines and key levels. The chart highlights repeating behavior, where price respects rising channels but ultimately fails to sustain higher highs, leading to deeper pullbacks.
Rising Channel
The first rising channel formed after Bitcoin found support around the 80k region. From there, price trended upward in a controlled manner, respecting the channel boundaries before eventually breaking down. That brea
BEAT On. Drop SoonHello Traders!
Previously we caught a beautiful move in Beat and it was successful and now there is another trade but this time its a bearish move. Target is not massive as previous one but it will give us big gains too.
Stoploss 0.6497(-11.2%)
Target 0.4872(+16.5%)
My aim is to achieve highest win rate in tradingview trading community :) and we will definitely do that.
Trade Analysis Based On:
• A1000x Master Reversal Strategy
• A1000x Secret S/R Strategy
• Candlestick Patterns
• A1000x S
Bitcoin - MULTI Month outlook, PATTERN SPOT Hello all 😊
It's been a while since I've done a video update, sometimes they just hit different when trying to get a message across.
I'm observing a bearish chart patter, three drivers - what do you think?
Long term support zone is still at around $53K.
BINANCE:BTCUSD
What Makes a Level ImportantCharts are full of lines. Support levels, resistance levels, trendlines, channels. Many traders end up marking so many areas that every movement on the chart appears to happen near a “level.” When everything is important, nothing actually is.
In reality, only a small number of levels consistently influence price behavior.
A level becomes important when it represents concentrated decision-making in the market. These locations attract orders, attention, and participation. When price reaches them,
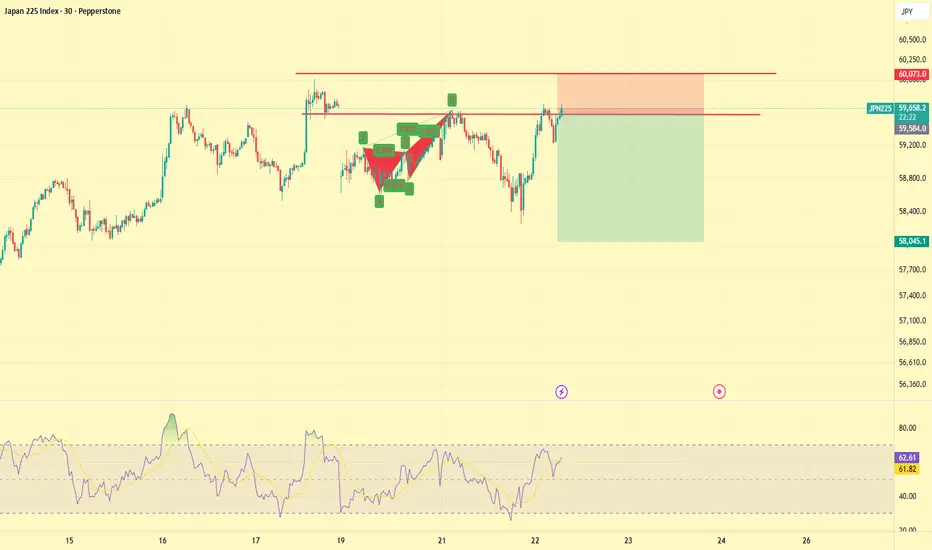
JPN225 Short• Head and Shoulders on H4
A clear head and shoulders structure is forming on the H4 timeframe, which is often a strong sign of exhaustion and a possible reversal after an extended move higher.
• Head and Shoulders Confluence on H1
This same bearish structure is also showing on H1, which adds further confirmation to the idea that the price may be losing strength and preparing for a downside move.
• Overbought Conditions on H1, M30, and M15
Momentum is stretched across the lower timeframes, wit
SPX500 ShortI’m watching a high-confluence short setup on SPX500 around the 6890 level, with multiple technical factors lining up for a potential rejection and continuation lower.
Entry Zone: 6890
Take Profit: 6620
• Bearish Butterfly Harmonic on H4 and M15
A bearish Butterfly pattern is completing on both the H4 and M15 timeframes, creating a strong potential reversal zone right around 6890. When the same harmonic structure appears across multiple timeframes, the setup carries more weight.
• Overbought
Taking Some Rest because of uncertainityHello trader!
Welcome to another trade... LOL no its not a trade post.
First of all i want to say my strategy is built to generate super accurate trade if there is no human error while analyzing. But because of recent war crisis we are facing loss even though there is no analyzing error in chart analysis. If analyzed accurately my method can generate nearly 100% accurate trade and can catch big moves in stable market conditions. My method is based on swing trades so it can catch nice big moves
Scalping Short Setup | Rising Wedge at 4H ResistanceXAUUSD — Rising Wedge at 4H Resistance | Counter-Trend Scalping Setup
Context (HTF + LTF Alignment)
On the higher timeframe (4H), the market remains structurally bullish with a clear sequence of higher highs and higher lows.
Current price is trading in a premium zone after a strong impulsive leg, approaching a key resistance + liquidity cluster.
This means any short setup is strictly counter-trend and must be treated with reduced risk and strict confirmation.
On the 30M timeframe, pric
Chart Patterns ReferenceA comprehensive guide to technical chart formations recognized by professional traders worldwide. Master the art of identifying, measuring, and trading these essential market patterns with precision.
Reversal Patterns:-
Head and Shoulders
Bearish Reversal
A baseline (neckline) with three peaks. The middle peak (head) is the highest, while the outside two (shoulders) are lower and roughly equal height.
Interpretation & Guidance
Signal: Sell when price breaks below the neckline.
Target: Measure
GBPUSD - Keeping it Simple!GBPUSD is trading within a flat rising wedge, maintaining a mild bullish structure.
As price approaches the lower bound of the wedge, we will be looking for long setups, expecting buyers to step in from this support.
However, for the bulls to truly take control, a break above the last minor high is needed.
Until then, this remains a corrective bullish structure, not a full breakout.
⚠️ Disclaimer: This is not financial advice. Always do your own research and manage risk properly.
📚 St
KRAB - A joke that became a good investmentIm pushing the joke and found something that looks like a rly good investment.
Perfect text book example of accumulation after a downward move (down move not shown on the chart) and a reaccumulation at 0.5 at 11
additional evidences are the pick volume on early 2024 and re accumulation at 11 shown by blue arrows
we are targeting 17 for the next wave up, on 2026 and maybe further up to 21 then
cheers not financial advice
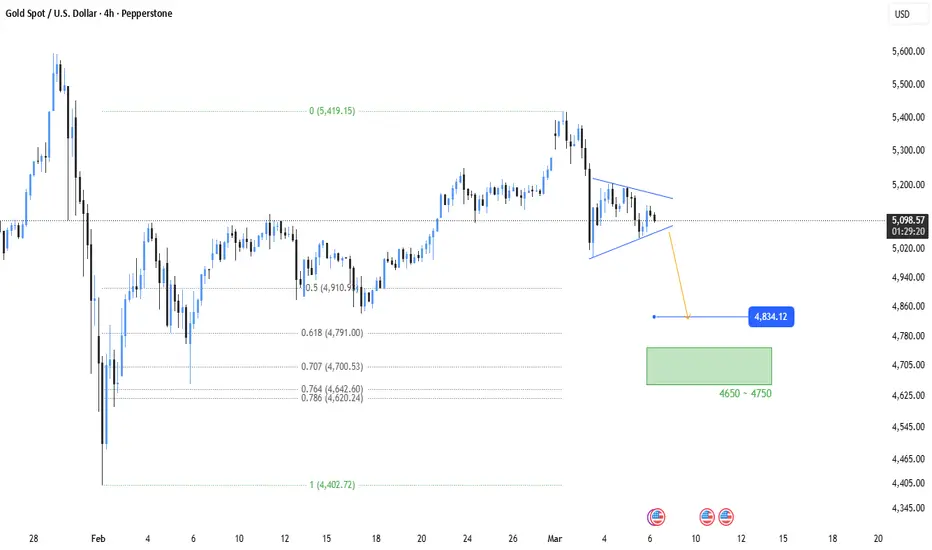
XAUUSD — 4H Triangle Compression Inside a Broader CorrectionXAUUSD — 4H Triangle Compression Inside a Broader Correction
XAUUSD is compressing inside what currently looks like a post-impulse triangle on the 4H chart, not a confirmed trend reversal.
The key structural point is the context of the pattern. This triangle is forming after a sharp bearish displacement from the 5,400 area into the 5,000 zone. That makes the current structure more consistent with a pause after impulse than with a completed bullish reversal. At this stage, the pattern sh
Now its time for Short. Sell ARusdtHello Traders!
Recently we completed 2 big bullish targets in BTC and ADA and the overall market was strong bullish but now its turning bears. Very little bulls remaining before bears take over.
There is a reversal pattern after breakout and market is ready for big short. But again i am saying we don't trade patterns nor i recommend to use patterns. This analysis is based on my self made strategies. I use multiple strategies to crack a perfect trade.
Target 1.67(+13%)
Stoploss 2.043(-6.6%)
M
BTC Bull & Bear Market Analysis (HEALTHY!)BTC is extremely healthy & going through a healthy adoption curve as it marches on in a bear market. The fundamentals & technicals show heavy institutional interest. Expect the bottom to come around September - November. Ultimate DCA zone being $70,000-$40,000 (if lucky). 2027 to 2030 will be the next wave up, with highs set for $250,000. Each cycle the price will become more stable & less volatile the long-term pattern suggests. 2030 is where we meet the next bear market & the cycle repeats unl
CL1! (Crude Oil) Bullish Rejection at VWAP + FVGHey traders, let's dive deep into this setup on Light Crude Oil Futures (CL1!) on the 1-hour timeframe. We've been seeing some intense price action lately, fueled by ongoing geopolitical headlines like the Iran situation, which has kept oil volatile and trending higher overall. If you're eyeing commodities for quick swings, this could be a high-reward opportunity – but as always, manage your risk!
Historical Price Action Recap
Crude Oil has been in a strong uptrend over the past few sessions, fo
Bullish Engulfing Pattern — The Psychology of ReversalBullish Engulfing Pattern
Hello everyone! Today, we're diving into one of the most powerful reversal patterns in technical analysis — the Bullish Engulfing pattern. It's not just a combination of two candles; it reflects the psychological state of the market and the moment when the balance of power shifts from sellers to buyers.
➡️ What Does It Look Like?
This is a two-candlestick pattern:
First Candle — Bearish (Red/Black): Reflects the temporary dominance of sellers, continuing the downwar