ACHR – A Major Bullish Zone Ahead? ACHR has been in a correction phase, with price gradually moving lower from its previous highs.
However, it is now approaching a particularly interesting technical area where two major structures intersect:
1️⃣ The lower bound of the long-term wedge pattern
2️⃣ The green demand zone
This intersection has additional importance because the rising trendline has already acted as support multiple times in the past.
📌 As long as this intersection holds, we will be looking for long setups, anticip
Wedge
$UMAC: The Drone Sector’s New Flight Controller!AMEX:UMAC is currently in a vertical 'markup' phase after a massive 87% return over the last 30 days.
With a recent $2.1M defense order confirmed and a $20 price target from major analysts, the momentum is undeniable.
We are watching for a potential consolidation above $18 before the next leg toward $20+. This isn't just a meme play—it's a domestic supply chain transformation story
🔥 Why it’s "Marking Up" (The Catalysts)
Massive Order Momentum: On January 15, 2026, the company announced a
DXY: Transitioning from Accumulation to Potential MarkupTechnical Analysis & Key Structure
🛑 Markdown Phase Complete:
Dollar has been on a nosedive rally after hitting 110 in January 2025. After exactly one year, it did hit the lowest level since the fall, at 95.5. Afterwards, the downward momentum seems to have been exhausted, ending the lower-low structure and establishing a firm market floor.
🔄 Rounding Base / Accumulation Structure:
Multi-month bottoming formation signals a structural pivot from aggressive selling to net accumulation.
📐 Fall
XAUUSD: Rising Wedge Signals Potential Correction Toward 4,540$Hello everyone, here is my breakdown of the current XAUUSD setup.
Market Analysis
XAUUSD previously traded inside a descending channel before breaking above its upper boundary and shifting bullish. Price then formed a range before breaking higher and developing a rising wedge toward the 4,670 Resistance Zone.
Currently, XAUUSD is trading below the 4,670 Resistance Zone while holding above the 4,540 Support Zone. The recent rejection from resistance and the wedge structure suggest that a shor
With Gold's Rise and Fall, Where Could This "Wedge" Take Us?Here we can see OANDA:XAUUSD has been in a decline since the end of January of this year and price action has formed what looks to be a Falling Wedge. August 19th began the Breakout of this pattern but price is currently in downfall again, lets break it down!
It's no surprise that the heavy, opposing influence Gold and the USD have against each other but with the national debt concerns, US Treasury interventions and what seems to be global de-dollarization trends, this has led to OANDA:XAUUS
PLTR - Wedge Breakout Confirmed — Can Momentum Continue?PLTR has confirmed a breakout from a wedge-shaped volatility contraction pattern following a strong prior impulse move. The most recent daily close finished above the breakout level, providing initial confirmation that buyers are attempting to regain control after several months of consolidation.
One aspect I find interesting is that the breakout is occurring while fundamentals remain exceptionally strong. Recent quarters have shown accelerating EPS growth, accelerating revenue growth, and expa
PLTR: Massive Volume Breakout — Retest or Straight to ATH?After a prolonged correction, PLTR has now produced a large weekly breakout candle accompanied by a significant volume expansion. That makes this breakout considerably more meaningful than a low-volume move.
🔥 What changed?
The larger structure shows:
• 📈 Strong prior bullish impulse
• 🔄 ~70% retracement of that previous swing
• 🟢 Long consolidation inside a falling wedge
• 🚀 Explosive Falling-wedge breakout
• 💥 Massive weekly volume expansion
• 🎯 ATH at ~$209 now back in focus
The ~70% retr
SOL: The Bears Had Their Turn… Is the Trend Finally Changing?SOL has been telling quite a story.
First came the Rising Wedge 📉
Then a Broadening Formation and another bearish resolution.
But something changed this time.
Instead of continuing to make lower lows, SOL started building higher lows — compressing beneath the same ~$84 resistance.
An Ascending Triangle formed.
And now… the ceiling has finally broken. 🚀
Volume has expanded sharply alongside the breakout, adding weight to the move.
But there is one major test ahead:
🟣 200 EMA — ~90
A brea
LPTH: Broadening Wedge Breakout Attempt — Retest or Direct Fly?LightPath Technologies ( NASDAQ:LPTH ) is making another aggressive push to break out of a Broadening Wedge / Falling Megaphone pattern. Following a strong rebound off the $12.5 support, buyers printed a decisive Bullish Engulfing Candle on heavy volume, signaling that institutional accumulation is stepping back in.
The structural question now: Will LPTH offer a clean dip into the retest zone, or continue its vertical rally?
📊 Technical Confluences & Key Levels
📐 Broadening Wedge Breakout: Pri
1H: BTC AnalysisMarket structure: Price has shifted bearish after rejecting the 80.5K–81.25K resistance area and breaking down from the recent rising structure. We are now seeing lower highs and lower lows.
Price action: Strong bearish displacement pushed price down toward the 1H bullish order block around 76.8K–77.5K. Price is currently testing this support area.
Momentum: Bearish momentum has increased significantly. The sharp selloff shows sellers have taken short-term control.
EMA bands: Bands have flippe
XAUUSD Long: Ascending Channel Points Toward 4,700$Hello traders! Here’s my technical outlook based on the current XAUUSD (3H) chart structure. XAUUSD previously traded inside a consolidation structure before breaking above the Supply Line and shifting bullish. Price then formed an ascending channel and moved toward the 4,700 Supply Zone.
Currently, XAUUSD is trading below the 4,700 Supply Zone while holding above the 4,600 Demand Zone and ascending channel support. The recent rejection suggests a possible short-term pullback before another att
BTCUSDT Breakout & Retest — $82,000 Becomes Next TargetHello traders! Here’s my technical outlook based on the current BTCUSDT (2H) chart structure. BTCUSDT previously traded inside a broad range before breaking above the resistance line and shifting bullish. Price then rallied strongly and formed an ascending channel toward the 82,000 Seller Zone. Currently, BTCUSDT is trading above the 78,700 Buyer Zone while respecting the ascending support line. The recent breakout and retest suggest that buyers remain active, with price potentially moving highe
AUDCHF: Bullish Trend Continuation 🇦🇺🇨🇭
AUDCHF broke a resistance line of a bullish flag pattern on an hourly time frame.
Taking into consideration that the pair is trading in a long-term bullish trend,
this violation indicates a highly probable trend continuation.
Expect a price rise to 0.58 level.
❤️Please, support my work with like, thank you!❤️
I am part of Trade Nation's Influencer program and receive a monthly fee for using their TradingView charts in my analysis.
HLIT: Wedge Retest Setting Up the Next Breakout?HLIT appears to be developing an interesting continuation structure after breaking out from a large multi-year falling wedge. The breakout was accompanied by a significant surge in volume, signaling strong institutional participation and confirming that buyers stepped in aggressively as price pushed through long-term resistance.
Following that breakout, the stock has entered a healthy consolidation phase, carving out a smaller wedge pattern. Rather than being a sign of weakness, this can be vie
GOLD (XAUUSD): Pullback From Support
There is a high chance that Gold will pull back from a key daily horizontal support cluster.
I see a bullish breakout of a resistance line of a falling wedge pattern on an hourly chart
as a confirmation.
Goal - 4614
❤️Please, support my work with like, thank you!❤️
I am part of Trade Nation's Influencer program and receive a monthly fee for using their TradingView charts in my analysis.
WLDN | Decision Zone: Retest or Go?After spending years consolidating inside a rising accumulation structure, WLDN finally delivered the breakout. Now the stock has entered the phase that often determines whether the next leg higher begins immediately or after one final shakeout.
📈 Technical Story
✅ Breakout of Multi-year accumulation
The lengthy consolidation has already resolved to the upside, confirming a major structural breakout.
📉 Falling wedge after the breakout
Instead of a sharp reversal, price is now compressing ins
BabyDoge Secondary Trend. Wedge. Channel. August 27, 2026Logarithm. 3-day timeframe. Memcoin, mimicry of DOGE. High-risk asset (risk management) and, accordingly, the downside—high potential profit.
Classic trading on a breakout of the descending wedge pattern, possibly in a horizontal channel. If there is a pump, it will be, as always with such assets of such liquidity, a relatively large percentage and sharp—a "pump with a stick."
The entire trend, for understanding this wedge breakout zone (if one occurs) during the next local altseason.
Five catalysts that could move Ethereum nextETH keeps refusing to give up the $2,500 level. Every dip is being absorbed, but buyers are still running into a wall at $2,550–2,560. The market is compressing—and Friday’s Jackson Hole speech could provide the spark.
🚀 1. Institutional demand remains strong
U.S. spot Ethereum ETFs attracted approximately $988M across seven trading sessions from August 17 through August 25. Of that, $692.6M arrived during August 17–21, with BlackRock’s ETHA accounting for roughly $537M.
🐋 2. Corporate treasur
MESU Aug 27: 7707 Pullback Before a 7741 Breakout?MESU pushed higher overnight and is currently trading around 7,715.
The first downside liquidity level I’m watching is around 7,707. Price may pull back into that area before attempting another move higher.
For the broader bullish structure, 7,690 is the key support level. A confirmed 4-hour close below 7,690 would weaken the bullish scenario and could open the door toward 7,655.
On the upside, the overnight high around 7,741 remains the main liquidity target. A confirmed 4-hour close above t
Short idea on BNBI've plotted resistance levels calculated using my own method on the chart. The color and number of each level indicate its strength. Blue is a weak level, orange is an average level, and red is a strong level. Strength (numbers) also influences the level. Strength from 20 to 50 is an average level, from 50 to 100 is strong, and from 100 and above is very strong.
I expect the price to break out of the Falling Wedge and stop around 612$-626$, and from there, a correction to 590$ will begin. I pla
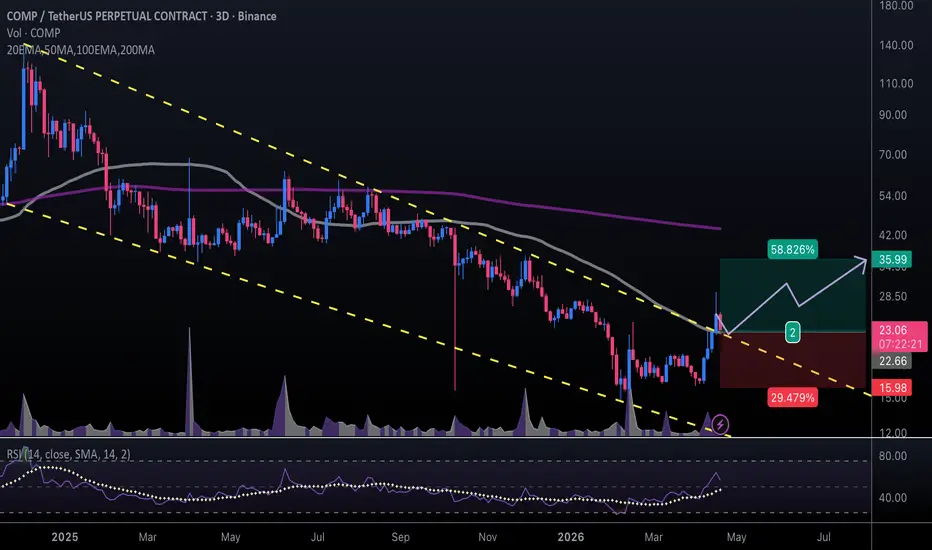
#COMPUSDT #3D (Binance) Falling wedge breakout and retest [LONG]Compound regained 50MA support and is pulling back to it, seems likely to resume bullish towards 200MA resistance next.
⚡️⚡️ #COMP/USDT ⚡️⚡️
Exchanges: Binance Futures
Signal Type: Regular (Long)
Leverage: Isolated (2.0X)
Amount: 5.1%
Entry Targets:
1) 22.66
Take-Profit Targets:
1) 35.99
Stop Targets:
1) 15.98
Published By: @Zblaba
CRYPTOCAP:COMP BINANCE:COMPUSDT.P #3D #Compound #DeFi compound.finance
Risk/Reward= 1:2.0
Expected Profit= +117.7%
Possible Loss= -59.0%
Estimated Duration