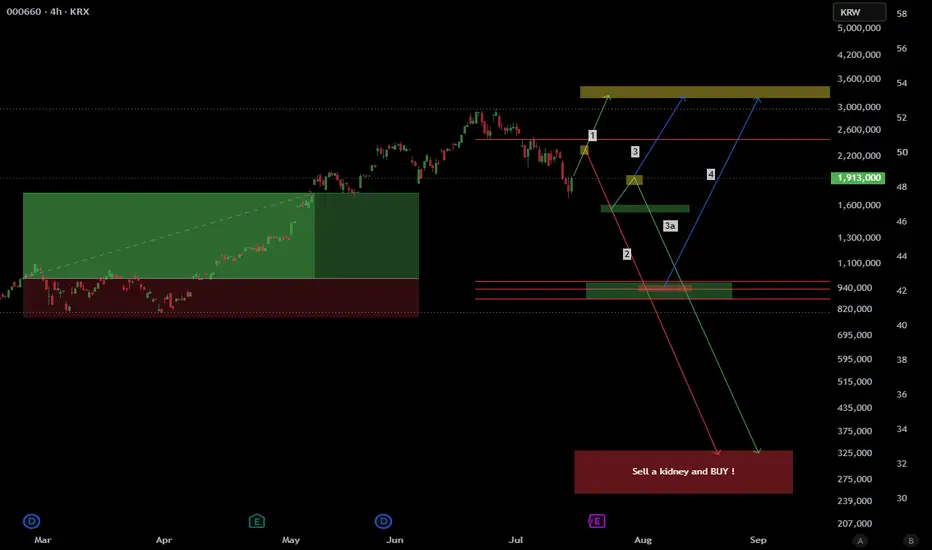
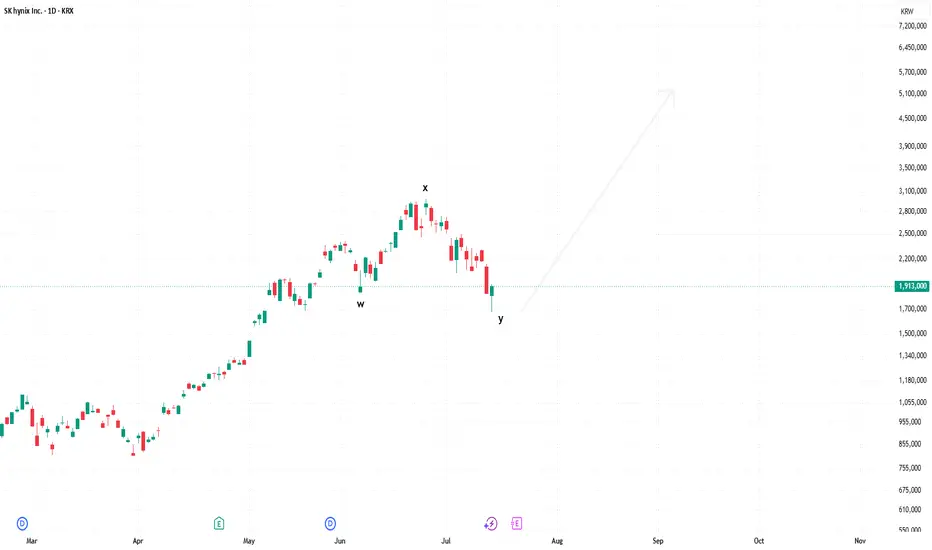
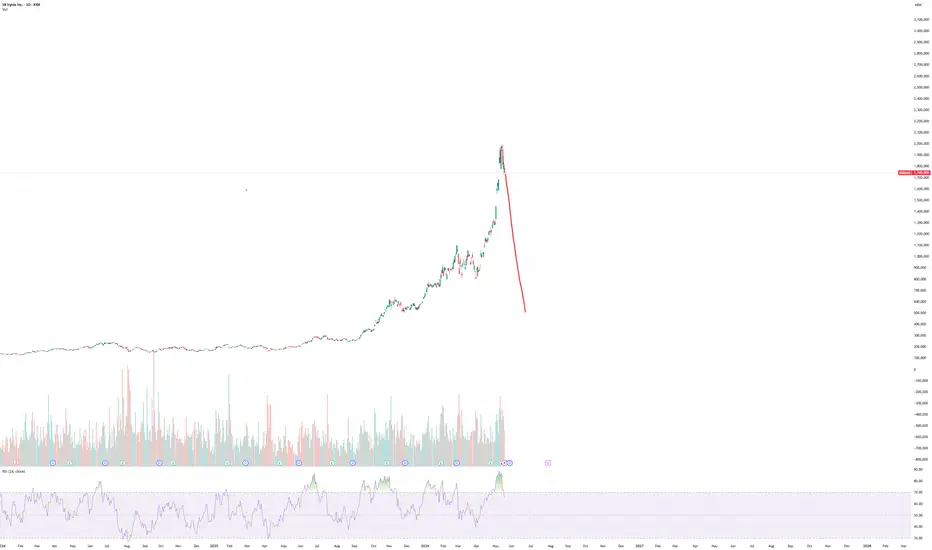
$000660 SK Hynix , IdeaThe rally that carried this chart for months finally cracked. Structure broke to the downside, price is trading below the level that used to hold everything up, and the map ahead has rarely been this clearly drawn.
Above, two things matter: a fresh supply zone left behind by the breakdown, and higher still, the weak high, untouched and holding the liquidity every uptrend eventually wants back. Below, a stacked demand cluster where the last major accumulation lives. And far beneath that, a zone we labeled honestly, because if price ever visits it, subtlety will not be required.
The paths:
Path 1: Buyers waste no time. The broken level gets reclaimed, supply above fails, and price runs directly at the weak high. The V-shaped answer, and the one that would embarrass the most people.
Path 2: No reclaim, no bounce, no mercy. Sellers press straight through every shelf on the chart and price freefalls toward the deep discount zone. The full unwind.
Path 3: The middle road. A relief bounce into the supply left by the breakdown, rejection at the scene of the crime, then a controlled descent into the demand cluster, where buyers get their audition. If they pass, the weak high is the prize.
Path 3a: Same rejection, worse outcome. Demand gets tested and fails, and the chart resolves into the zone at the bottom. The kidney scenario.
Path 4: Demand holds on the first touch, the base takes longer to build, but the destination is the same, the liquidity above the weak high gets collected on a delay.
Five roads, two destinations. The reaction at supply tells you which half of the chart is in play, and the reaction at demand tells you everything else.
EQC follows the reaction.
Hidden in plain sight. EQC.
Like, Follow, Boost, Join, Thank You!
Financial Disclaimer: This post is not financial advice. I am not your financial advisor, your crypto influencer, or your emergency hotline when volatility discovers your stop loss. Always do your own research and never trade solely because colorful arrows suggest a brighter future.  Long
Long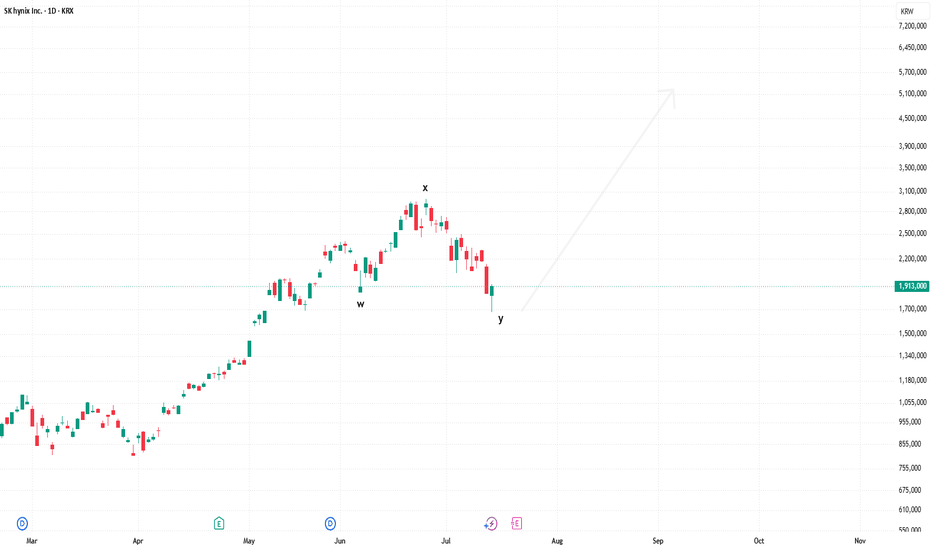
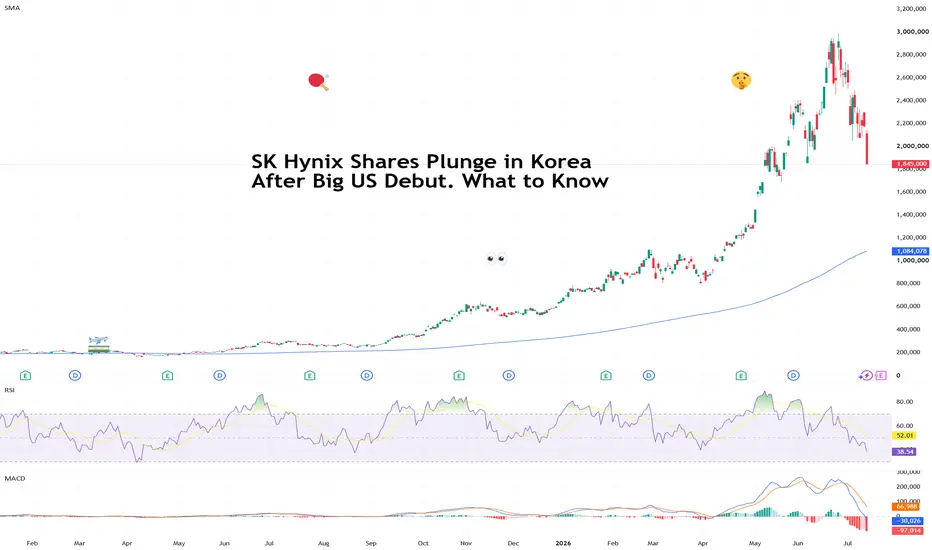
SK Hynix Shares Plunge in Korea After Big US Debut. What to KnowA Wall Street celebration turns into a Seoul hangover
Sometimes the same party looks very different depending on which side of the Pacific you're standing.
SK Hynix's KRX:000660 long-awaited US market debut was met with cheers on Friday, with its American shares climbing 13% after the company's blockbuster $26.5 billion offering.
By Monday morning in Seoul, however, the mood had flipped. Shares of the South Korean memory-chip giant tumbled more than 15% , the worst single-day showing in its history, dragging the benchmark Kospi KRX:KOSPI down more than 9% and even triggering a brief circuit-breaker halt — a temporary pause in trading designed to calm markets during unusually sharp moves.
The reversal puzzled traders. How could a successful US debut be followed by such a painful selloff at home? As it turns out, the answer has less to do with panic and more to do with market mechanics.
💰 Profit Taking Isn't Always Bad News
One of the biggest explanations is profit raking taking — a Wall Street term that simply means investors decide to cash in after a strong run.
And what a run it's been.
SK Hynix shares KRX:000660 have surged more than 25-fold since late 2022 as artificial intelligence transformed memory chips from a relatively sleepy business into one of the hottest corners of the semiconductor industry.
Just ask Micron NASDAQ:MU and Sandisk NASDAQ:SNDK , especially Sandisk .
Against this backdrop, Hynix has become one of Nvidia's NASDAQ:NVDA most important suppliers of high-bandwidth memory (HBM), the ultra-fast chips that help AI systems process enormous amounts of data.
After years of gains, a successful US listing gave many Korean investors a convenient moment to lock in profits. Others shifted their holdings into the newly listed American depositary receipts, creating additional selling pressure on the Seoul-listed shares.
📜 Wait... Was This an IPO?
Not really.
While many headlines compared the debut to an IPO, Hynix didn't go public in the United States because it was already a publicly traded company in South Korea.
Instead, it launched American Depositary Receipts (ADRs) under the ticker $NASDAQ:SKHYV (but that will change to NASDAQ:SKHY on Tuesday).
Think of an ADR as a wrapper that allows US investors to buy shares of a foreign company on an American exchange without purchasing the original stock overseas. A bank holds the underlying Korean shares and issues tradable receipts in the US.
An IPO, by contrast, is when a company sells shares to the public for the very first time. SK Hynix has been public for years — it simply opened another door for investors. Here’s a nice IPO calendar for reference.
🤖 AI's Favorite Memory Maker
The offering was closely watched because it tested two things at once: global appetite for overseas listings and investors' confidence that the AI boom still has legs.
Demand certainly showed up. The deal was reportedly more than seven times oversubscribed, even as some investors questioned whether AI-related valuations have climbed a little too far, too fast.
Hynix sits at the center of that story. Alongside larger rival Samsung Electronics KRX:005930 (down more than 10% on the day), it manufactures memory chips used in everything from smartphones to data centers.
As AI models grow better, faster, stronger, demand for faster memory has exploded, helping drive record profits across the industry.
⚖️ The Bigger Question
For all the excitement, investors are beginning to ask a familiar question: what happens when everyone builds more factories?
Hynix chief executive Kwak Noh-Jung believes memory shortages could persist well beyond 2030, suggesting demand will remain robust for years.
Still, expanding production has historically been a double-edged sword. Memory chips have long been a cyclical business, where periods of shortages eventually give way to oversupply, squeezing prices and profits.
That uncertainty has made Hynix one of Korea's most volatile stocks. Leveraged ETFs tracking the company have amplified market swings, contributing to an unusually high number of trading halts on the Kospi this year — seven times already, out of 13 since 2000.
With Hynix shares already down more than 30% from their June peak, the market seems to be in limbo on the proper price tag.
Off to you : What do you think of the AI craze? Overvalued or nah?
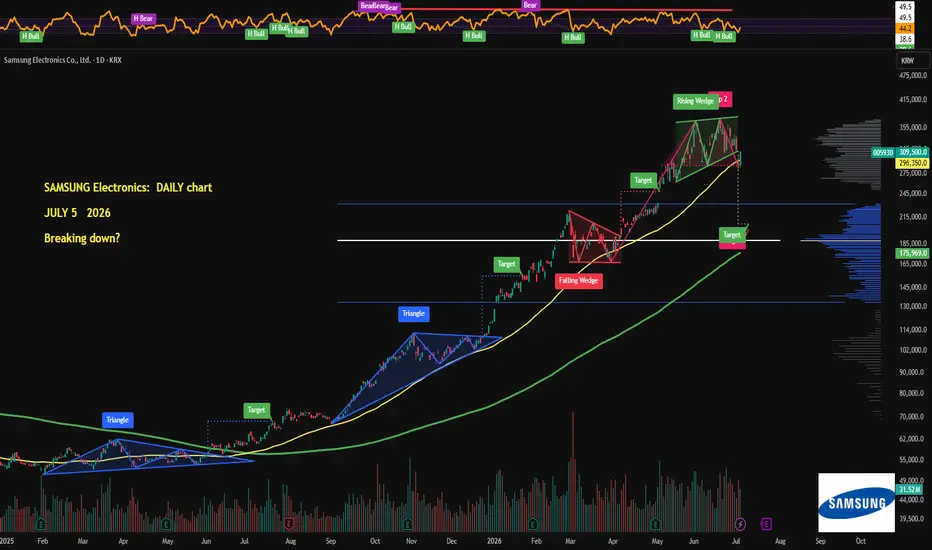
SAMSUNG -10% this WEEK, correction uinderway!Samsung is down more than 10% this week, while NASDAQ:SMH (VanEck Semiconductor ETF) is down 6%.
So those two nearly identical Rising Wedge breakdowns - one in Korea, one in the US, both in the semiconductor sector - probably weren't a coincidence. Looks more like the correction is underway.
The measured targets of both wedges are much lower, more than 23% below current prices. A relief bounce is likely soon, but I still don't see any strong reversal signals. For now, I'm treating both daily charts as probable early-stage downtrends.
On both assets, the lower timeframes have already shifted into downtrends without any bullish divergences, leaving plenty of room for further downside. At the moment, buying semiconductor stocks looks more like trying to catch falling knives.
But everyone has their own strategy. I'll wait for proper trend reversal signals first.
💙👽 SK Hynix Just Shocked Wall Street With a $28 Billion MoveSK Hynix is preparing for what could become the largest American Depositary Receipt (ADR) listing in history, targeting a raise of more than $28 billion on the Nasdaq
The offering would surpass Alibaba's roughly $22 billion U.S debut in 2014, with trading expected to begin around July 10 under the ticker SKHY. At first glance, it looks like a company raising capital to stay competitive.. In reality, SK Hynix is already operating from a position of exceptional strength. The company holds roughly $24 billion in net cash, has AI memory production sold out through 2028, and continues to post record earnings as demand for artificial intelligence infrastructure explodes
🧠 How SK Hynix Makes Money
SK Hynix is the world's second largest memory chip manufacturer and the global leader in High Bandwidth Memory (HBM), controlling an estimated 57% of the HBM market. The company generates most of its revenue from DRAM chips used in servers, AI accelerators, smartphones, and PCs, while NAND flash products contribute additional revenue from SSDs and storage devices
Its biggest growth engine today is HBM, the advanced memory stacked alongside AI GPUs from companies like Nvidia. As hyperscalers and AI developers race to build larger data centers, demand for HBM has far outpaced supply, allowing SK Hynix to lock in long term contracts, command premium pricing, and achieve record operating margins
📊 Q1 FY26 in Numbers
The financial results highlight why investors are paying close attention, ready ?
-Revenue reached another record high as AI related memory shipments continued to surge
-Operating profit expanded sharply thanks to higher HBM shipments and stronger DRAM pricing.
-The company maintained approximately $24 billion in net cash, giving it one of the strongest balance sheets in the semiconductor industry
-HBM production remains effectively sold out through 2028, providing unusual earnings visibility for a traditionally cyclical business
-Management continues investing aggressively while generating significant free cash flow, a rare combination during a semiconductor expansion cycle
🇺🇸 The US Listing
Unlike shares traded in Seoul, which are denominated in Korean won and less accessible to many U.S institutions, the Nasdaq ADR gives global investors an easier way to own the company
SK Hynix plans to issue approximately 178 million ADRs, representing about 2.5% of the company. Each Korean share converts into ten ADRs, implying a reference price of roughly $158 per ADR, with final pricing expected around July 10. The shares will trade on the Nasdaq Global Select Market under the ticker SKHY
Every dollar raised will fund long term capacity expansion rather than plugging balance sheet holes. Capital will be invested in
🏭 The Yongin Y1 mega fab for next gen DRAM and HBM production
📦 The Cheongju P&T7 advanced HBM packaging facility
🔬 Additional ASML EUV lithography systems needed for advanced memory manufacturing.
🇺🇸 A $4 billion advanced packaging facility in Indiana, expanding SK Hynix's U.S manufacturing footprint
Interestingly, the company originally explored raising around $10 billion before increasing the target to more than $28 billion, suggesting management's long term demand expectations have become substantially more optimistic
🇰🇷 What You're Paying
After a remarkable rally driven by AI enthusiasm, SK Hynix now trades near 7x forward earnings, roughly in line with Micron despite holding the industry's leading HBM position
The company recently surpassed Samsung Electronics to become South Korea's most valuable listed company, reflecting investors' belief that HBM will remain one of the most supply constrained segments of the semiconductor market
Unlike many AI related companies trading at premium multiples despite limited profitability, SK Hynix combines strong earnings growth, expanding margins, robust cash generation and a fortress balance sheet.. However, much of the AI optimism is already reflected in today's valuation, meaning future upside increasingly depends on execution rather than simple multiple expansion
⚔️ Competition & Risks
Despite its leadership position, SK Hynix still faces several important challenges
-Samsung Electronics is investing aggressively to regain HBM market share
-Micron** continues expanding production and has already secured key AI customers
-Memory remains a cyclical industry, and any slowdown in AI infrastructure spending could pressure pricing and margins
- Geopolitical tensions involving the US, China, Taiwan, and South Korea could disrupt semiconductor supply chains
-Massive capital spending always carries execution risk, particularly as fabs become increasingly expensive and technologically complex
While current demand appears exceptionally strong, semiconductor cycles have historically shifted quickly once supply catches up
🔭 What to Watch
Several developments will determine whether SK Hynix can justify its record breaking capital raise
-Final pricing and investor demand for the Nasdaq ADR
-Construction progress at the Yongin semiconductor cluster
-Ramp-up of the Indiana advanced packaging facility
-Future HBM supply agreements with Nvidia and other AI chip designers
-Whether AI infrastructure spending remains strong enough to keep HBM capacity fully booked beyond 2028
-Quarterly gross margins and free cash flow as new production comes online
SK Hynix's historic Nasdaq listing is less about raising emergency capital and more about cementing its position at the center of the AI revolution. Few companies attempt a record-breaking equity offering while sitting on billions in net cash and operating with years of sold-out production capacity. That confidence says as much about management's expectations for AI demand as it does about the business itself
The biggest question now isn't whether SK Hynix can build more factories..It's whether the AI boom will remain powerful enough to absorb all of that new capacity over the next decade
If today's demand proves sustainable, this record setting ADR could be remembered as the moment SK Hynix transformed from a Korean memory manufacturer into one of the semiconductor industry's most globally owned AI infrastructure companies.
Samsung Electronics vs $SMH: RISING WEDGES' breakdowns!
Samsung accounts for roughly 9% of AMEX:EEM , one of my main long-term portfolio positions, so I follow it closely. Unfortunately, the chart isn't looking great right now. After a roughly 600% rally over the past year and a series of record quarterly results, the daily chart looks quite close to confirming a larger correction.
On the weekly chart, every new high over the past few months has come with a bearish RSI divergence. The daily chart tells a similar story and is starting to resemble a distribution phase. There's a breakdown from a Rising Wedge, a failed attempt to reclaim the pattern, price has slipped below the yellow 50 SMA, and we've now printed the first lower low - at least if we count the wicks.
The key question now is whether price can make a higher high. If not, there's a good chance we're seeing a dead cat bounce before another leg lower. The green 200 MA is still bullish but sits much lower around 176K, while the measured breakdown target from the wedge comes in near 207K.
Samsung reports earnings in a few weeks. The last several quarters have all delivered record results and earnings beats, yet the chart is telling a different story. We'll see how the earnings and, more importantly, the guidance look. Will expectations be raised once again?
The same pattern is visible in NASDAQ:SMH (VanEck Semiconductor ETF). It has also broken down from a very similar Rising Wedge, accompanied by bearish RSI divergences. The main support is now the yellow 50 MA around $579.5.
In SMH's case, the distribution thesis is reinforced by the Elliott Wave structure and heavy selling volume.
So the chart of the Korean semiconductor giant looks remarkably similar to the chart of the leading U.S. semiconductor ETF. Add a strengthening TVC:DXY on top of that, and it's hard not to argue that the entire semiconductor sector may be entering a global distribution phase.
If we're indeed moving into a correction, it will probably last as long as the U.S. dollar remains strong. Naturally, Samsung is likely to feel that pressure even more than most U.S. semiconductor companies.
For now, it looks like better buying opportunities may appear over the coming months, in my opinion.
💙👽 Short 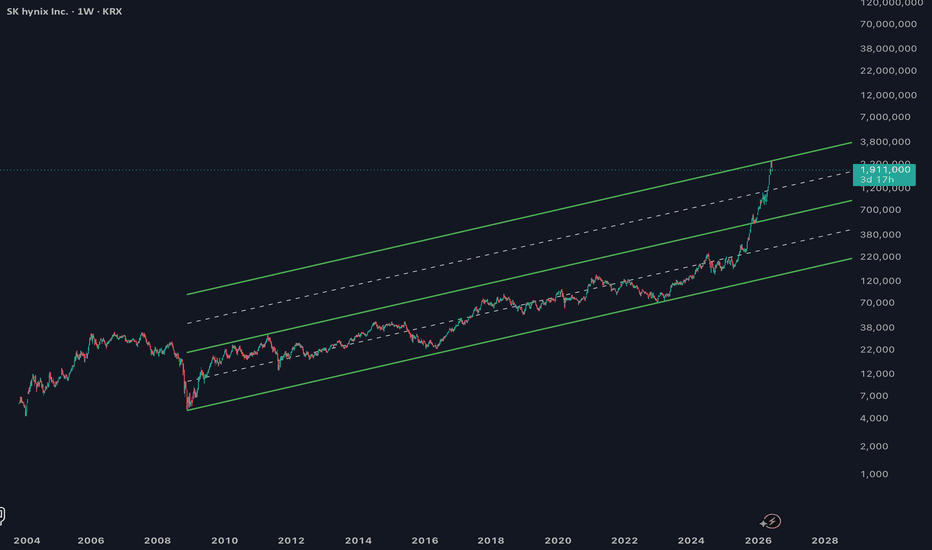
$Samsung 36 Analysts Say Buy. HBM Revenue to Triple!Samsung Electronics just posted the strongest quarter in its entire corporate history. 🏆 Operating profit surged 756% year over year to ₩57.2 trillion ($39 billion). 🤯
Revenue hit a record ₩133.9 trillion ($91 billion), up 69% year over year. The AI memory supercycle is real and Samsung is sitting right at the centre of it. 🔥
The weekly chart has pulled back into two clean demand zones. This is the entry. 📊
The chip division is doing all the heavy lifting. 💪 Device Solutions accounted for 94% of total operating profit in Q1 2026, with chip margins above 70%. 🚀
Samsung became the first company in the world to commence mass production and shipment of HBM4 in February 2026, supplying Nvidia's Vera Rubin AI platform ahead of every competitor. 🤖
HBM revenue is expected to more than triple in 2026 compared to 2025, with HBM4 sales expected to exceed 50% of total HBM revenue from Q3 onward. ⚡ HBM4E samples are being delivered to customers in Q2 2026, featuring bandwidth of up to 4.0 TB per second and pin speeds of 16 gigabits per second. 🔬
The supply demand picture is extraordinary. 🌍 Samsung's EVP of the memory business confirmed on the earnings call that the demand fulfilment rate is now at a record low. 📉
Customers concerned about supply shortages are already bringing forward their demand for 2027. South Korea's semiconductor exports surged 173.5% year over year to $31.9 billion in April 2026, marking a 13th consecutive monthly record. 💵
Samsung has signed multi year binding contracts with customers locking in supply and pricing as hyperscalers accelerate AI infrastructure builds. 🔒
The supply demand gap is expected to widen further in 2027. ⚠️
The foundry business is equally strong. 🏭
Samsung's foundries are running at full utilisation on advanced nodes in Q2 2026. 2nm customer adoption is expanding and 1.4nm development is on schedule. 📈
Q2 2026 revenue is expected to reach approximately ₩163.5 trillion, continuing the record run. Next earnings are due 29 July 2026. 📅
36 analysts have Buy ratings on the stock. 🐂
The consensus average price target is ₩403,209 KRW (~$290 USD). The high analyst target sits at ₩850,000 KRW (~$612 USD). The 52 week range spans from ₩56,900 KRW to ₩370,000 KRW. ✅
The weekly chart has pulled back from the 52 week high into two clean demand zones with Fibonacci confluence. 📊 Two entries. Two defined risk levels. One directional thesis. 🎯
🟢 Zone 1 (Upper Entry) ~ ₩303,500 (~$218) area (0.786 Fibonacci Weekly)
💰 Entry: ₩303,500 (~$218)
🛑 Stop: ₩290,000 (~$209) (4.448% below entry)
🎯 Target: ₩455,000 (~$328) (49.9% upside from entry)
📈 Risk/Reward Ratio: 11.22
🟢 Zone 2 (Lower Entry) ~ ₩217,900 (~$157) area (0.5 Fibonacci Weekly)
💰 Entry: ₩217,900 (~$157)
🛑 Stop: ₩203,500 (~$147) (6.221% below entry)
🎯 Target: ₩565,000 (~$407) (160.1% upside from entry)
📈 Risk/Reward Ratio: 25.74
📅 Next Earnings: 29 July 2026
🌍 52 Week Range: ₩56,900 to ₩370,000
💵 Consensus Target: ₩403,209 (~$290)
🏆 Q1 2026 Revenue: ₩133.9 trillion ($91 billion)
Record profits. 🏆 HBM4 first to market. 🤖 Supply sold out into 2027. 🔒 Two weekly zones. Let price come to the level and let the trade do the work. 🚀
⚠️ Not financial advice. Manage your risk.  Long
Long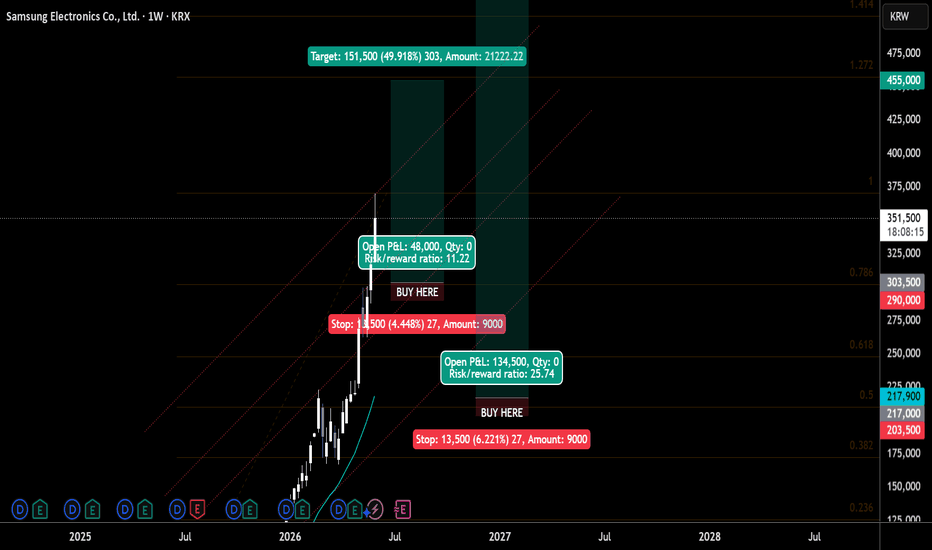
Short 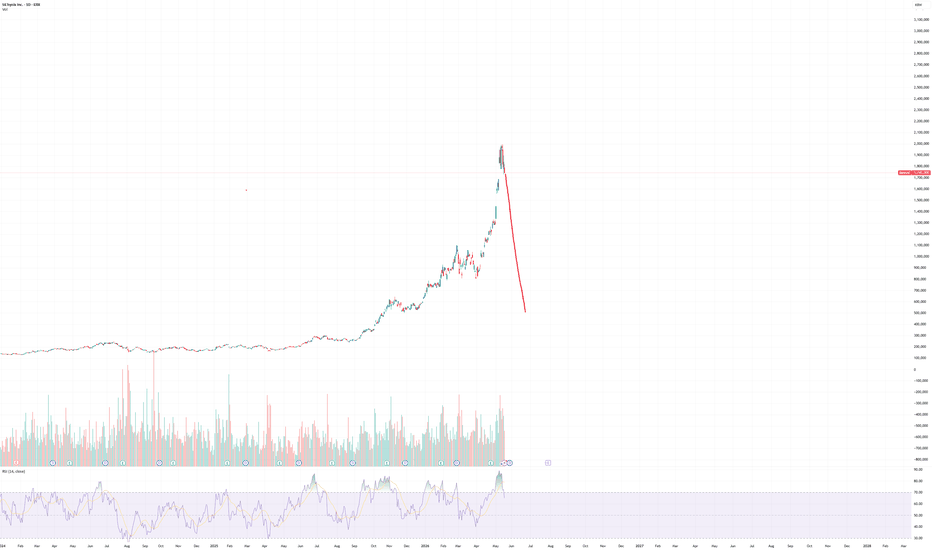
Long 
SK Hynix: strong structural bullish trendIn this period of high geopolitical volatility and massive impact on energy prices and inflation expectations, what is the right strategy to adopt in the equity market? At the beginning of the month, I provided a list of the best ways to hedge a portfolio against geopolitical risk. You can access it again via the table below. Naturally, the most effective option is to increase the share of cash in the portfolio, which is precisely what institutional investors have been doing for several weeks. However, cash allocation rarely exceeds 6–7% on average of equities under management among institutional investors. Another option is therefore to turn to stocks that are decoupled from geopolitical risk—stocks with a strong structurally bullish trend.
This is precisely the case for the memory segment within AI infrastructure. Demand from AI data centers is so strong that there is now a global shortage of a key component of AI GPUs: memory (RAM), specifically referred to as HBM (High Bandwidth Memory) for AI.
As a result, companies that are leaders in AI memory manufacturing have structurally bullish fundamentals, given the large imbalance between limited supply and rapidly growing demand. These stocks are clearly resilient, even during periods of intense geopolitical stress.
In particular, I invite you to look at SK Hynix, which is listed in South Korea and also available in Europe via certificates.
Here are the key fundamental drivers for AI memory and SK Hynix:
• The DRAM market is dominated by three major players: Samsung Electronics, SK Hynix, and Micron Technology
• SK Hynix clearly dominates the AI memory (HBM) segment, with around 60% market share and is a key supplier for Nvidia GPUs
• Memory shortages are expected to persist until 2030 according to recent studies
• No, SK Hynix is not a global monopoly in RAM
• But yes, it has become the most strategic player in AI at the moment
• It is primarily listed on the Korean stock exchange (KRX)
• It is also tradable in Europe via certificates (DR / GDR)
• In Germany (notably Frankfurt), Global Depositary Receipts (GDRs) are available
The underlying trend is clearly bullish for SK Hynix stock, and all short-term pullbacks represent opportunities as long as the market remains above the 200-day moving average. The chart below shows Japanese candlesticks on monthly, weekly, and daily timeframes for SK Hynix.
DISCLAIMER:
This content is intended for individuals who are familiar with financial markets and instruments and is for information purposes only. The presented idea (including market commentary, market data and observations) is not a work product of any research department of Swissquote or its affiliates. This material is intended to highlight market action and does not constitute investment, legal or tax advice. If you are a retail investor or lack experience in trading complex financial products, it is advisable to seek professional advice from licensed advisor before making any financial decisions.
This content is not intended to manipulate the market or encourage any specific financial behavior.
Swissquote makes no representation or warranty as to the quality, completeness, accuracy, comprehensiveness or non-infringement of such content. The views expressed are those of the consultant and are provided for educational purposes only. Any information provided relating to a product or market should not be construed as recommending an investment strategy or transaction. Past performance is not a guarantee of future results.
Swissquote and its employees and representatives shall in no event be held liable for any damages or losses arising directly or indirectly from decisions made on the basis of this content.
The use of any third-party brands or trademarks is for information only and does not imply endorsement by Swissquote, or that the trademark owner has authorised Swissquote to promote its products or services.
Swissquote is the marketing brand for the activities of Swissquote Bank Ltd (Switzerland) regulated by FINMA, Swissquote Capital Markets Limited regulated by CySEC (Cyprus), Swissquote Bank Europe SA (Luxembourg) regulated by the CSSF, Swissquote Ltd (UK) regulated by the FCA, Swissquote Financial Services (Malta) Ltd regulated by the Malta Financial Services Authority, Swissquote MEA Ltd. (UAE) regulated by the Dubai Financial Services Authority, Swissquote Pte Ltd (Singapore) regulated by the Monetary Authority of Singapore, Swissquote Asia Limited (Hong Kong) licensed by the Hong Kong Securities and Futures Commission (SFC) and Swissquote South Africa (Pty) Ltd supervised by the FSCA.
Products and services of Swissquote are only intended for those permitted to receive them under local law.
All investments carry a degree of risk. The risk of loss in trading or holding financial instruments can be substantial. The value of financial instruments, including but not limited to stocks, bonds, cryptocurrencies, and other assets, can fluctuate both upwards and downwards. There is a significant risk of financial loss when buying, selling, holding, staking, or investing in these instruments. SQBE makes no recommendations regarding any specific investment, transaction, or the use of any particular investment strategy.
CFDs are complex instruments and come with a high risk of losing money rapidly due to leverage. The vast majority of retail client accounts suffer capital losses when trading in CFDs. You should consider whether you understand how CFDs work and whether you can afford to take the high risk of losing your money.
Digital Assets are unregulated in most countries and consumer protection rules may not apply. As highly volatile speculative investments, Digital Assets are not suitable for investors without a high-risk tolerance. Make sure you understand each Digital Asset before you trade.
Cryptocurrencies are not considered legal tender in some jurisdictions and are subject to regulatory uncertainties.
The use of Internet-based systems can involve high risks, including, but not limited to, fraud, cyber-attacks, network and communication failures, as well as identity theft and phishing attacks related to crypto-assets.
 Education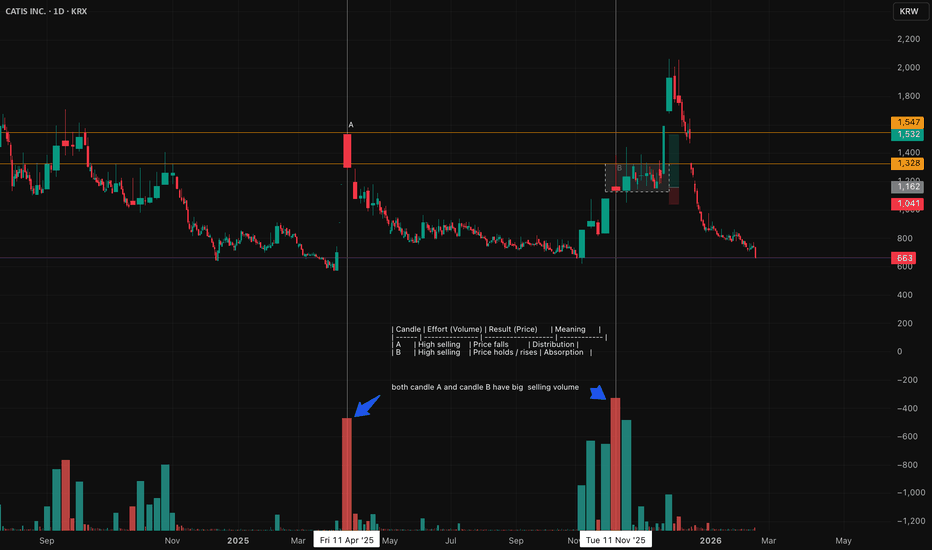
[LOI] - SK Hynix - SK Hynix
Key Points :
Bullish Outlook on SK Hynix : The company dominates the high-bandwidth memory (HBM) market with over 50% share, driven by AI demand from clients like NVIDIA. Record 2025 profits suggest continued growth in 2026, with analysts forecasting undervaluation and potential 20-50% stock upside amid a memory supercycle.
CHIPS Act Benefits : SK Hynix secured up to $458M in direct grants and $500M in loans, plus 25% tax credits, supporting its $3.87B Indiana investment. This funding accelerates U.S.-based AI chip packaging, enhancing domestic supply chains.
On-Shoring Advantages : The West Lafayette facility marks SK Hynix's first U.S. advanced packaging plant, creating 1,000 jobs and reducing reliance on Asian production. It aligns with U.S. efforts to bolster national security and AI leadership.
Company Overview :
SK Hynix Inc. (KRX: 000660), a top-tier South Korean semiconductor firm, focuses on DRAM, NAND flash, and HBM chips essential for AI, data centers, and consumer devices. As of January 2026, it holds about 33% global DRAM market share and 21% in NAND, with a market cap around $383B and stock at ~$554. Recent developments include launching a U.S.-based "AI Company" in February 2026, showcasing 16-layer HBM4 at CES, and investing $13B in a new South Korean packaging plant.
Notes on how I personally use my charts/NFA:
Each level L1-L3 and TP1-TP3 (Or S1-S3) has a deployment percentage. The idea is to flag these levels so I can buy 11% at L1 , 28% at L2 and if L3 deploy 61% of assigned dry powder. The same in reverse goes for TP. TP1: 61%, TP2:28% and TP3:11%. If chart pivots between TP's, in-between or in Between Sell levels these percentages are still respected. I like to use the trading range to accumulate by using this tactic.
Just my personal way of using this. This is not intended or made to constitute any financial advice.
This is not intended or made to constitute any financial advice.
NOT INVESTMENT ADVICE
I am not a financial advisor.
The Content in this TradingView Idea is for informational purposes only, you should not construe any such information or other material as legal, tax, investment, financial, or other advice. Nothing contained within this idea constitutes a solicitation, recommendation, endorsement, or offer to buy or sell any securities or other financial instruments in this or in in any other jurisdiction in which such solicitation or offer would be unlawful under the securities laws of such jurisdiction.
All Content on this idea post is information of a general nature and does not address the circumstances of any particular individual or entity. Nothing in the idea/post constitutes professional and/or financial advice, nor does any information on the idea/post constitute a comprehensive or complete statement of the matters discussed or the law relating thereto. You alone assume the sole responsibility of evaluating the merits and risks associated with the use of any information or other Content on the idea/post before making any decisions based on such information.
Sir. Galahad - QUANT
Disclaimer
The information and publications are not meant to be, and do not constitute, financial, investment, trading, or other types of advice or recommendations supplied or endorsed by.
Long 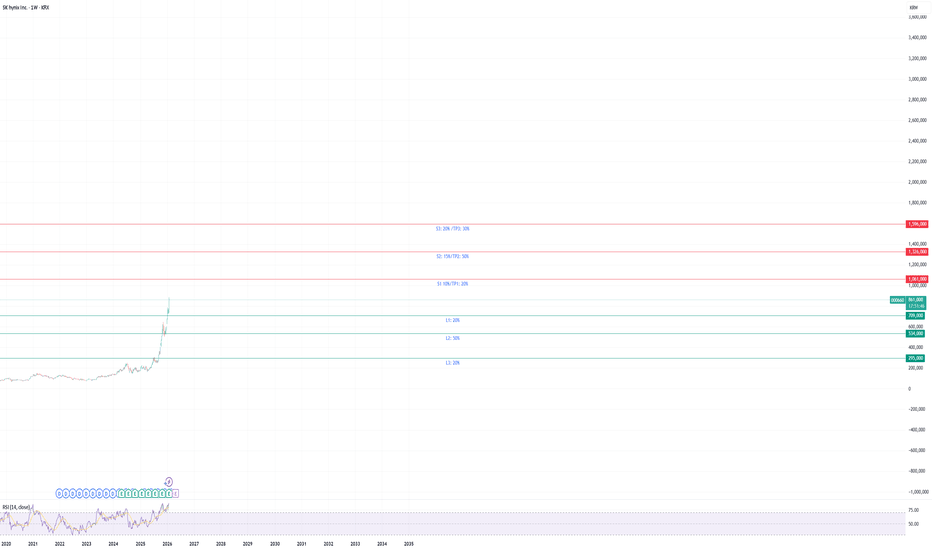
007660 (Korea) - ISU Petasys Major Momentum RunnerISU Petasys Co., Ltd. has had an incredible run, gaining over 360% in the last year. Based in South Korea, they are a major player in manufacturing multi-layer printed circuit boards (PCBs) used in networking and AI infrastructure .
The fundamental story here is all about the demand for high-performance computing and data centres. As a supplier to global tech giants, they’ve ridden the AI wave hard. The recent pullback doesn't look like a business failure; it looks like standard profit-taking after the stock got a bit ahead of itself. The demand for high-spec network boards in the AI space remains a strong driver.
Technically, the pullback has been a deep 30% drop back into value . Price fell through the shorter-term averages and is now looking like it is recovering and moving away from the more critical 100-day SMA (the red line). This is often where longer-term trends find support after a deep correction. The RSI has cooled all the way down to a neutral 49, resetting the overbought conditions we saw earlier. The MACD is still negative, but the selling pressure seems to be slowing down as price consolidates in this zone.
Might be worth a watch to see if it runs again. AI led demand isn't going away any time soon.
==============================
ABOUT ME: Global TradingView Moderator (English) and full-time trader. I focus on top-performing stocks worldwide , trading momentum and clean trend continuations after pullbacks. I use a trailing stop customised for each stock to manage risk, lock in gains, and exit when the trend ends. Nothing I post is trading advice. I simply like to highlight interesting companies from around the world that may be worth a closer look. Please give this idea a BOOST if you found it interesting, and FOLLOW ME to discover more standout stocks and businesses from global markets.
==============================  Short
Short
Long 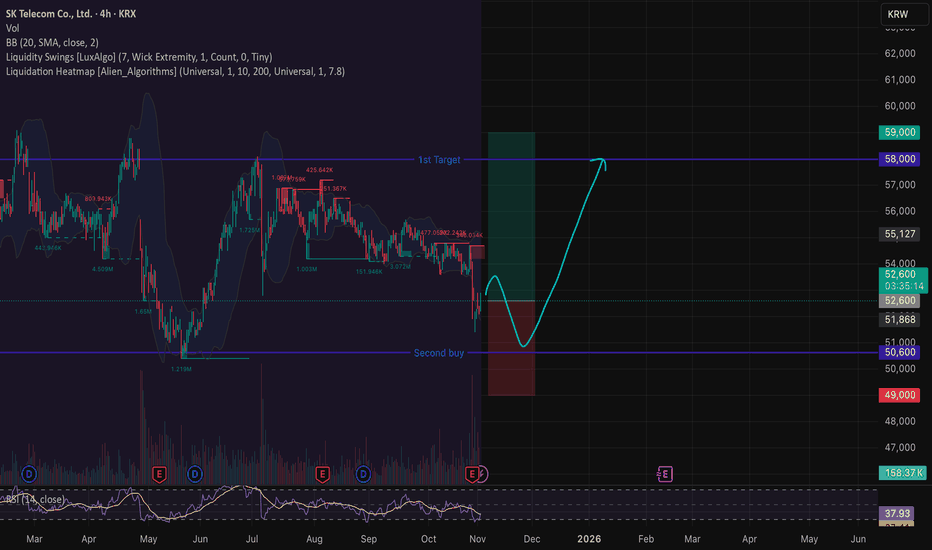
Walk This Way...This S. Korean company focuses on treatment of cystic fibrosis and chronic kidney disease, et al. Future Medicine, Limited.
Godspeed to this company as they search for cures for primary biliary cirrhosis; colorectal, prostate, and lung cancers and rheumatoid arthritis, et al. They target metabolic cancers, inflammatory and autoimmune diseases, to produce anticancer drugs, anti-fibrotics and antiviral remedies. Not only persistent, but painful diseases, as well. Who on earth wouldn't want this company to succeed ?
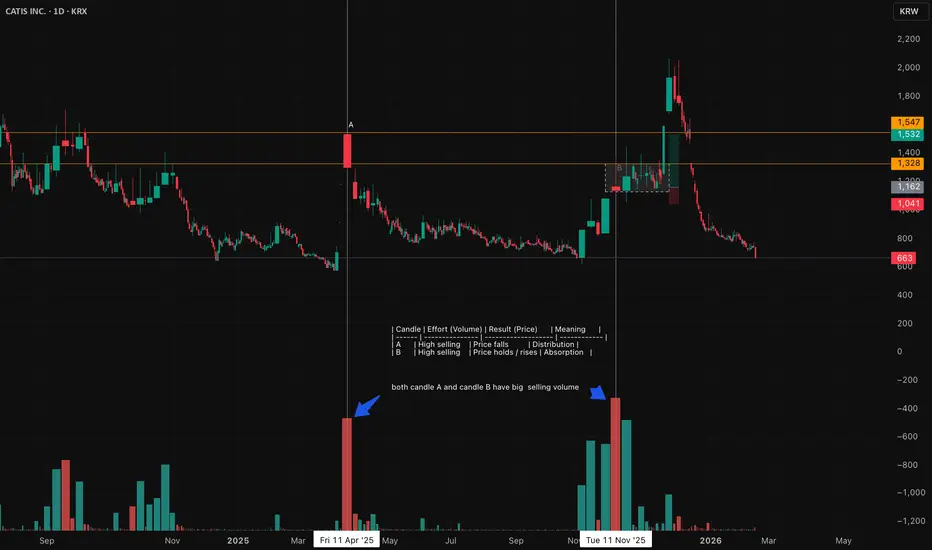
Selling Volume has completely Dried-up and the stock is in the process of setting Higher-Lows. MACD, StochasticsRSI, Rate-of-Change, and %r are all additive tenets of confirmation for the astute and intrepid investor.
Go Long.... it's at the 20... the 10... the 5... and Touchdown  Long
Long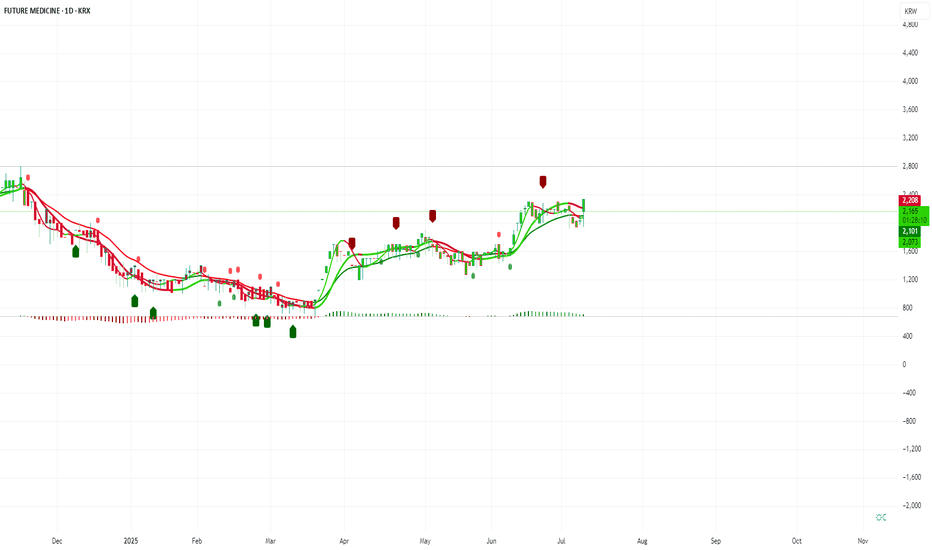
SK Hynix Inc at ATH
South Korea’s SK Hynix has recently surged to record high levels, with shares climbing to approximately ₩329,500 per share. Crazy move.
My Key Questions for Investors
1. Are there enough fundamental catalysts (beyond current AI/HBM momentum) to sustain the premium valuation?
2. How sensitive is demand to changes in global AI investment cycles, supply constraints, or policy/regulatory shifts (e.g. export controls)?
3. What risks could trigger a pullback — valuation concerns, DRAM/NAND oversupply, competition from Samsung, Micron etc., or macroeconomic headwinds (e.g. interest rates, chip tariffs)?
Final Thought:
SK Hynix’s ascent to an ATH underscores strong investor confidence in its AI memory business. If the company delivers as promised on HBM4 and maintains tight control over manufacturing and supply challenges, there’s potential for further upside.
However, with any record high comes risk — both from overextension and external headwinds.
This analysis is for educational purposes only and not financial advice. Please trade and invest responsibly.
If you found this helpful, like, follow me, subscribe, share and comment. Short 
 Long
Long
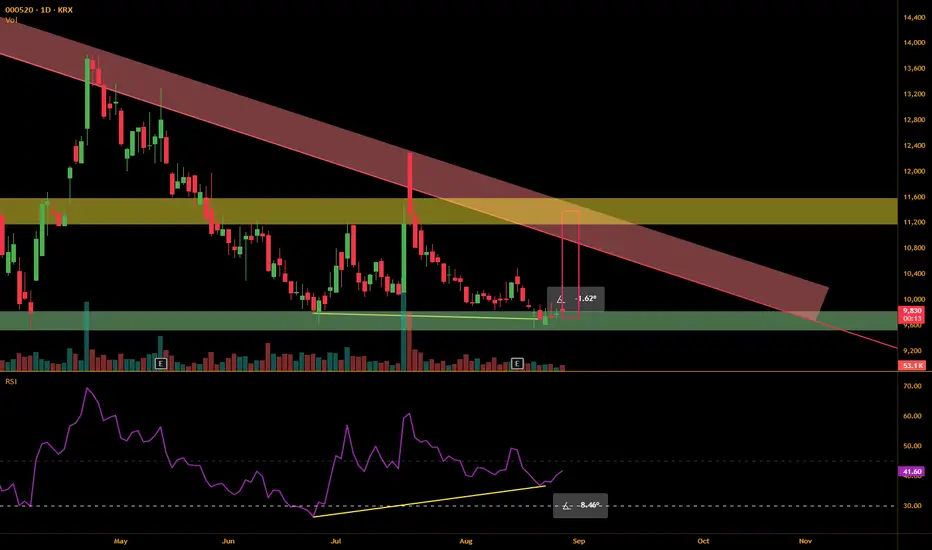
RSI Divergence & FB Wedge pattern on Samil Pharm.We see two overlapping bullish signals for $KRX:000520.
First signal is RSI Divergence, price making lower lows while RSI makes higher lows.
While the price difference isn't great, RSI difference is bigger, with the latest low pivot being 10 points higher than the previous one.
Second signal is price moving within the flat bottom wedge.
The price has historically rebounded whenever it entered the support zone of 9500 - 9800.
This is the third time price entering the zone, which isn't most ideal,
but the RSI Divergence reinforces the probability of a bullish trend.
If we see a bullish candle tomorrow with RSI surpassing 45 line, then might be a good time to enter long.
It is best to enter below 10,400, ideally around 10,200.
The first sell point would be slightly below the red resistance line, between 10,600 and 10,900.
The second and final sell point would be the yellow price action zone.
Estimated profit is 4%+ in 4-5 weeks.
 Long
Long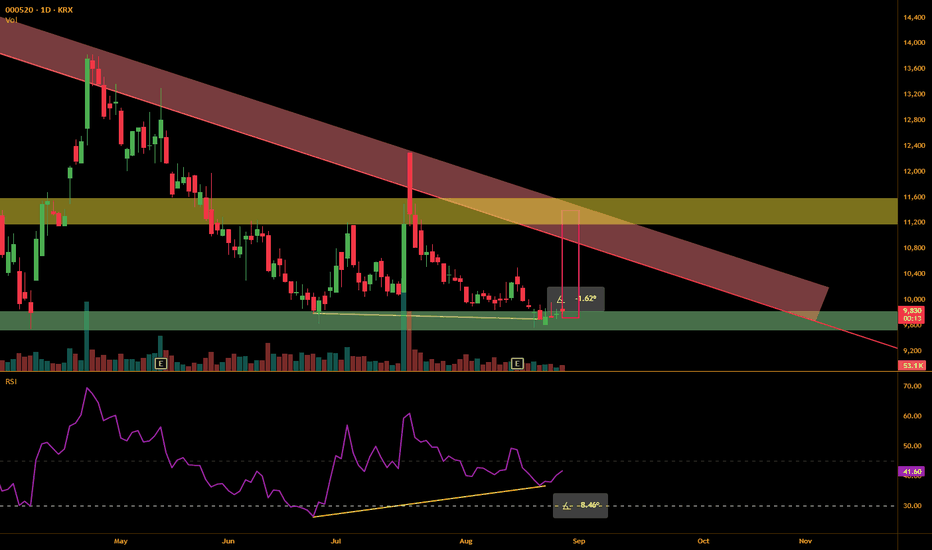
RSI Divergence on I-SCREAM MEDIAToday, we have a technical analysis on I-SCREAM MEDIA using RSI Divergence.
I used a "RSI Divergence" indicator created by @Shizaru,
which compares a difference between fast RSI and slow RSI.
The default period for fast RSI is 5 and slow, 14.
In the chart, we see price going downtrend, making lower lows while RSI difference makes higher low.
RSI difference closing to zero line indicates that the selling pressure is losing its momentum and might signal the beginning of the bullish movement.
We then see RSI difference breaking through the zero line, which is a good bullish signal.
However, because there's a price action zone from 19,000 to 19,500,
watching the price movements further before entering might be wise.
If the price manages to pass the test and break through the zone, then might be a good time to enter.