LG Electronics — Bearish Projection Toward 350KLG Electronics — Bearish Projection Toward 350K 📉🇰🇷
LG Electronics (066570) is showing a significant shift in its price structure, with the broader chart presenting a strong downside scenario. After the powerful advance that took the stock to record levels earlier this year, the subsequent price action has started to develop a different character.
From the current structure, the selling thesis is built around a larger corrective phase. Price has already moved substantially away from its June peak, while recent sessions have continued to trade around the ₩200K region. The latest close was approximately ₩198,400.
Technical Structure
The chart is being approached from a downside perspective, with the objective positioned at ₩350,000.
The key idea is not simply a short-term decline. The setup focuses on the possibility of a broader bearish sequence developing from the higher-timeframe structure.
If the selling phase continues to build, price can progressively travel through the projected path toward the ₩350K area.
Market Roadmap
Current Structure → Bearish Continuation → Lower Price Levels → ₩350K Objective
The methodology is centered on price behavior, structural shifts and the directional sequence visible on the chart. Rather than relying on isolated candles, the complete price formation is being treated as one larger technical picture.
LG's sharp rally earlier in 2026 demonstrated how quickly the stock can move when momentum expands. The same volatility means that a reversal phase can also produce sizeable price swings.
Setup Overview
- Instrument: LG Electronics
- Ticker: 066570
- Exchange: Korea Exchange
- Bias: Sell
- Projected Target: ₩350,000
- Approach: Higher-timeframe structural analysis
- Focus: Bearish continuation and downside expansion
The ₩350K level represents the projected destination of this analysis, not a guarantee of future price movement. The setup remains dependent on how the structure develops across subsequent sessions.
The chart has changed its character — the next phase is mapped toward 350K. 🎯📉  Short
Short
Kia Corporation — Sell Setup | 136K → 92KKia Corporation is currently developing within a prolonged selling environment, with the stock having experienced continued downward pressure across the recent price structure. Sellers have remained influential, and the broader chart continues to reflect weakness rather than a confirmed transition into a sustained bullish phase.
However, the projected move is not a simple straight decline from the current level. The setup allows for an upward recovery first, with 136,000 KRW identified as the next important upside point. Following that retracement, the larger bearish scenario comes back into focus, with 92,000 KRW positioned as the primary downside objective.
📈 Phase One — Recovery Toward 136K
The first part of the roadmap points toward a potential rise from the current area toward 136,000 KRW.
After an extended period of selling, the market can produce a counter-move even while the dominant structure remains vulnerable. This upward leg is therefore treated as a retracement within the larger bearish framework rather than an immediate declaration of a new bullish trend.
Current zone → Upward reaction → 136K
The 136K area becomes an important stage in the overall setup, where the character of price action can once again be evaluated.
📉 Phase Two — Decline Toward 92K
Once the projected recovery toward 136K develops, the focus shifts back to the downside.
The larger thesis is that sellers can regain control after the upward reaction and extend the existing bearish cycle. A renewed wave of supply could then take price through progressively lower levels, opening the path toward the 92,000 KRW target.
136K → Bearish reversal → Selling resumes → 92K
This gives the setup a defined sequence rather than treating the market as a one-directional move.
🔻 Broader Selling Environment
Kia has already been moving lower during September. Historical data shows the stock closing at 131,200 KRW on September 1 and 121,900 KRW on September 18, while several sessions during the month recorded further declines.
The current price behaviour therefore fits the broader context of an established downward phase. The proposed 136K recovery would represent a counter-trend move within that environment, while 92K remains the larger bearish destination in this analysis.
🧭 Technical Framework
The setup is based on the sequence of price behaviour rather than a single level.
The prolonged decline suggests that sellers have already demonstrated considerable influence. A temporary rise does not automatically erase that structure. Instead, the projected recovery toward 136K can provide the next phase from which downside momentum may develop again.
The key idea is:
Retracement higher first — continuation lower afterward.
If the market follows this projected path, the move toward 136K becomes the first checkpoint, while the subsequent bearish leg targets 92K.
🌐 Fundamental Context
Kia's business fundamentals are not uniformly bearish. The company reported second-quarter 2026 net income of approximately KRW 2.33 trillion, up from KRW 2.27 trillion a year earlier, while six-month net income was lower year over year.
Kia also announced a long-term strategy targeting 4.13 million global vehicle sales by 2030 and plans for KRW 49 trillion of investment from 2026–2030.
Therefore, the 136K → 92K scenario is specifically a technical trading thesis, based on the observed price structure and the continued selling phase, rather than a conclusion that Kia's underlying business is deteriorating.
📌 Setup Overview
- Instrument: Kia Corporation
- Ticker: 000270
- Exchange: Korea Exchange / KOSPI
- Current phase: Extended selling
- First projected move: 136,000 KRW
- Primary direction: Sell
- Downside target: 92,000 KRW
- Structure: Retracement higher → Bearish continuation
- Technical focus: Price behaviour, momentum and market structure
🎯 Final View
Kia has already spent considerable time in a bearish phase, with sellers continuing to influence the broader price structure.
The roadmap is therefore clearly divided into two stages:
First, a potential recovery toward 136K. Then, a larger bearish move toward 92K.
The upside retracement is part of the setup — the bigger objective remains the downside toward 92,000 KRW. 📈➡️📉🎯  Short
Short
Hyundai Motor — Bearish Setup | 380K First, 340K NextHyundai Motor is developing a structured downside opportunity after remaining under selling pressure for an extended period. The broader price behaviour continues to reflect seller dominance, with the market repeatedly struggling to establish a sustained bullish recovery.
However, the current setup is not calling for an immediate straight-line decline. The projected sequence allows for an upward retracement first, with 380,000 KRW identified as the next important upside level. Once that retracement develops, the larger bearish scenario comes back into focus, with 340,000 KRW mapped as the downside objective.
📈 First Phase — Retracement Toward 380K
The first stage of the setup is a potential recovery from the current area toward 380,000 KRW.
After a prolonged period of weakness, temporary upward movements can occur even within a broader bearish structure. This projected rise is therefore viewed as a retracement within the larger setup rather than a complete change in direction.
Current area → Recovery phase → 380K
The 380K region becomes an important point in the roadmap because it can provide the next opportunity for sellers to reassert control.
📉 Second Phase — Selling Toward 340K
Once the upside retracement reaches the projected 380K area, the focus shifts back toward the downside.
The larger technical picture remains bearish, with sellers having maintained influence across the preceding trend. If the upward reaction loses strength around the higher zone, another wave of selling could develop and push price toward the 340,000 KRW target.
380K → Selling resumes → Downside expansion → 340K
This creates a clear two-step structure: upward retracement first, bearish continuation afterward.
🔻 Extended Selling Structure
Hyundai Motor has already experienced a substantial decline from higher levels. Recent market data shows the stock closed at 365,000 KRW on September 18, 2026, compared with 400,500 KRW on September 1, illustrating the sharp weakness seen during September.
The broader 52-week range currently extends from 212,000 KRW to 783,000 KRW, showing that the stock has experienced considerable volatility over the past year.
The technical thesis here is therefore based on the continuation of an established bearish environment rather than a newly developing sell signal.
📊 Technical Perspective
The key feature of the analysis is the sequence of movement.
Price does not have to decline continuously for the bearish thesis to remain valid. A rebound toward 380K can occur while the larger structure remains vulnerable to renewed selling.
The focus is on the reaction after that upward phase. If sellers continue to demonstrate strength, the recovery can become another stage within the larger downward cycle rather than the beginning of a sustained bullish trend.
🌐 Fundamental Context
Hyundai's fundamental picture contains both supportive and challenging elements. In its second-quarter 2026 results, operating profit fell 21% year over year to KRW 2.9 trillion, while revenue increased 2% to KRW 49.2 trillion. The company maintained its full-year outlook despite the weaker quarterly profitability.
Hyundai also reported August 2026 total vehicle sales of 288,574 units, down 14.2% year over year, with January–August total sales down 6.0% year over year.
These figures provide broader context, but the 380K → 340K roadmap is a technical trading scenario, based primarily on price structure and directional behaviour.
🧭 Complete Roadmap
Current bearish phase → Upward retracement → 380K → Sellers regain control → Further decline → 340K
The important distinction is that the projected 380K move does not replace the bearish thesis. It represents the first leg of the mapped sequence.
The larger objective remains the downside toward 340,000 KRW if the bearish structure continues to hold.
🔍 Setup Overview
- Instrument: Hyundai Motor
- Ticker: 005380
- Exchange: Korea Exchange
- Current structure: Extended bearish phase
- First projected move: Upward retracement toward 380K
- Primary direction: Sell
- Downside objective: 340K
- Market character: Sellers remain influential
- Technical focus: Structure, momentum, retracement and continuation
- Scenario: 380K first → 340K afterward
🎯 Final View
Hyundai Motor has been declining for an extended period, and sellers continue to hold significant influence over the broader structure.
The projected path is therefore not simply sell from here. The roadmap is more precise:
First, a move toward 380K. Then, if the bearish structure reasserts itself, a further decline toward 340K.
The market can retrace upward without changing the larger picture — 380K is the first checkpoint, while 340K remains the downside destination. 📈➡️📉🎯  Short
Short
Samsung Electronics — Bearish Roadmap | 275 First, 230Samsung Electronics is presenting a two-stage market scenario in which price can first extend higher toward 275, followed by a potential bearish reversal toward the 230 target.
The important part of this setup is the sequence. The immediate move is not being treated as a direct decline. Instead, the chart structure suggests that price can make one more upward extension before the larger selling phase develops.
From a technical perspective, the 275 area becomes the first important destination. Price can continue to advance into this zone as part of the initial leg, but the broader setup remains focused on what happens afterward. Once the upward phase completes, the analysis shifts toward a potential change in momentum and a deeper move lower.
📈 First Leg — Move Toward 275
The initial roadmap calls for an upside extension toward 275.
This phase can develop through continued buying activity and a further expansion of the current upward movement. The rise toward 275 is therefore considered part of the overall setup rather than a contradiction to the later bearish view.
Current area → Upside extension → 275
The 275 region is the first major checkpoint in the projected sequence.
📉 Second Leg — Downside Toward 230
After the move toward 275, the focus changes completely.
The bearish scenario anticipates that the higher level can become the point from which selling pressure develops. If price loses its upward momentum and sellers regain control, the subsequent decline could extend substantially lower toward the 230 target.
275 → Momentum reversal → Selling phase → 230
This creates a clearly defined two-phase roadmap: higher first, lower afterward.
The objective is not to treat every upward candle as bullish continuation. Instead, the analysis separates the two potential phases and focuses on the larger price sequence.
🔍 Technical Perspective
The setup is based on the anticipated interaction between price structure, momentum and the reaction around the projected upper zone.
Samsung Electronics has recently experienced substantial price movement. The stock closed at KRW 261,000 on September 18, 2026, after gaining 3.37% on the day. Recent reporting also notes that the share reached KRW 279,000 intraday on September 8, placing the 275 area within the recent trading structure.
Fundamentally, Samsung's latest reported second-quarter 2026 results were strong, with quarterly revenue of KRW 171.5 trillion and operating profit of KRW 89.5 trillion. Therefore, this setup should be understood specifically as a technical price-action scenario, not as a claim that Samsung's underlying business is deteriorating.
🧭 Complete Market Roadmap
Current price → 275 upside → Bearish shift → Extended decline → 230 target
The first move is toward the upside.
The larger projected move comes afterward.
That distinction is central to the setup. Rather than forcing a bearish view immediately, the analysis maps the potential path in sequence and identifies where the character of the market could change.
📌 Setup Overview
- Instrument: Samsung Electronics
- Ticker: 005930
- Exchange: Korea Exchange
- Initial projection: 275
- Primary direction afterward: Sell
- Downside target: 230
- Structure: Upside first, downside afterward
- Technical focus: Price structure, momentum and directional transition
- Strategy: Two-stage bearish roadmap
🎯 Final View
The chart presents a 275-first, 230-next scenario.
The market may have one more upward leg before the larger downside phase takes shape. Once the projected upper area is reached, the focus shifts toward a potential bearish transition and continuation toward 230.
First the rise toward 275 — then the bigger move lower toward 230. 📈➡️📉🎯  Short
Short
 Long
Long
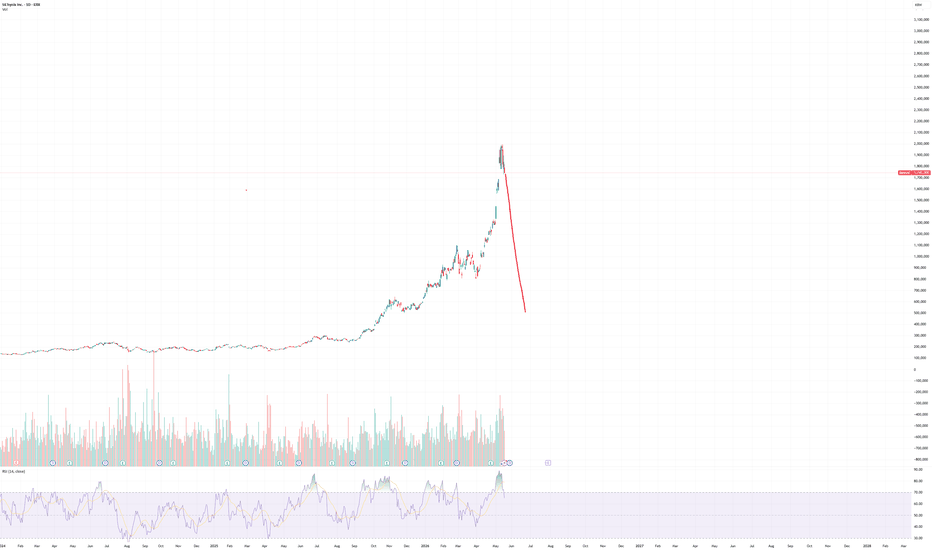
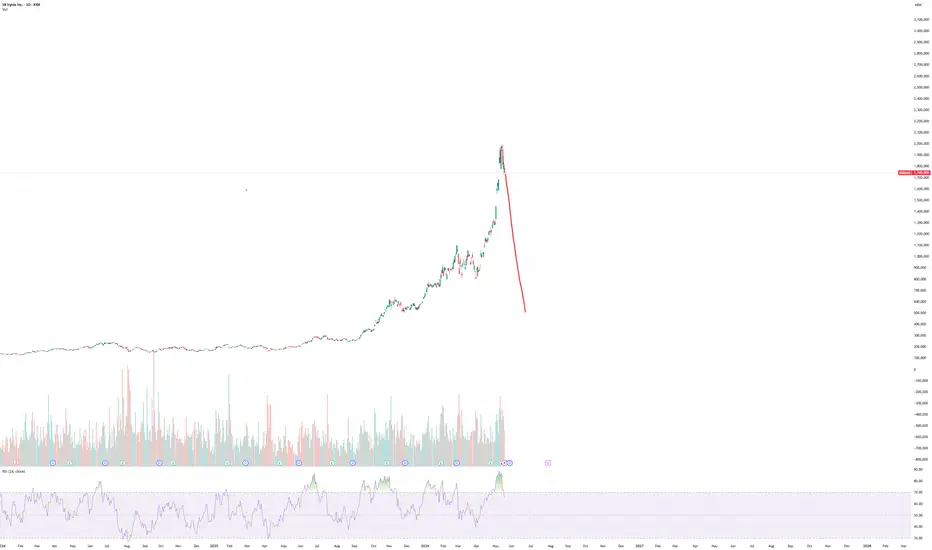
SK HYNIX 1M MA100 correction historically probable.SK Hynix Inc. (SKHY) has gone parabolic since its last contact with the 1M MA100 (green trend-line) back in January 2023 and last month we saw its strongest red 1M candle since the 2008 Bear Cycle (U.S. Housing Crisis).
Following June's All Time High (ATH), that red candle was a first warning that this multi-year parabolic rally that got incredibly accelerated in the past year, has ended. Historically, especially since the 2008 Bear Cycle bottom, the market has used the 1M MA100 as a starting point for new long-term rallies.
We've had three major corrections to the 1M MA100 within the past 15 years, and as mentioned the last one was back in 2022. The early signal on all Tops that initiated those corrections was a Lower Highs Top on the 1M RSI and on the recent June ATH, we made one.
As a result, we expect SK Hynix to extend the correction all the way to its 1M MA100, possibly around 600000. Only after the 1M RSI hits its 15-year Buy Zone and bounces, will we consider SK Hynix a long-term buy opportunity again.
---
** Please LIKE 👍, FOLLOW ✅, SHARE 🙌 and COMMENT ✍ if you enjoy this idea! Also share your ideas and charts in the comments section below! This is best way to keep it relevant, support us, keep the content here free and allow the idea to reach as many people as possible. **
---
💸💸💸💸💸💸
👇 👇 👇 👇 👇 👇 Short 
What Is the Most Important Level at the Current Price???
Hello, traders.
If you follow me, you'll be able to receive new market updates and analysis quickly.
I hope you have a successful trading day.
================================================================
===================================================
The most important price level to watch right now is:
▶ 229,500
Whether price can hold above this level as support could play an important role in determining the next major direction.
More importantly, 229,500 corresponds to the HA-High level on the 1M chart.
Therefore, rather than viewing 229,500 simply as an important support level, I believe it is better to approach it from the following perspective:
▶ Hold above 229,500 → Bullish momentum may continue
▶ Break below 229,500 → Lower support levels may be tested
Since this is a higher-timeframe HA-High zone, it should also be treated as a high-price area rather than a primary accumulation zone.
================================================================
========================================================
The major support and resistance levels on the 1D chart are marked with horizontal lines.
If price falls below 229,500, the next important level to watch is:
▶ Around 207,000
We need to see whether price can establish support around 207,000.
If 207,000 fails to hold and price continues lower, a stop-loss should be considered.
The reason is that the decline would be developing from a high-price zone rather than from a major accumulation zone.
In simple terms:
229,500 Breakdown
↓
207,000 Support Test
↓
Support Holds → Watch for a Rebound
Support Fails → Stop-Loss / Risk Reduction
If price continues higher, the next major area to watch is:
▶ 310,500 ~ 321,500
At this zone, the important question is not simply whether price can break through it.
We also need to see whether the zone can be converted into support after the breakout.
The reason is that StochRSI has already entered the overbought region.
An overbought StochRSI does not necessarily mean that the uptrend is about to end.
However, it does indicate that upside momentum may become constrained and that the probability of a short-term pullback or profit-taking may increase.
For price to continue rising while StochRSI remains overbought, strong buying pressure will be required.
Eventually, some form of price consolidation or pullback may be needed to cool down the overheated StochRSI.
Therefore, the ideal structure would be:
▶ Break above 310,500 ~ 321,500
▶ Pullback
▶ Confirm support
▶ Resume the uptrend
================================================================
======================================
The major HA-High levels are currently located around:
▶ 1M HA-High : 229,500
▶ 1W HA-High : 310,500
▶ 1D HA-High : 321,500
This means that several major higher-timeframe resistance zones are positioned above the current price structure.
For the bullish trend to strengthen, price needs to break through these high-price zones one by one and convert them into support.
================================================================
=======================================================
One of the most important indicators to watch during this move is OBV.
The key question is:
▶ Can the OBV channel between the Low Line and High Line transition into a rising channel?
If OBV continues to rise and eventually breaks above the High Line together with price, it may indicate that stronger buying pressure is entering the market.
On the other hand, if price continues higher while OBV fails to confirm the move, the reliability of the rally may weaken.
================================================================
============================================
A new major bullish wave is likely to begin when price successfully breaks above:
▶ 334,000 ~ 360,500
However, before reaching that point, the more important question is how price moves through the high-price zones below it.
229,500
↓
310,500
↓
321,500
↓
334,000 ~ 360,500
Rather than seeing only temporary breakouts, I would prefer to see the following structure:
▶ Breakout
▶ Pullback
▶ Support Confirmation
▶ Continuation Higher
This type of price action would provide stronger confirmation that the bullish trend is developing.
================================================================
==============================================
Looking at the chart in greater detail, price touched approximately 287,000 and then pulled back.
Price is now trading near:
▶ 268,500
This area corresponds to the previous HA-High level on the 1W chart.
Therefore, the key short-term zone to monitor is:
▶ 268,500 ~ 287,000
The important question is whether price can establish support within this range and resume the upward move.
================================================================
=========================================
StochRSI is currently in the overbought region.
Therefore, the probability of limited upside momentum or a short-term correction is increasing.
However, StochRSI should not be used alone to determine whether the bullish trend has ended.
We also need to monitor:
▶ BSSC : Holding above the zero line
▶ OBV : Continuing to rise
▶ OBV High Line : Breakout confirmation
If BSSC remains above zero while OBV continues rising and eventually breaks above its High Line, strong buying pressure may allow the bullish trend to continue even while StochRSI remains overbought.
Therefore, the following combination is important:
+
+
These indicators should be evaluated together rather than independently.
================================================================
=========================================
If price fails to hold the current area and continues lower, the next important support zone is:
▶ 251,000 ~ 261,500
This area is important because Fibonacci levels from both sides overlap around this range.
We need to monitor whether buyers step in and establish support.
If this zone also fails to hold, a stop-loss or further risk reduction should be considered.
Again, the reason is that the decline would be occurring from a high-price zone.
================================================================
=============================================
HA-High and DOM(60) represent areas where profit protection should generally take priority over building a new medium- or long-term position.
Therefore, these areas are more suitable for:
▶ Scalping
▶ Day Trading
▶ Scaling Out
▶ Profit Protection
If you are not comfortable with short-term trading, staying on the sidelines may be the better choice.
HA-Low and DOM(-60) represent areas where traders can consider building their main position after confirming support.
These areas can therefore be approached from the perspective of:
▶ Scaling In
▶ Building a Core Position
▶ Short-Term or Longer-Term Positioning
================================================================
===============================================
My preferred approach is to build a core position gradually around HA-Low and DOM(-60).
When price reaches HA-Low or DOM(-60), I first monitor whether support is forming.
If support is confirmed, I begin accumulating.
Instead of deploying all available capital at once, I divide the position into several entries.
HA-Low / DOM(-60)
↓
Support Confirmation
↓
First Entry
↓
Price Rises
↓
Another Pullback
↓
HA-Low / DOM(-60) Retest
↓
Support Confirmation
↓
Additional Entry
By repeating this process, the core position can gradually be built.
================================================================
=========================================
Deploying all available capital in a single entry requires an extremely strong setup.
For example, price may be rebounding from a major long-term support zone or recovering after an unusually sharp sell-off.
However, even a very strong support zone cannot guarantee that the absolute bottom has been reached.
Going all-in at a single price therefore exposes the trader to unnecessary risk.
Instead, I believe it is safer to gradually scale into the position whenever price reaches:
▶ HA-Low
▶ DOM(-60)
and confirms support.
================================================================
==================================================================
If accumulation is successful and the bullish trend develops, price will eventually move away from HA-Low and DOM(-60).
At some point, it will begin approaching:
▶ HA-High
▶ DOM(60)
When that happens, the priority should shift from accumulation to profit protection.
Even if price establishes support around HA-High or DOM(60) and continues higher, new medium- or long-term buying should generally be avoided.
Instead, these zones are better suited for scalping or day trading, with profits being realized along the way.
If price begins to reject or decline from HA-High or DOM(60), the core position should also be gradually reduced to protect profits.
The reason is simple:
▶ HA-High and DOM(60) represent high-price zones.
================================================================
=====================================================================
When price continues to rise, traders naturally begin expecting even higher prices.
However, markets rarely move exactly as we expect.
Instead of thinking:
"It will probably go higher."
It is more important to ask:
"What is the chart actually showing right now?"
When price enters a high-price zone, scaling out and protecting existing profits should become part of the trading process.
Over the long run, protecting profits can be just as important as identifying the perfect entry.
================================================================
=============================================================
Paying too much attention to the average entry price displayed by your exchange or brokerage can sometimes restrict your ability to manage positions effectively.
I prefer to separate:
▶ Core Position Average Entry
▶ Day-Trading Position Average Entry
The average entry price of the core position should remain an important reference.
However, temporary changes in the displayed average price caused by short-term trades do not need to dominate your decision-making.
What matters more is understanding:
▶ Where the core position was accumulated
▶ Where short-term positions were added
▶ Where profits should be realized
================================================================
========================================
This brings us back to 229,500.
There is no doubt that 229,500 is an important level within the current market structure.
However, one important fact should not be forgotten:
▶ 229,500 = 1M HA-High
In other words, 229,500 represents a high-price zone on the monthly chart.
Therefore, even though it is an important level, it should not automatically be treated as a core accumulation zone.
Around 229,500, the preferred approach is:
▶ Monitor Support
▶ Scalping
▶ Day Trading
▶ Profit Protection
Meanwhile, the current DOM(-60) level is located around:
▶ 207,000
Therefore, positions accumulated around 207,000 after support confirmation can be classified as part of the core position.
================================================================
======================
▶ 207,000
DOM(-60)
Potential Core Accumulation Zone
▶ 229,500
1M HA-High
Critical Trend Decision Level
Primarily Scalping / Day-Trading Territory
▶ 251,000 ~ 261,500
Fibonacci Confluence Support Zone
Watch for Support During a Pullback
▶ 268,500
Previous 1W HA-High
Current Short-Term Support Reference
▶ 268,500 ~ 287,000
Current Short-Term Decision Zone
Watch for Support and Bullish Continuation
▶ 310,500
1W HA-High
High-Price Resistance / Profit-Protection Zone
▶ 321,500
1D HA-High
High-Price Resistance
Watch for Breakout and Support Conversion
▶ 334,000 ~ 360,500
Major Breakout Zone
Potential Starting Point of a New Bullish Wave
================================================================
=================
Accumulate in low-price zones.
Protect profits in high-price zones.
HA-Low / DOM(-60)
→ Confirm Support
→ Scale Into the Core Position
HA-High / DOM(60)
→ Protect Profits
→ Scale Out
→ Focus on Scalping / Day Trading
An overbought StochRSI alone does not automatically mean "SELL."
We also need to determine:
▶ Is BSSC holding above zero?
▶ Is OBV rising?
▶ Can OBV break above the High Line?
Ultimately, the goal is not to predict every market move.
The goal is to apply the appropriate trading strategy based on where price is currently located within the market structure.
When the chart shows a low-price zone, prepare for accumulation.
When the chart shows a high-price zone, focus on protecting profits.
And most importantly:
"Instead of trying to catch the exact bottom or top with a single trade, manage market uncertainty through scaling in and scaling out."
This is one of the most effective ways to reduce risk and remain consistent over the long term.
---
Thank you for reading.
I wish you successful trading.
Long 
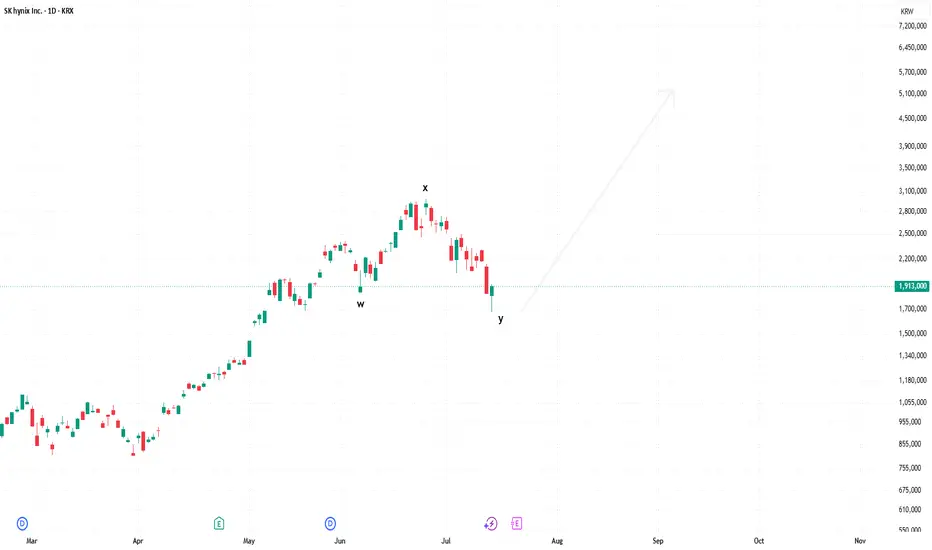
SKHY Edges Key Support: Valuation Cheap, but Trend not ReversedSK Hynix fell 9.61% on July 29, closing at KRW 1,401,000 (SKHY: approximately $130.17) after reaching an intraday low of KRW 1,246,000 (approximately $115.77). The stock has now declined more than 50% from its late-June high, but the latest low tested a previous breakout area, suggesting that buyers are beginning to defend this zone.
The company’s fundamentals remain strong. Demand for HBM and high-performance memory used in AI servers has not shown a meaningful decline, while revenue and operating profit remain at historically high levels. However, the market had already priced in extremely optimistic growth expectations. Even record earnings can trigger valuation compression when the results fall short of those expectations.
Following the sharp correction, SK Hynix no longer appears expensive. Still, semiconductor cycle leaders often trade at their lowest P/E multiples near peak earnings. A low valuation alone is therefore not enough to confirm a market bottom.
Key Technical Levels
The most important support zone is KRW 1,246,000–1,249,000 ($115.77–$116.05). As long as this area holds, the stock may begin forming a base or stage an oversold rebound. A confirmed daily close below it would expose the next support at KRW 1,100,000–1,150,000 ($102.20–$106.85).
The first resistance zone is located at KRW 1,550,000–1,620,000 ($144.01–$150.52). The short-term bearish structure would begin to weaken only if price recovers this area.
Further resistance stands at KRW 1,780,000–1,860,000 ($165.38–$172.82). A more meaningful medium-term trend reversal would require a recovery above KRW 2,000,000–2,100,000 ($185.82–$195.12).
Trading Setups
Aggressive traders may watch the KRW 1,246,000–1,300,000 ($115.77–$120.79) area for a bullish engulfing candle, double bottom, or higher low before considering a small position. A confirmed break below KRW 1,246,000 ($115.77) would invalidate the bottom-fishing setup.
More conservative traders may prefer to wait for a recovery above KRW 1,620,000 ($150.52). If that level is reclaimed, the next target area would be KRW 1,780,000–1,860,000 ($165.38–$172.82).
Fundamentals remain strong and the valuation has compressed, but the technical trend has not yet reversed. Holding the key support could lead to a base-building phase; losing it would keep the broader downtrend intact. Long 
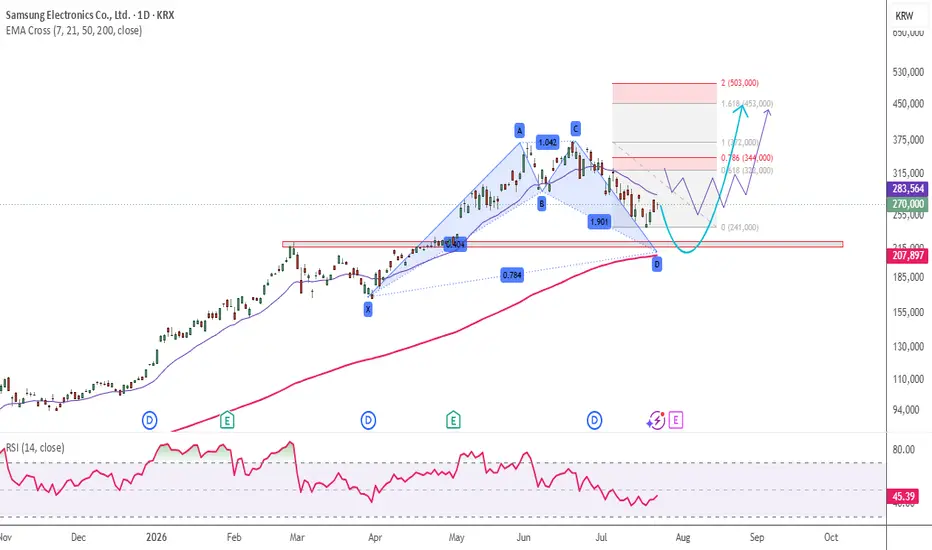
Samsung Electronics : Pullback Before the Next Rally ?KRX:005930 Daily Chart
📈 Key Decision Zone Ahead: Pullback Before the Next Rally? 👀
The stock has staged an impressive recovery after rebounding from the 0.55 Fibonacci retracement zone, confirming strong buying interest from a major technical support area.
However, the next challenge has arrived.
🔍 Technical Outlook
Price is now testing the Daily 20 EMA, which is acting as an immediate resistance level.
A decisive breakout above this dynamic resistance would strengthen the short-term bullish structure, while rejection could trigger a healthy pullback before the next directional move.
⚠️ Watch the Confluence Support
If sellers regain control at the Daily 20 EMA, the stock could retrace toward a high-confluence support zone where multiple technical factors align:
📍 0.786 Fibonacci Retracement
📍 Daily 200 EMA
This confluence creates a potential high-probability demand zone, where buyers may look to re-enter and defend the broader uptrend.
🎯 The Make-or-Break Zone
The 322k–344k price range will be the most important area to monitor in the coming sessions.
This zone is likely to determine the stock's next major move:
✅ Bullish Scenario: A sustained breakout above 344k could confirm renewed momentum and pave the way for a rally toward new all-time highs.
⚠️ Bearish Scenario: Failure to reclaim this resistance may lead to a deeper correction before the broader uptrend resumes.
📊 My View
The longer-term trend remains constructive, but price is approaching a critical technical decision point.
Rather than chasing the current move, I would prefer to watch how price reacts around the Daily 20 EMA and, if needed, the 0.786 Fibonacci + Daily 200 EMA confluence.
Patience here may offer a better risk-to-reward opportunity for the next swing.
Will buyers reclaim control and drive the stock to fresh all-time highs, or is one more correction needed before the next breakout? Share your thoughts below! 👇
🔖 Hashtags
#KOSPI #KoreaStockMarket #KRX #SamsungElectronics #SKHynix #Semiconductor #TechnicalAnalysis #TradingView #PriceAction #MarketStructure #DoubleBottom #EMA20 #EMA200 #Fibonacci #ReverseFibonacci #Breakout #BullTrap #SupportAndResistance #SwingTrading #TrendFollowing #MarketAnalysis #StockMarket #Investing #TradingIdeas #ChartAnalysis #MarketOutlook #WiSHFundManagement Long 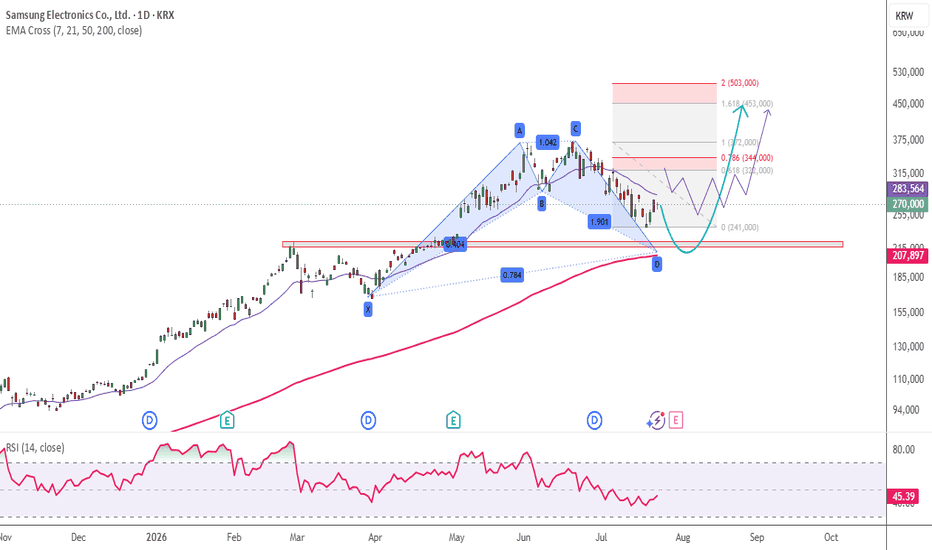
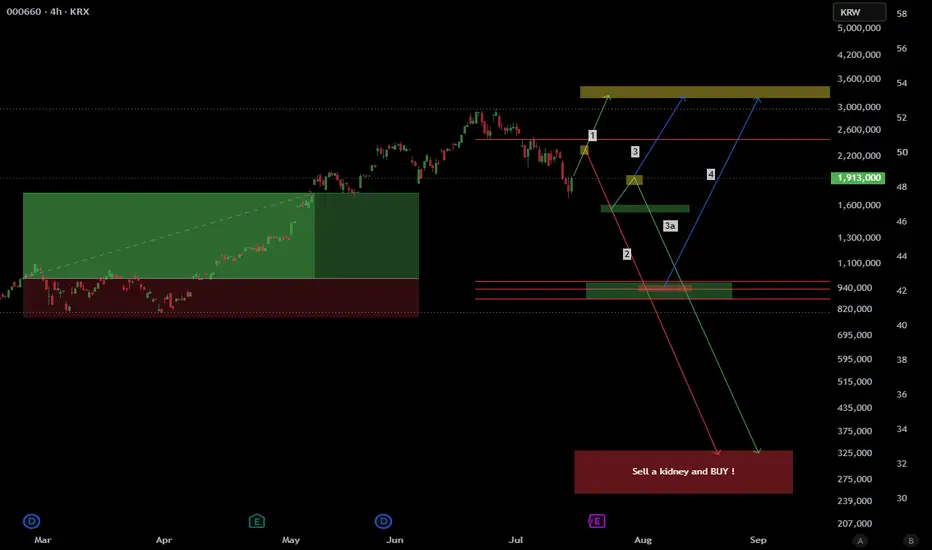
$000660 SK Hynix , IdeaThe rally that carried this chart for months finally cracked. Structure broke to the downside, price is trading below the level that used to hold everything up, and the map ahead has rarely been this clearly drawn.
Above, two things matter: a fresh supply zone left behind by the breakdown, and higher still, the weak high, untouched and holding the liquidity every uptrend eventually wants back. Below, a stacked demand cluster where the last major accumulation lives. And far beneath that, a zone we labeled honestly, because if price ever visits it, subtlety will not be required.
The paths:
Path 1: Buyers waste no time. The broken level gets reclaimed, supply above fails, and price runs directly at the weak high. The V-shaped answer, and the one that would embarrass the most people.
Path 2: No reclaim, no bounce, no mercy. Sellers press straight through every shelf on the chart and price freefalls toward the deep discount zone. The full unwind.
Path 3: The middle road. A relief bounce into the supply left by the breakdown, rejection at the scene of the crime, then a controlled descent into the demand cluster, where buyers get their audition. If they pass, the weak high is the prize.
Path 3a: Same rejection, worse outcome. Demand gets tested and fails, and the chart resolves into the zone at the bottom. The kidney scenario.
Path 4: Demand holds on the first touch, the base takes longer to build, but the destination is the same, the liquidity above the weak high gets collected on a delay.
Five roads, two destinations. The reaction at supply tells you which half of the chart is in play, and the reaction at demand tells you everything else.
EQC follows the reaction.
Hidden in plain sight. EQC.
Like, Follow, Boost, Join, Thank You!
Financial Disclaimer: This post is not financial advice. I am not your financial advisor, your crypto influencer, or your emergency hotline when volatility discovers your stop loss. Always do your own research and never trade solely because colorful arrows suggest a brighter future. Long 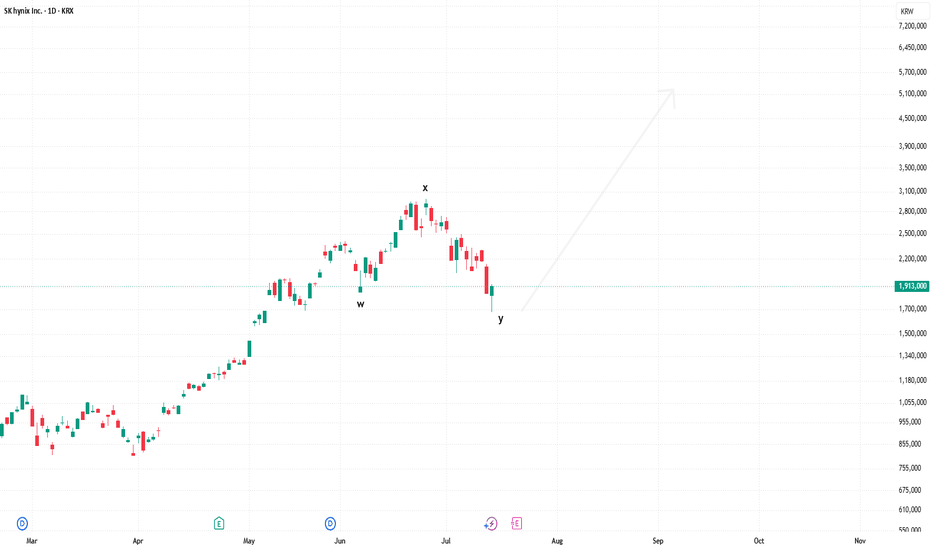
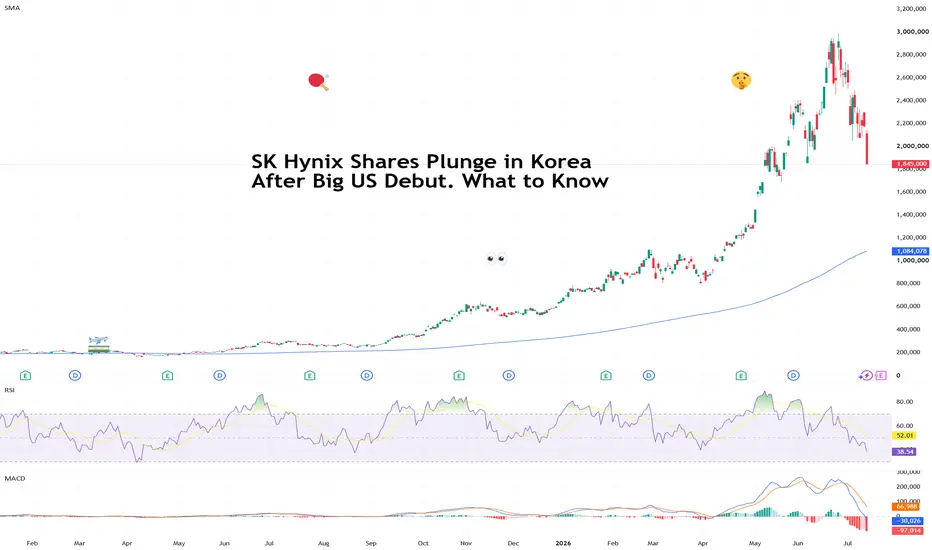
SK Hynix Shares Plunge in Korea After Big US Debut. What to KnowA Wall Street celebration turns into a Seoul hangover
Sometimes the same party looks very different depending on which side of the Pacific you're standing.
SK Hynix's KRX:000660 long-awaited US market debut was met with cheers on Friday, with its American shares climbing 13% after the company's blockbuster $26.5 billion offering.
By Monday morning in Seoul, however, the mood had flipped. Shares of the South Korean memory-chip giant tumbled more than 15% , the worst single-day showing in its history, dragging the benchmark Kospi KRX:KOSPI down more than 9% and even triggering a brief circuit-breaker halt — a temporary pause in trading designed to calm markets during unusually sharp moves.
The reversal puzzled traders. How could a successful US debut be followed by such a painful selloff at home? As it turns out, the answer has less to do with panic and more to do with market mechanics.
💰 Profit Taking Isn't Always Bad News
One of the biggest explanations is profit raking taking — a Wall Street term that simply means investors decide to cash in after a strong run.
And what a run it's been.
SK Hynix shares KRX:000660 have surged more than 25-fold since late 2022 as artificial intelligence transformed memory chips from a relatively sleepy business into one of the hottest corners of the semiconductor industry.
Just ask Micron NASDAQ:MU and Sandisk NASDAQ:SNDK , especially Sandisk .
Against this backdrop, Hynix has become one of Nvidia's NASDAQ:NVDA most important suppliers of high-bandwidth memory (HBM), the ultra-fast chips that help AI systems process enormous amounts of data.
After years of gains, a successful US listing gave many Korean investors a convenient moment to lock in profits. Others shifted their holdings into the newly listed American depositary receipts, creating additional selling pressure on the Seoul-listed shares.
📜 Wait... Was This an IPO?
Not really.
While many headlines compared the debut to an IPO, Hynix didn't go public in the United States because it was already a publicly traded company in South Korea.
Instead, it launched American Depositary Receipts (ADRs) under the ticker $NASDAQ:SKHYV (but that will change to NASDAQ:SKHY on Tuesday).
Think of an ADR as a wrapper that allows US investors to buy shares of a foreign company on an American exchange without purchasing the original stock overseas. A bank holds the underlying Korean shares and issues tradable receipts in the US.
An IPO, by contrast, is when a company sells shares to the public for the very first time. SK Hynix has been public for years — it simply opened another door for investors. Here’s a nice IPO calendar for reference.
🤖 AI's Favorite Memory Maker
The offering was closely watched because it tested two things at once: global appetite for overseas listings and investors' confidence that the AI boom still has legs.
Demand certainly showed up. The deal was reportedly more than seven times oversubscribed, even as some investors questioned whether AI-related valuations have climbed a little too far, too fast.
Hynix sits at the center of that story. Alongside larger rival Samsung Electronics KRX:005930 (down more than 10% on the day), it manufactures memory chips used in everything from smartphones to data centers.
As AI models grow better, faster, stronger, demand for faster memory has exploded, helping drive record profits across the industry.
⚖️ The Bigger Question
For all the excitement, investors are beginning to ask a familiar question: what happens when everyone builds more factories?
Hynix chief executive Kwak Noh-Jung believes memory shortages could persist well beyond 2030, suggesting demand will remain robust for years.
Still, expanding production has historically been a double-edged sword. Memory chips have long been a cyclical business, where periods of shortages eventually give way to oversupply, squeezing prices and profits.
That uncertainty has made Hynix one of Korea's most volatile stocks. Leveraged ETFs tracking the company have amplified market swings, contributing to an unusually high number of trading halts on the Kospi this year — seven times already, out of 13 since 2000.
With Hynix shares already down more than 30% from their June peak, the market seems to be in limbo on the proper price tag.
Off to you : What do you think of the AI craze? Overvalued or nah?
SAMSUNG -10% this WEEK, correction uinderway!Samsung is down more than 10% this week, while NASDAQ:SMH (VanEck Semiconductor ETF) is down 6%.
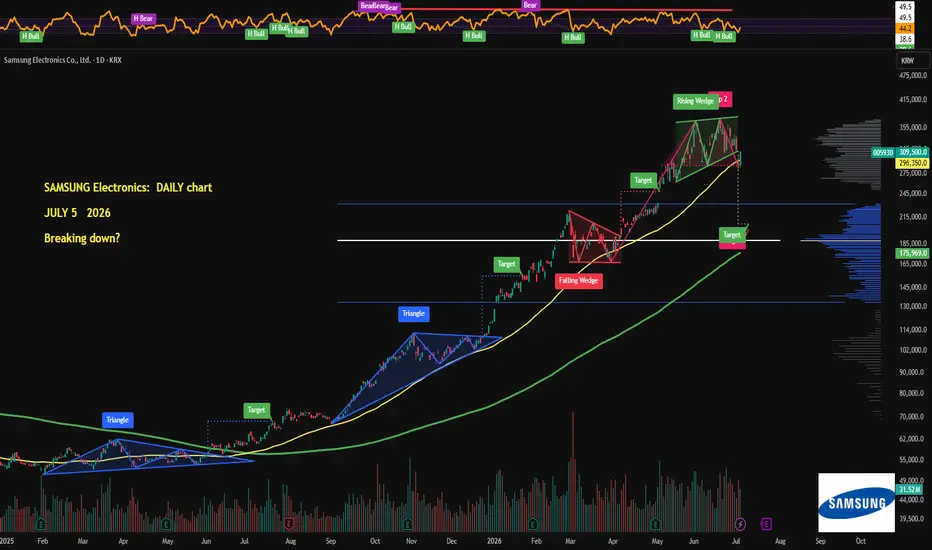
So those two nearly identical Rising Wedge breakdowns - one in Korea, one in the US, both in the semiconductor sector - probably weren't a coincidence. Looks more like the correction is underway.
The measured targets of both wedges are much lower, more than 23% below current prices. A relief bounce is likely soon, but I still don't see any strong reversal signals. For now, I'm treating both daily charts as probable early-stage downtrends.
On both assets, the lower timeframes have already shifted into downtrends without any bullish divergences, leaving plenty of room for further downside. At the moment, buying semiconductor stocks looks more like trying to catch falling knives.
But everyone has their own strategy. I'll wait for proper trend reversal signals first.
💙👽 SK Hynix Just Shocked Wall Street With a $28 Billion MoveSK Hynix is preparing for what could become the largest American Depositary Receipt (ADR) listing in history, targeting a raise of more than $28 billion on the Nasdaq
The offering would surpass Alibaba's roughly $22 billion U.S debut in 2014, with trading expected to begin around July 10 under the ticker SKHY. At first glance, it looks like a company raising capital to stay competitive.. In reality, SK Hynix is already operating from a position of exceptional strength. The company holds roughly $24 billion in net cash, has AI memory production sold out through 2028, and continues to post record earnings as demand for artificial intelligence infrastructure explodes
🧠 How SK Hynix Makes Money
SK Hynix is the world's second largest memory chip manufacturer and the global leader in High Bandwidth Memory (HBM), controlling an estimated 57% of the HBM market. The company generates most of its revenue from DRAM chips used in servers, AI accelerators, smartphones, and PCs, while NAND flash products contribute additional revenue from SSDs and storage devices
Its biggest growth engine today is HBM, the advanced memory stacked alongside AI GPUs from companies like Nvidia. As hyperscalers and AI developers race to build larger data centers, demand for HBM has far outpaced supply, allowing SK Hynix to lock in long term contracts, command premium pricing, and achieve record operating margins
📊 Q1 FY26 in Numbers
The financial results highlight why investors are paying close attention, ready ?
-Revenue reached another record high as AI related memory shipments continued to surge
-Operating profit expanded sharply thanks to higher HBM shipments and stronger DRAM pricing.
-The company maintained approximately $24 billion in net cash, giving it one of the strongest balance sheets in the semiconductor industry
-HBM production remains effectively sold out through 2028, providing unusual earnings visibility for a traditionally cyclical business
-Management continues investing aggressively while generating significant free cash flow, a rare combination during a semiconductor expansion cycle
🇺🇸 The US Listing
Unlike shares traded in Seoul, which are denominated in Korean won and less accessible to many U.S institutions, the Nasdaq ADR gives global investors an easier way to own the company
SK Hynix plans to issue approximately 178 million ADRs, representing about 2.5% of the company. Each Korean share converts into ten ADRs, implying a reference price of roughly $158 per ADR, with final pricing expected around July 10. The shares will trade on the Nasdaq Global Select Market under the ticker SKHY
Every dollar raised will fund long term capacity expansion rather than plugging balance sheet holes. Capital will be invested in
🏭 The Yongin Y1 mega fab for next gen DRAM and HBM production
📦 The Cheongju P&T7 advanced HBM packaging facility
🔬 Additional ASML EUV lithography systems needed for advanced memory manufacturing.
🇺🇸 A $4 billion advanced packaging facility in Indiana, expanding SK Hynix's U.S manufacturing footprint
Interestingly, the company originally explored raising around $10 billion before increasing the target to more than $28 billion, suggesting management's long term demand expectations have become substantially more optimistic
🇰🇷 What You're Paying
After a remarkable rally driven by AI enthusiasm, SK Hynix now trades near 7x forward earnings, roughly in line with Micron despite holding the industry's leading HBM position
The company recently surpassed Samsung Electronics to become South Korea's most valuable listed company, reflecting investors' belief that HBM will remain one of the most supply constrained segments of the semiconductor market
Unlike many AI related companies trading at premium multiples despite limited profitability, SK Hynix combines strong earnings growth, expanding margins, robust cash generation and a fortress balance sheet.. However, much of the AI optimism is already reflected in today's valuation, meaning future upside increasingly depends on execution rather than simple multiple expansion
⚔️ Competition & Risks
Despite its leadership position, SK Hynix still faces several important challenges
-Samsung Electronics is investing aggressively to regain HBM market share
-Micron** continues expanding production and has already secured key AI customers
-Memory remains a cyclical industry, and any slowdown in AI infrastructure spending could pressure pricing and margins
- Geopolitical tensions involving the US, China, Taiwan, and South Korea could disrupt semiconductor supply chains
-Massive capital spending always carries execution risk, particularly as fabs become increasingly expensive and technologically complex
While current demand appears exceptionally strong, semiconductor cycles have historically shifted quickly once supply catches up
🔭 What to Watch
Several developments will determine whether SK Hynix can justify its record breaking capital raise
-Final pricing and investor demand for the Nasdaq ADR
-Construction progress at the Yongin semiconductor cluster
-Ramp-up of the Indiana advanced packaging facility
-Future HBM supply agreements with Nvidia and other AI chip designers
-Whether AI infrastructure spending remains strong enough to keep HBM capacity fully booked beyond 2028
-Quarterly gross margins and free cash flow as new production comes online
SK Hynix's historic Nasdaq listing is less about raising emergency capital and more about cementing its position at the center of the AI revolution. Few companies attempt a record-breaking equity offering while sitting on billions in net cash and operating with years of sold-out production capacity. That confidence says as much about management's expectations for AI demand as it does about the business itself
The biggest question now isn't whether SK Hynix can build more factories..It's whether the AI boom will remain powerful enough to absorb all of that new capacity over the next decade
If today's demand proves sustainable, this record setting ADR could be remembered as the moment SK Hynix transformed from a Korean memory manufacturer into one of the semiconductor industry's most globally owned AI infrastructure companies.
Samsung Electronics vs $SMH: RISING WEDGES' breakdowns!
Samsung accounts for roughly 9% of AMEX:EEM , one of my main long-term portfolio positions, so I follow it closely. Unfortunately, the chart isn't looking great right now. After a roughly 600% rally over the past year and a series of record quarterly results, the daily chart looks quite close to confirming a larger correction.
On the weekly chart, every new high over the past few months has come with a bearish RSI divergence. The daily chart tells a similar story and is starting to resemble a distribution phase. There's a breakdown from a Rising Wedge, a failed attempt to reclaim the pattern, price has slipped below the yellow 50 SMA, and we've now printed the first lower low - at least if we count the wicks.
The key question now is whether price can make a higher high. If not, there's a good chance we're seeing a dead cat bounce before another leg lower. The green 200 MA is still bullish but sits much lower around 176K, while the measured breakdown target from the wedge comes in near 207K.
Samsung reports earnings in a few weeks. The last several quarters have all delivered record results and earnings beats, yet the chart is telling a different story. We'll see how the earnings and, more importantly, the guidance look. Will expectations be raised once again?
The same pattern is visible in NASDAQ:SMH (VanEck Semiconductor ETF). It has also broken down from a very similar Rising Wedge, accompanied by bearish RSI divergences. The main support is now the yellow 50 MA around $579.5.
In SMH's case, the distribution thesis is reinforced by the Elliott Wave structure and heavy selling volume.
So the chart of the Korean semiconductor giant looks remarkably similar to the chart of the leading U.S. semiconductor ETF. Add a strengthening TVC:DXY on top of that, and it's hard not to argue that the entire semiconductor sector may be entering a global distribution phase.
If we're indeed moving into a correction, it will probably last as long as the U.S. dollar remains strong. Naturally, Samsung is likely to feel that pressure even more than most U.S. semiconductor companies.
For now, it looks like better buying opportunities may appear over the coming months, in my opinion.
💙👽 Short 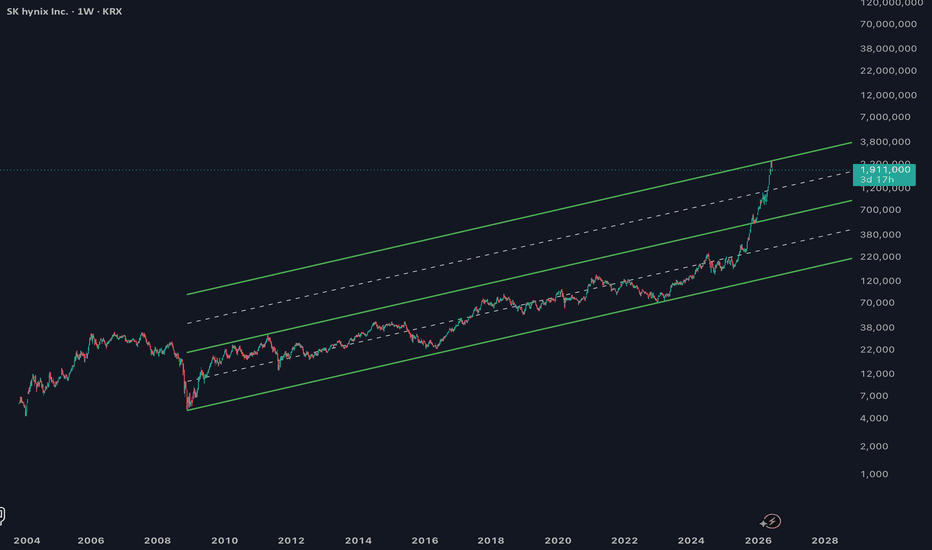
$Samsung 36 Analysts Say Buy. HBM Revenue to Triple!Samsung Electronics just posted the strongest quarter in its entire corporate history. 🏆 Operating profit surged 756% year over year to ₩57.2 trillion ($39 billion). 🤯
Revenue hit a record ₩133.9 trillion ($91 billion), up 69% year over year. The AI memory supercycle is real and Samsung is sitting right at the centre of it. 🔥
The weekly chart has pulled back into two clean demand zones. This is the entry. 📊
The chip division is doing all the heavy lifting. 💪 Device Solutions accounted for 94% of total operating profit in Q1 2026, with chip margins above 70%. 🚀
Samsung became the first company in the world to commence mass production and shipment of HBM4 in February 2026, supplying Nvidia's Vera Rubin AI platform ahead of every competitor. 🤖
HBM revenue is expected to more than triple in 2026 compared to 2025, with HBM4 sales expected to exceed 50% of total HBM revenue from Q3 onward. ⚡ HBM4E samples are being delivered to customers in Q2 2026, featuring bandwidth of up to 4.0 TB per second and pin speeds of 16 gigabits per second. 🔬
The supply demand picture is extraordinary. 🌍 Samsung's EVP of the memory business confirmed on the earnings call that the demand fulfilment rate is now at a record low. 📉
Customers concerned about supply shortages are already bringing forward their demand for 2027. South Korea's semiconductor exports surged 173.5% year over year to $31.9 billion in April 2026, marking a 13th consecutive monthly record. 💵
Samsung has signed multi year binding contracts with customers locking in supply and pricing as hyperscalers accelerate AI infrastructure builds. 🔒
The supply demand gap is expected to widen further in 2027. ⚠️
The foundry business is equally strong. 🏭
Samsung's foundries are running at full utilisation on advanced nodes in Q2 2026. 2nm customer adoption is expanding and 1.4nm development is on schedule. 📈
Q2 2026 revenue is expected to reach approximately ₩163.5 trillion, continuing the record run. Next earnings are due 29 July 2026. 📅
36 analysts have Buy ratings on the stock. 🐂
The consensus average price target is ₩403,209 KRW (~$290 USD). The high analyst target sits at ₩850,000 KRW (~$612 USD). The 52 week range spans from ₩56,900 KRW to ₩370,000 KRW. ✅
The weekly chart has pulled back from the 52 week high into two clean demand zones with Fibonacci confluence. 📊 Two entries. Two defined risk levels. One directional thesis. 🎯
🟢 Zone 1 (Upper Entry) ~ ₩303,500 (~$218) area (0.786 Fibonacci Weekly)
💰 Entry: ₩303,500 (~$218)
🛑 Stop: ₩290,000 (~$209) (4.448% below entry)
🎯 Target: ₩455,000 (~$328) (49.9% upside from entry)
📈 Risk/Reward Ratio: 11.22
🟢 Zone 2 (Lower Entry) ~ ₩217,900 (~$157) area (0.5 Fibonacci Weekly)
💰 Entry: ₩217,900 (~$157)
🛑 Stop: ₩203,500 (~$147) (6.221% below entry)
🎯 Target: ₩565,000 (~$407) (160.1% upside from entry)
📈 Risk/Reward Ratio: 25.74
📅 Next Earnings: 29 July 2026
🌍 52 Week Range: ₩56,900 to ₩370,000
💵 Consensus Target: ₩403,209 (~$290)
🏆 Q1 2026 Revenue: ₩133.9 trillion ($91 billion)
Record profits. 🏆 HBM4 first to market. 🤖 Supply sold out into 2027. 🔒 Two weekly zones. Let price come to the level and let the trade do the work. 🚀
⚠️ Not financial advice. Manage your risk. Long 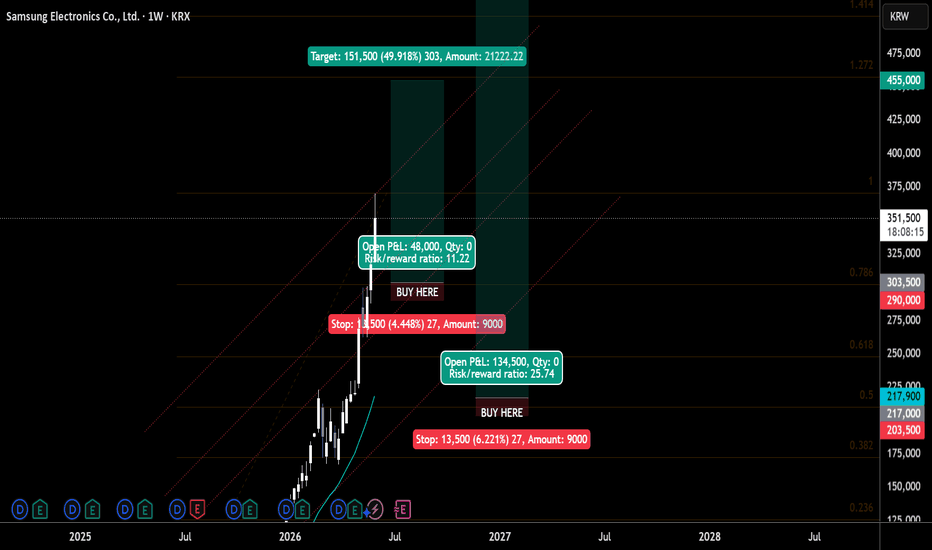
Short