Long
Long
 Long
Long
 Long
Long
 Long
Long
$CDR (CD Projekt): 1W - BUYZONE set around 200 weekly MAGPW:CDR (CD Projekt): Weekly Chart
I really don't feel like writing for the tenth time that this chart has looked weak for a long time. Trend is your friend, and on the weekly timeframe the trend remains bearish. Anyone is free to disagree, but the market tends to settle these arguments eventually.
Since the local top we've had the classic warning signs: lower highs, lower lows, a breakdown from a rising wedge, followed by multiple failed attempts by the bulls to regain control. For months now, the chart has behaved more like an asset going through a healthy correction after a major rally than a candidate for new all-time highs.
That's why I'm much more interested in what could happen lower.
For a long time I've had a buy zone marked around PLN 170-180. That's roughly another 20% below current levels. What's particularly interesting is that this area lines up almost perfectly with the 200-week moving average.
Charlie Munger once said:
"The big money is not in the buying and the selling, but in the waiting."
That's one of the reasons why this area catches my attention. Not because moving averages have some magical power, but because patience often gets rewarded where fear is at its highest.
Fundamentally, nothing has changed. I'm still most interested in the long-term story and next year's game releases, especially the new Witcher. The problem is that the market rarely rewards impatience. Much more often it rewards people who sit on their hands and wait for their price.
There is another interesting detail here.
The longer I look at this chart, the more I see the possibility of a giant cup-and-handle formation slowly developing. For now it's just a hypothesis, nothing more. But if price finds support around the 200WMA and starts rebuilding its structure ahead of future releases, this could become a very interesting setup over the next year or two.
For now, however, I see no reason to front-run the market.
There is also another factor that could potentially drain liquidity away from GPW:CDR : GTA VI. The release date is already set for next autumn. Personally, accumulating a position in NASDAQ:TTWO makes far more sense to me than waiting for a Witcher release sometime next year without a confirmed launch date.
Sometimes the best position is no position.
And patience remains, unfortunately, one of the most underrated indicators in technical analysis.
👽💙  Short
Short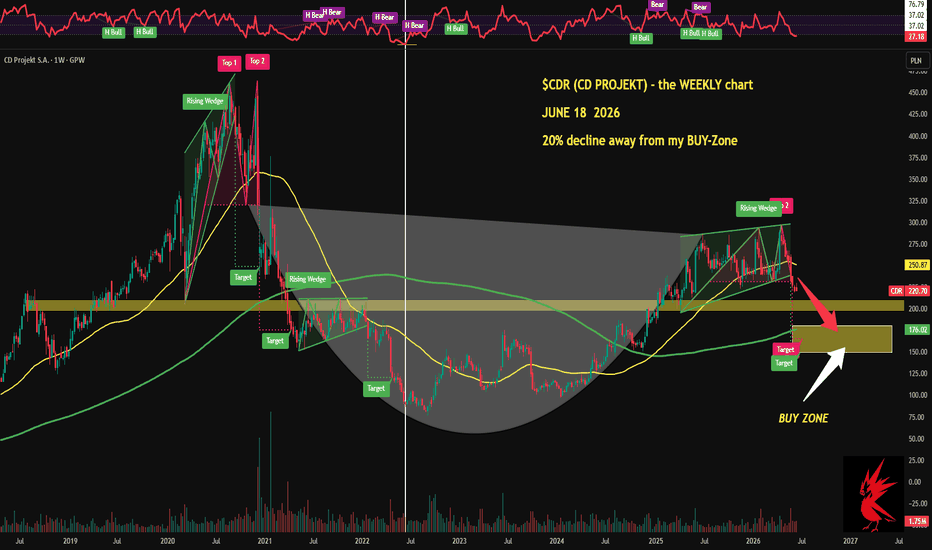
$CDR (CD Projekt): 1W - 20% away from my BUY ZONEDepends on your perspective, the weekly chart either looks terrible or very promising...
GPW:CDR (CD Projekt): 1W timeframe
For those holding, it's likely going to be a rough few months ahead, but I've written that many times already. Anyone who didn't sell when the charts were screaming that a top was forming is probably holding strong and waiting for next year's releases, mainly the new Witcher, but not only that.
The weekly chart is not only showing a double breakdown, it's now printing a lower low as well, making another 27% - 33% decline increasingly likely. Despite very strong financial results, that matters less right now because the entire gaming sector is struggling and needs fresh catalysts for growth. CD Projekt doesn't really have any for at least another six months, and that's simply too long in today's market. The bulls will come back, but likely only a few months before the major releases.
Before that, they'll probably return to NASDAQ:TTWO first, with the new #GTA arriving in just a few months. That should provide a strong impulse for the sector, and eventually GPW:CDR 's time will come as well. Ideally, I'd like to build a position in the gaming industry because a very attractive window is approaching.
If things play out the way I expect, the 150 - 180 price zone would be an ideal accumulation box, but patience will be required.
Alternatively, if it doesn't drop that low, I'll look for entries closer to the bottom, but first I want to see a proper washout and actual trend reversal signals.
2027 should be their year. Everything points in that direction, both the chart and the release schedule.
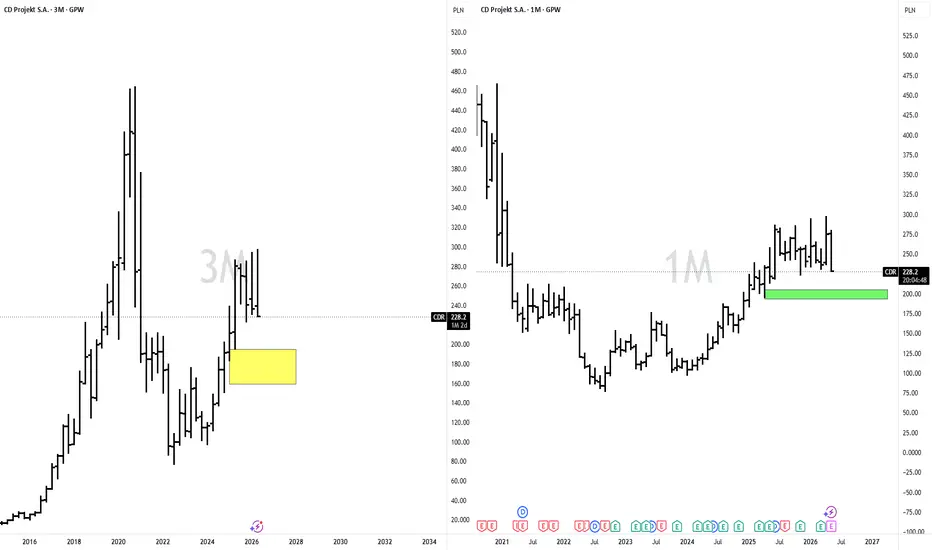
The biggest support zone sits between 200 and 210, and that's where I expect a battle. RSI at 28 is technically oversold, but at the June 2022 bottom RSI dropped below 10 - marked by the vertical line. So I'm not in a hurry. I don't own any shares and I'm still hoping for a bottom inside the yellow box.
💙👽  Long
Long
 Long
Long
Long 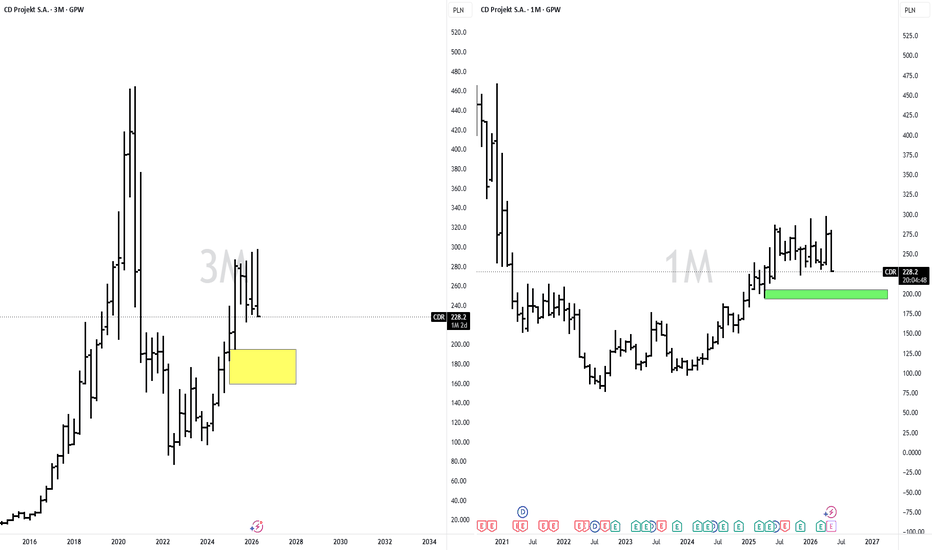
$CDR (CD PROJEKT) the WEEKLY chart - incoming COLLAPSE?CD Projekt - GPW:CDR
Saturday, so it’s time to breathe a little, and since I live and breathe trading, it’s hard to pull me away from charts and trying to do so may end in minor acts of microaggression towards the person attempting it.
So I’ll come back for a moment to my post from 2 weeks ago about the company behind iconic video game franchises like The Witcher or even Cyberpunk.
I’m attaching the screenshot from that post below the text for anyone interested, but the main point was that at a price of 286 PLN this looked like one giant red flag. I was mainly focused on the beautiful Rising Wedge and the already pretty overheated RSI.
The whole analysis back then took me maybe 3 minutes because I only looked at the weekly chart - and from an investor’s perspective, there’s no real point in constantly dropping down to lower timeframes anyway.
And somehow, miraculously, because technical analysis is supposedly just astrology, today the stock costs 10% less. And it could get much, much worse. Price inside a wedge, after rejecting from the ceiling, usually aims for the floor of the formation (around 237 PLN) and then...
It could get much worse because a downside breakdown gives a technical target around 150 PLN.
A lot of people probably think, yeah okay, these targets, where does this come from, why exactly, some kind of magic, the guy is drawing apocalyptic scenarios. Fine, then I suggest taking a very close look at the current weekly chart.
We have two wedge formations there, the covid one from 2020 and then the next one in 2021. Both of them, after breaking down, fully reached their technical targets, and then... Price went much lower anyway!
That covid rally which created that steep wedge, if I remember correctly, was happening because Cyberpunk was coming out (or maybe Witcher 3? Someone correct me, I don’t really know games) and of course amateurs massively piled into the stock even at 400 or 460 PLN.
That was a classic example of the final wave of growth from Elliott Wave Theory (marked with number 5), you can also call it the Excess Phase, or the final stage of stupidity, like at a wedding at 5 in the morning when people are finishing the last few “one for the road” shots like tomorrow doesn’t exist. But tomorrow is brutal. Would not recommend.
Now a bit more technical, because I know a lot of Poles own these shares, I see people’s portfolios that are 95% mindlessly put together.
So the key level, the last hard support, is the 253-254 area. On my weekly chart it’s the yellow 50 SMA curve, and on the daily chart it’s a confluence of the 50 SMA and the most important moving average of all, the 200 SMA. So this is a triple support zone of the main moving averages. If they fail, then the mentioned Rising Wedge will likely test its floor.
And if that breaks, I’ll risk making a post officially calling this a bear market.
Additionally, similarly to 2020, at the end of the wedge a Double Top is beginning to form, one of the stronger warning formations suggesting the uptrend has probably ended.
And finally, the bullish scenario is a breakout above the wedge, meaning we need a strong candle with volume that pushes the price above the 300+ PLN area.
PS. By now you probably know I’m obsessed with Gartleys and other harmonic patterns, for the TA enthusiasts or the curious, there’s a beautiful Gartley on the weekly chart from the 2022-2023 period, the same one I discussed yesterday on $CRWV. It dropped the price by 43%.
💙👽 Short 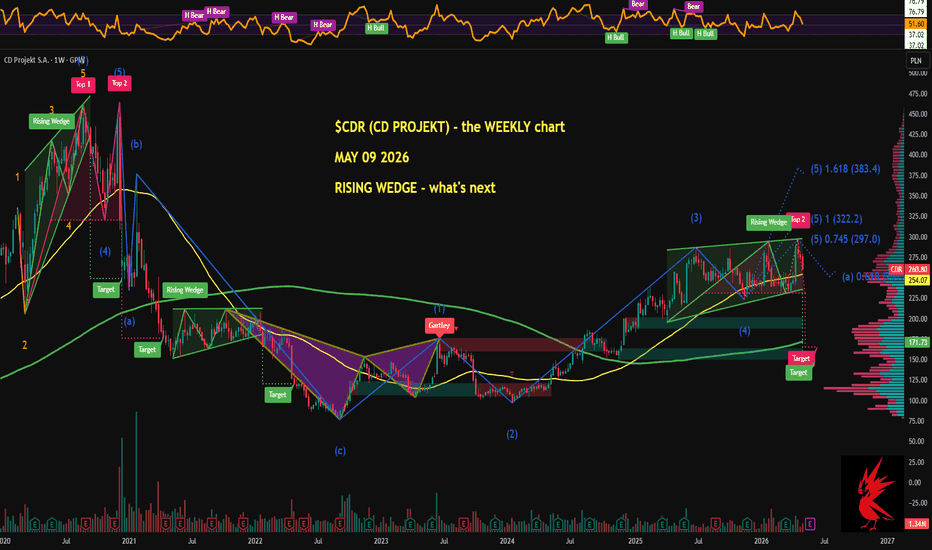
 Long
Long
 Long
Long
Candle Structure Clashes With Ichimoku As Recovery Takes Hold
Nike is printing a conflicted setup where candle patterns overwhelmingly favor bulls but trend indicators disagree. The 2.1x recovery bounce shows buyers are responding to the pullback, though the structural split demands caution before calling this a turn.
Price is at 232.75 after a -3.8% retrace with an 8.1% bounce at 2.1x expansion, reading as recovered. Price percentile and range data are unavailable on this exchange listing but the recovered regime confirms the bounce has more than doubled the retrace distance. This is a market where dip buyers have shown up with intent.
Bias is moderate bull at 64.3% with a 27:15 signal count out of 112. But the internal conflict is striking. Candles are almost unanimously bullish at 13:1, one of the most lopsided candle readings possible. Counter-trend signals also lean strongly bullish at 11:3. Yet Ichimoku reads 3:10 firmly bearish and EMAs are flat at 0:0 providing no trend confirmation. Spread strength is 28.6% in the moderate zone. Clarity is low at 38% reflecting this internal disagreement.
The candle versus Ichimoku split tells a clear story. Short-term price action through candle patterns is decisively bullish but the broader trend structure through Ichimoku cloud and equilibrium lines still reads bearish. This is typical of early-stage reversals where price is turning before the trend indicators have caught up. It can also signal a bear market rally that gets rejected once it reaches trend resistance.
No squeeze is active with bandwidth at 11.99% which is wide. Momentum is bullish and pointing upward. Squeeze momentum is expanding downward at 365.1% creating a divergence with the bullish momentum direction. The wide bandwidth means volatility is elevated and any move from here will have room to travel.
Volume is steady at -0.29 Z on just 3 contracts and 698.25 in dollar terms. This is a low-liquidity listing. Direction reads neutral with falling momentum at -0.18. Bull and bear Z scores are perfectly matched at -0.16 and -0.16. OBV at 0.17 shows mild inflow with normal divergence. No whale activity.
The low volume on this exchange listing means the signals should be interpreted with extra context from the primary listing. The mild OBV inflow is a positive but not decisive given the thin participation.
Scenario 1 (55%) — Bull recovery extends as the 13:1 candle dominance and 11:3 counter-trend advantage translate into trend structure improvement. Ichimoku lagging indicators begin to flatten and eventually cross bullish as price maintains the recovered regime. The 2.1x bounce establishes a higher low framework.
Scenario 2 (45%) — Ichimoku resistance at 3:10 proves correct and the candle strength is a bear market rally. If price fails to sustain above the bounce level and momentum fades, the 0:0 EMA reading could tip bearish rather than bullish. The wide bandwidth environment would amplify a rejection move.
Watch for EMAs to break the 0:0 deadlock in either direction as the tiebreaker signal. Ichimoku beginning to narrow from 3:10 would confirm the candle structure is leading. OBV maintaining inflow and volume Z improving above zero would add conviction to the recovery case.
Risk is moderate with low clarity. The 38% clarity score reflects the genuine structural disagreement. The candle conviction is impressive but trend indicators carry weight. Position for the recovery but size conservatively until the Ichimoku conflict resolves.
More analysis on my profile.
NIKE, NKE, Nike, retail, consumer, recovery, candles, equities  Long
Long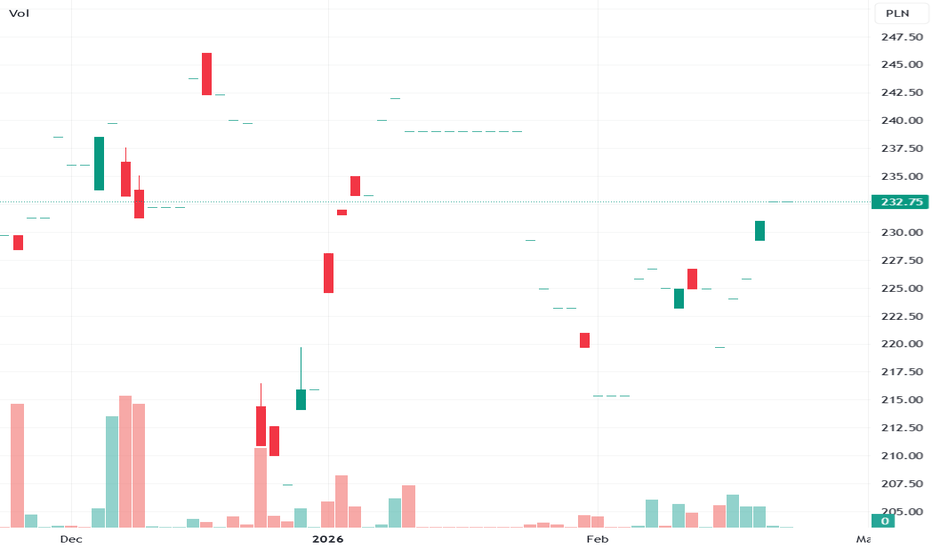
 Long
Long
5-0 Harmonic Pattern:🚫 Stop entering trades without understanding technical analysis.
Before you risk your money, learn how the market actually speaks.
✨ We’re here to teach you the knowledge that turns randomness into strategy.
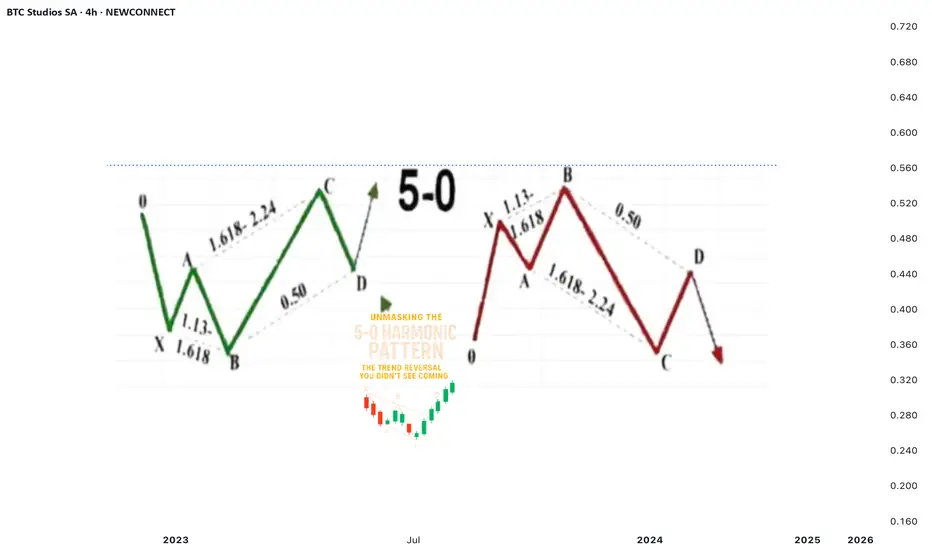
Unmasking the5-0 Harmonic Pattern:The Trend Reversal You Didn't See Coming**
Discovered by the visionary Scott Carney and unveiled in _Harmonic Trading, Volume Two_, the **5-0 pattern** isn't just another blip on a trader’s radar—it’s a siren of market reversal.
📈 **Why It Stands Out**
- Unlike the familiar Bat or Gartley structures, the 5-0 pattern is fueled by **precise Fibonacci ratios**, making its reversal zone deadly accurate.
- Centered around the pivotal **Point B**, this model doesn’t just hint at change—it defines it.
🌀 **The Anatomy of a Flip**
- Often marking the **first true pullback in a major trend reversal**, the 5-0 isn’t a lagging indicator—it’s your early warning system.
- The **AB leg?** That’s no ordinary wave—it’s usually the final gasp of a fading trend, setting the stage for powerful new momentum.
💥 **Bottom Line**
This isn’t just technical analysis—it’s strategic foresight. The 5-0 pattern reveals where the market **hesitates... and where you strike**.
---
_"To truly learn, we must see it in action.
So let’s pull back the curtain and share a powerful example from our **past insurance market trades**—a deal that blended precision, timing, and strategy.
In comments  Education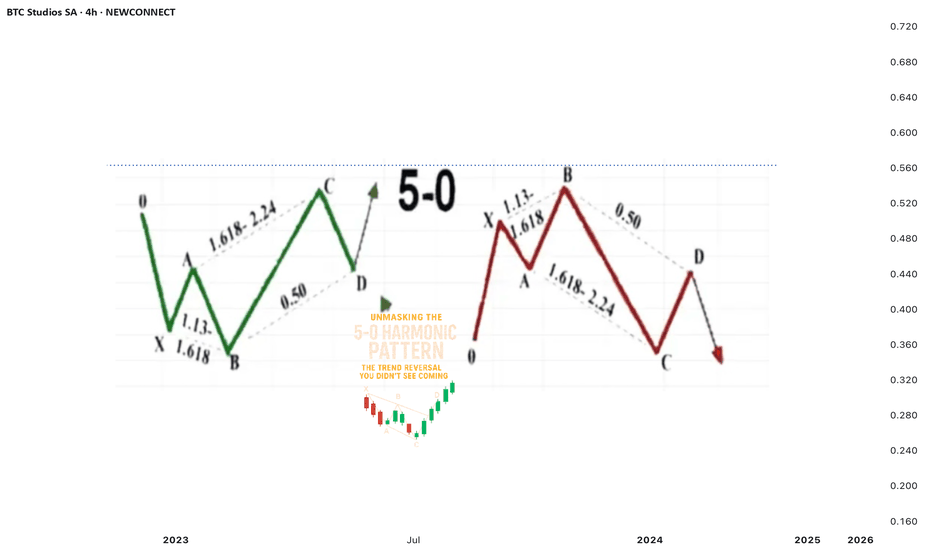
 Long
Long
 Long
Long
 Long
Long
Long 
 Long
Long