Indicateur

Volumetric Gann StyleVolumetric Gann Style
Overview
Volumetric Gann Style is a rule-based chart visualization tool built around a pivot-anchored Gann structure.
The script organizes its calculations around confirmed structural pivots, then renders a multi-layered Gann framework that can include fan geometry, box/grid structure, heat-zone visualization, volumetric pressure mapping, Square of 9 references, contextual labels, and a structure-based signal layer.
This indicator is designed for visual, structural, and educational analysis.
It is not a financial advisory tool.
It does not provide investment advice.
It does not generate standalone buy or sell recommendations.
It does not guarantee future outcomes, profitability, or market direction.
Any labels, breaks, reclaims, rejections, or alert conditions displayed by the script are derived from predefined structural rules inside the indicator. They should be treated as contextual chart events, not as direct trade instructions.
Image 1 — Full System Overview
Complete chart view showing the main Gann structure, volumetric visual layers, and the overall architecture of the script.
Core Architecture
The script is built around a pivot-based anchor engine.
Confirmed pivots are used to define the active structural framework, and the rendered Gann geometry updates according to that anchor logic. The goal is not to forecast future price behavior, but to display how price interacts with a structured Gann environment derived from chart data.
This framework allows the indicator to maintain a coherent visual relationship between:
anchor points,
fan projections,
box/grid levels,
pressure zones,
volumetric structure blocks,
and structural event labels.
The output is therefore intended as a chart-structure visualization system, not a predictive model.
Image 2 — Pivot Anchor + Fan Structure
Example of how the active anchor logic defines the current fan environment and the main structural framework.
Two Display Engines
Volumetric Gann Style includes two distinct display modes:
1) Volumetric Gann Style
This mode emphasizes the custom visual architecture of the script and its volumetric presentation logic.
Depending on the active settings, it can display:
structured level boxes,
internal pressure segmentation,
volumetric buy/sell pressure presentation inside the active range,
heat-zone logic,
right-side informational elements,
and a denser structural overlay.
This mode is designed to make structural pressure easier to read visually by combining Gann geometry with volumetric distribution concepts inside the displayed framework.
Image 3 — Volumetric Gann Style Mode
The custom volumetric mode with structured boxes, internal pressure layout, and denser visual context.
2) Classic Gann
This mode presents a cleaner and more traditional Gann-style visual framework.
It focuses more directly on the geometric side of the structure while preserving the same underlying anchor logic.
These two modes are alternative visual interpretations of the same structural engine. They are not separate trading systems and they do not represent separate market predictions.
Image 4 — Classic Gann Mode
A cleaner geometric presentation using the same anchor engine and structural logic.
Gann Fan Structure
The indicator can project a Gann fan from the active pivot structure and display its internal angle framework visually on the chart.
The fan is used here as a structural reference layer. It helps users observe how price moves relative to the active angular framework and how that framework evolves when anchor conditions change.
The fan display is a visualization component.
It does not predict direction, define future targets, or produce guaranteed signal quality.
Image 5 — Gann Fan Structure
Visual example of the active fan and its angle relationships inside the current framework.
Gann Box / Grid Structure
The script can also build a Gann box-style environment around the active structure.
This box/grid component is used to visualize:
structural expansion,
internal level relationships,
horizontal and vertical reference alignment,
and interaction areas inside the active framework.
In Volumetric Gann Style mode, this same structural area can also host pressure-oriented visual blocks, allowing the framework to communicate not only geometry, but also internal volumetric balance in a more readable way.
This creates a more readable structural field for observing how price behaves inside the current anchor-defined range.
The box and grid are analytical chart objects only. They are not standalone trade setups, not future projections, and not investment recommendations.
Image 6 — Gann Box / Grid Layout
Structural box and grid presentation around the active range.
Heat Zone and Volumetric Volume Logic
One of the defining visual layers of this script is its volume-oriented display logic.
Depending on the selected mode and settings, the indicator can render:
heat-style emphasis zones,
internal buy/sell volume boxes,
volumetric range-based structure blocks,
total volume information,
level and price information,
and contextual structure mapping inside the active framework.
These elements are intended to make internal structure easier to observe visually.
They do not claim order flow certainty, execution quality, or predictive edge.
They should be interpreted as part of the script’s visual framework rather than as direct trading commands.
Image 7 — Heat Zone and Volumetric Pressure
Example of heat-style emphasis and volumetric pressure distribution inside the active structure.
Signal Engine
The script includes a structural signal layer that can mark events such as:
break-type conditions,
reclaim behavior,
rejection behavior,
and aggressive structural reactions.
These events are generated from predefined internal conditions tied to the active Gann structure.
Important:
These labels are not standalone buy/sell calls.
They are not personalized advice.
They do not replace independent analysis, testing, or risk management.
They are best understood as structure-based chart annotations that highlight how price is behaving relative to the indicator’s active framework.
Image 8 — Signal Layer / Structural Events
Break, reclaim, rejection, or reaction-style labels shown as contextual chart annotations.
Square of 9
The indicator also includes Square of 9 style reference plotting.
This module is used as an additional structural reference layer and can help users visually compare chart behavior against the script’s projected Gann-style numerical framework.
As with the rest of the indicator, this component is informational and visual in nature. It does not imply certainty, future target precision, or directional guarantees.
Image 9 — Square of 9
Additional Gann-style numerical reference structure plotted on the chart.
Trend Score / Panel / Labels
The script may display summary panels, state labels, or trend-score style information derived from its internal logic.
These visual summaries are intended to improve chart readability and to present the current structural state in a more organized way.
They should be treated as descriptive outputs of the indicator’s rule set, not as guaranteed market conclusions.
Image 10 — Trend Panel / Labels
Panel-based summaries and contextual label outputs derived from the current structure.
How to Use
This indicator is best used as a structural chart companion.
Typical use may include:
observing pivot-defined Gann structure,
comparing price position against fan and box geometry,
monitoring volumetric pressure zones and contextual labels,
reviewing structural events on the chart,
and combining the visualization with the user’s own broader analysis process.
It should not be used as a substitute for independent judgment.
What This Script Does
Displays a pivot-anchored Gann framework on the chart
Supports both Volumetric Gann Style and Classic Gann display modes
Visualizes fan, box/grid, heat-zone logic, volumetric pressure structure, and contextual chart behavior
Includes optional structural event labeling
Adds Square of 9 and panel-based context elements
Organizes chart information into a rule-based visual framework
What This Script Does Not Do
Does not provide financial or investment advice
Does not generate standalone buy or sell recommendations
Does not guarantee profitable outcomes
Does not predict future market direction with certainty
Does not replace independent analysis, testing, or risk management
Disclaimer
This script is provided for informational, analytical, and educational purposes only.
All calculations are based on chart data and predefined internal rules. Market behavior can vary, and no visual element in this script should be interpreted as a guarantee, promise, or financial recommendation.
All trading and investment decisions remain solely the responsibility of the user. Indicateur

Indicateur

Indicateur
Doji Volume Map (Zeiierman)█ Overview
Doji Volume Map (Zeiierman) is a volume reaction scanner that detects doji-like candles appearing with relatively high and rising volume, then converts those events into projected price levels. When a valid signal forms, the script places a bubble on the candle, extends a horizontal reaction level forward, and optionally merges nearby levels into a highlighted zone box. The result is a clean map of potential reaction areas built from high-interest doji events rather than generic swing highs or lows.
⚪ What It Detects
The script searches for candles that combine 3 conditions at the same time:
Relative high volume: Current volume must exceed the average volume by a user-defined multiplier.
Rising volume: Current volume must be greater than the previous bar’s volume.
Loose doji structure: The candle body must remain small relative to the total range, while the full range must still be meaningful enough relative to ATR.
When those conditions align, the candle is treated as a significant reaction point and plotted as a bubble. From there, the script projects the price level forward and can combine overlapping levels into broader zones.
█ How It Works
For each bar inside the Lookback Length, the script checks whether the candle qualifies as a valid signal.
It measures:
Average volume over the selected Volume Average Length
Relative volume strength using the Relative Volume Multiplier
Whether volume is increasing vs the previous bar
Whether the candle body is small enough to be considered doji-like
Whether the total range is large enough relative to ATR
█ How to Use
When a doji-like candle forms with high and rising volume, it signals strong participation but no clear directional control.
This means:
Heavy trading occurred.
Both sides were active.
Price failed to move decisively.
These areas often become key reaction zones, as the market tends to revisit and respond to where significant transactions took place.
⚪ In Trend
In uptrends , signals on pullbacks can act as support/continuation zones
In downtrends, signals on bounces can act as resistance/rejection zones
Focus on using levels in the direction of the trend, where the dominant side is likely to defend.
⚪ In Ranges
Signals near range lows → potential buy/support zones
Signals near range highs → potential sell/resistance zones
Merged zones are especially useful for identifying rotation areas within the range.
⚪ Key Idea
High volume + indecision = high-interest price area
These zones often lead to:
Reactions
Rejections
Or continuation after confirmation
Use retests and price behavior at these levels to guide entries.
█ Settings
Lookback Length — how many bars back the script scans for qualifying signals.
Volume Average Length — baseline used to measure relative volume.
Relative Volume Multiplier — minimum volume expansion required vs average.
Max Body % of Range — defines how small the candle body must be to count as doji-like.
Min Candle Range as ATR Fraction — filters out candles that are too small to matter.
Key effect:
Higher Relative Volume Multiplier = fewer but stronger signals
Lower Max Body % of Range = stricter doji selection
Higher Min Candle Range as ATR Fraction = fewer weak micro-signals
Merge Close Levels Into Box — combines nearby projected levels into a single zone.
Merge Distance (ATR) — controls how close levels must be to merge.
-----------------
Disclaimer
The content provided in my scripts, indicators, ideas, algorithms, and systems is for educational and informational purposes only. It does not constitute financial advice, investment recommendations, or a solicitation to buy or sell any financial instruments. I will not accept liability for any loss or damage, including without limitation any loss of profit, which may arise directly or indirectly from the use of or reliance on such information.
All investments involve risk, and the past performance of a security, industry, sector, market, financial product, trading strategy, backtest, or individual's trading does not guarantee future results or returns. Investors are fully responsible for any investment decisions they make. Such decisions should be based solely on an evaluation of their financial circumstances, investment objectives, risk tolerance, and liquidity needs.
Indicateur

Round Number Levels Pro v3 [Turza]Round Number Levels Pro v3 is an upgraded version of my previous version.
Its a powerful support and resistance indicator that automatically plots psychological price levels on your chart.
What's New in v3:
Auto-Rounding by Symbol — automatically detects your instrument (Forex, Crypto, Indices, Commodities) and applies the correct rounding value
8 customizable symbol presets — set your own rounding values for any symbol group
Default rounding fallback for unlisted symbols
What it does:
Displays major round number levels with prominent lines
Shows mid-level lines for additional reference points
All lines extend across the entire chart for maximum visibility
Automatically adjusts levels based on current price action
Key Features:
Auto Symbol Detection — no manual switching between instruments
Customizable Font Sizes — large text for main levels, smaller for mid-levels
Flexible Line Styles — solid, dashed, or dotted for main and mid lines
Adjustable Parameters — control number of levels, rounding increments, and label positioning
Full Chart Extension — lines extend both directions for complete price reference
Perfect for:
Day traders looking for key psychological support/resistance levels
Swing traders identifying major price zones
Multi-instrument traders who switch between Forex, Crypto, and Indices
How to use:
Add to your chart and the indicator will automatically detect your symbol and apply the correct rounding. Customize the presets in settings to match your instruments and trading style. Indicateur

Indicateur

ICT Consequent Encroachment Map [EmpArchitect]█ OVERVIEW
The ICT Consequent Encroachment Map automatically detects every qualifying Fair Value Gap and draws the exact 50% midpoint — the Consequent Encroachment level — where institutions statistically rebalance price. No manual measurement needed. The indicator tracks CE levels in real time, monitors for price reactions, and removes zones when fully mitigated.
Consequent Encroachment is one of ICT's most referenced concepts yet has zero standalone indicators on TradingView. Every other implementation buries CE as a sub-toggle inside bloated all-in-one tools. This indicator does one thing and does it properly.
This is a structure analysis tool. It does not suggest entries, stop losses, or take profits. It shows you where the 50% rebalance sits — you decide what to do with that information.
█ HOW IT WORKS
The indicator scans for Fair Value Gaps using the standard 3-candle pattern. A bullish FVG forms when the current candle's low is higher than the candle two bars ago's high — creating a gap. A bearish FVG forms in the opposite direction.
For each qualifying FVG (filtered by minimum ATR size), the indicator calculates the exact 50% midpoint and draws a CE line at that price. The FVG zone is drawn as a subtle box behind price. Both extend forward bar by bar until the zone is mitigated or expires.
Price reactions at CE levels are tracked automatically. When price touches the CE line and closes back on the correct side, a diamond marker appears and the CE line thickens — confirming institutional rebalancing activity.
Full mitigation occurs when price closes beyond the FVG boundary. The zone and CE line are deleted entirely — no ghost levels cluttering your chart.
█ FEATURES
— Automatic FVG detection with ATR-based minimum size filter
— CE line drawn at exact 50% of every qualifying FVG
— FVG zone boxes with subtle teal/amber fill
— Real-time reaction tracking (counted once per zone — no double counting)
— Full mitigation removes zone and line completely
— Age-based expiry for zones that are never tested
— Dashboard showing active bull/bear CE counts, reactions today, and historical reaction rate
— Configurable zone limits, age limits, and visual style
— Alert conditions for new FVGs and CE reactions
█ DASHBOARD
The top-right panel displays:
— Bull CE Active: number of unmitigated bullish CE levels
— Bear CE Active: number of unmitigated bearish CE levels
— Reactions Today: CE touches in current session
— React Rate: historical percentage of CE levels that produced a reaction before mitigation
█ SETTINGS
Detection: Min FVG Size (ATR multiplier, default 1.0), Max Active CE Levels (default 15), Max Zone Age in bars (default 150)
Visual: Bullish/bearish colors (amber/teal), CE line style (solid/dashed/dotted), FVG box toggle
Dashboard: Toggle on/off
█ HOW TO USE
CE levels are where institutions expect price to rebalance before continuing the move. A bullish FVG with a CE at 1.1520 means the 50% fill point is 1.1520 — if price pulls back to that level and reacts, institutions are defending the imbalance.
Watch for the diamond reaction markers — these confirm that price respected the CE level. A CE that reacts is stronger than one that has never been tested.
Combine with displacement analysis and structure (BOS/CHoCH) for higher-probability reads. A CE reaction inside a tested order block during a kill zone is a high-confluence scenario.
█ NOTES
— Works on all instruments and timeframes
— Best on 5M-1H for intraday CE reactions
— Adjust ATR filter: lower for forex (0.5-1.0), higher for crypto (1.0-2.0)
— Pine Script v6, open-source
— Built by @EmpArchitect Indicateur

SMC Structure Engine [EmpArchitect]█ OVERVIEW
The SMC Structure Engine automatically maps institutional price structure in real time — no manual drawing needed. It detects Break of Structure (BOS), Change of Character (CHoCH), Order Blocks with full lifecycle tracking, and Liquidity Sweeps. Every element updates live as new bars form.
This is a structure analysis tool. It does not suggest entries, stop losses, or take profits. Both scenarios always exist — the engine highlights the structure, you interpret the context.
█ ZONE LIFECYCLE SYSTEM
Order Blocks transition through three visual states:
Active — Solid border, full color. Price has not yet returned to the zone. These are untested institutional levels.
Tested — Orange outline. Price entered the zone but was rejected — institutions defended the level. Tested zones are stronger than fresh zones because they show confirmed interest.
Mitigated — Gray, dotted border. Price closed through the zone — the institutional order was filled. Zone stops extending and is removed from tracking.
Age-based fading makes newer zones visually prominent while older zones gradually become transparent. The chart stays clean without manual cleanup.
█ EDUCATION MODE
Toggle Education Mode to see detailed tooltips on every label. Hover over any CHoCH, BOS, Order Block, or Sweep marker to read what it means and what to look for next. Toggle off for a clean minimal trading view.
█ FEATURES
— BOS detection with solid lines connecting swing point to break candle
— CHoCH detection with dashed lines signaling potential regime shifts
— Order Block zones with volume-filtered detection and ATR minimum sizing
— Three-state lifecycle: Active → Tested → Mitigated
— Liquidity Sweep markers with volume confirmation and candle coloring
— Regime background shading (ultra-subtle teal or amber tint)
— Dashboard: regime, last structure event, active/tested OB counts, swing levels
— Education Mode with hover tooltips explaining every concept
— Age-based zone fading for automatic clutter management
— Configurable max active zones (default 5)
█ SETTINGS
Detection: Swing Length, Order Block Lookback
Filters: ATR Period, ATR Box Min Multiplier, Volume Spike Multiplier
Display: Education Mode, CHoCH/BOS/OB/Sweep toggles, Dashboard toggle
Zones: Max Active OBs, Max Bars Forward, Age-Based Fading
Colors: Full amber/teal palette — all colors customizable
█ HOW TO USE
Watch the zone lifecycle: an Active order block that transitions to Tested (orange outline) means institutions defended the level. Tested zones carry more weight than untested ones.
Use the regime indicator and background shading to maintain directional awareness. BOS confirms continuation. CHoCH warns of potential reversal.
Enable Education Mode when learning. Disable it for live trading.
█ NOTES
— Works on all instruments and timeframes
— Best on 15M-4H for intraday, Daily-Weekly for swing
— Pine Script v6, open-source
— Built by @EmpArchitect Indicateur

Indicateur

Indicateur

Smart Liquidity Map [EmpArchitect]What It Does
Smart Liquidity Map detects equal highs (EQH) and equal lows (EQL) — areas where price has formed matching levels on consecutive bars — and tracks them as live liquidity zones. These zones represent resting stop-losses and pending orders that larger participants often target before continuing a move.
The indicator also plots Previous Day High/Low (PDH/PDL) and Previous Week High/Low (PWH/PWL) as key structural reference levels, and detects when price sweeps through any of these levels — EQH, EQL, PDH, PDL, PWH, or PWL — then closes back inside. Sweep events are marked with ⚡ labels directly on the chart for easy historical scanning.
Everything is displayed in a clean overlay with a live dashboard showing active zone counts, daily sweep count, and current level values.
How It Works
EQH/EQL Detection uses an adaptive tolerance based on a smoothed average of bar-to-bar volatility. When two consecutive bars print highs (or lows) within this tolerance window, the indicator marks the level and draws a shaded zone between the wick extreme and the body extreme. The tolerance auto-adjusts to whatever instrument and timeframe you're on — no manual tuning needed for crypto vs forex vs equities.
An optional RSI filter limits detection to structurally relevant areas: equal highs are only marked when RSI shows overbought tendency, and equal lows when RSI shows oversold tendency. This reduces noise in ranging conditions. Both the filter toggle and strength are adjustable.
Zone Lifecycle:
Zones extend forward bar-by-bar until one of three things happens:
Mitigation — price closes beyond the level (body mode) or touches it (wick mode). Zone is removed.
Sweep — price wicks beyond the level but closes back inside. Zone turns gray, a ⚡ marker is placed on the bar, and the bar is colored. This is the key event — liquidity was taken.
Expiry — zone survives past the configurable bar limit and is cleaned up.
PDH/PDL/PWH/PWL are drawn as horizontal reference lines anchored to the previous session's actual high/low. Dashed lines for daily levels, solid for weekly. Labels appear at the right edge. These levels update with each new session and move properly with the chart when you scroll or zoom.
Key Level Sweep Detection follows the same logic — if price wicks above PDH but closes below it, the bar is colored and a ⚡PDH label marks the event. Same for PDL, PWH, and PWL.
How To Read It
Amber zones (EQH) — liquidity sitting above price. Resting buy stops and breakout entries.
Teal zones (EQL) — liquidity sitting below price. Resting sell stops.
⚡ markers — confirmed sweep events. Price reached through a level and closed back inside.
Bar coloring — amber = bearish sweep (liquidity taken above), teal = bullish sweep (liquidity taken below).
Gray zones — swept and no longer active. Kept on chart as historical record.
Dashboard (top-right) — active EQH/EQL count, sweeps today, and current PDH/PDL/PWH/PWL values.
Both bullish and bearish outcomes are always possible at any level. A sweep above an EQH zone can lead to a reversal, or it can fail and price continues higher. The indicator shows where liquidity sits and when it gets taken — interpretation depends on surrounding structure and confluence.
Settings
Detection:
Equal Level Tolerance — sensitivity for matching consecutive highs/lows. Lower = stricter, fewer zones.
Filter by RSI / RSI Filter Strength — toggle and tune the overbought/oversold filter.
Zone Expiry — maximum bars a zone survives before auto-removal.
Sweep Type — body (close must break) or wick (any touch counts).
Levels:
Show PDH/PDL / Show PWH/PWL — toggle daily and weekly reference levels.
Level Line Lookback — how far back the level lines extend on chart.
Visual:
Fully customizable colors for bullish, bearish, and swept zones.
Toggle sweep ⚡ labels on/off.
Best Used On
Works on any instrument and timeframe. Designed for intraday and swing analysis on 5M–4H charts. On higher timeframes (Daily, Weekly), fewer EQH/EQL zones form but the ones that do tend to be more significant.
Pairs well with displacement and fair value gap analysis for confluence. If you use my Displacement Scanner , the two complement each other — displacement shows where aggressive moves happened, this indicator shows where the liquidity targets sit.
Credits
EQH/EQL detection method adapted from AlgoAlpha's proven pattern. Zone management, sweep detection engine, PDH/PDL/PWH/PWL integration, and dashboard by EmpArchitect.
Open source under Mozilla Public License 2.0. Indicateur

Indicateur
Price Memory Heatmap [BullByte]Price Memory Heatmap - Dynamic Support & Resistance Through Market Memory
Price Memory Heatmap visualizes where markets remember. It identifies price levels where repeated reactions have occurred, measures their intensity through a proprietary heat system, and displays them as dynamic zones that strengthen with each new reaction and naturally fade when the market moves on.
This is not a combination of existing indicators. It is a unified analytical framework built around one original concept: price levels accumulate heat from confirmed reactions and lose heat through exponential decay when untouched. The result is a self-organizing, self-cleaning map of historically significant price zones that evolves with every bar.
---
WHAT THIS INDICATOR DOES
Price Memory Heatmap tracks price levels where significant market reactions have occurred. Each level is treated as a living entity with memory:
→ Gains heat when price reacts at it (confirmed pivots and wick rejections)
→ Loses heat over time when untouched (exponential decay)
→ Displays visual intensity proportional to accumulated reaction history
→ Gets removed automatically when its heat falls below a minimum threshold
→ Classifies real-time price behavior at each zone (Rejection, Sweep, Break, Retest, Absorption)
The indicator tracks up to 20 memory levels simultaneously and displays only the most significant ones based on heat intensity and reaction count. Zones are color-coded from cool (low activity) to hot (high activity), giving instant visual hierarchy of level importance.
Key outputs:
→ Heat-mapped zones showing historical reaction intensity
→ Classification labels (Developing, Active, Strong, Dominant)
→ Hit count showing total confirmed reactions at each level
→ Relative volume multiplier showing conviction behind reactions
→ Level age tracking (Fresh, Seasoned, Veteran)
→ Real-time behavior detection integrated into zone labels
→ Summary dashboard ranking all active levels by heat
---
WHY THIS INDICATOR EXISTS
Traditional support and resistance tools draw static lines. They cannot tell you whether a level was tested once or ten times, whether reactions were backed by strong volume or weak, whether the level was formed yesterday or months ago, or how price is currently interacting with that level.
Price Memory Heatmap addresses each of these gaps through a single cohesive system:
PROBLEM: "Is this level significant?"
→ SOLUTION: Heat intensity and classification tier tell you immediately. A Dominant zone with 8 hits is far more significant than a Developing zone with 2 hits.
PROBLEM: "Was there conviction behind reactions at this level?"
→ SOLUTION: Relative volume multiplier shows whether reactions attracted above-average volume (e.g., 2.3x means 2.3 times the average bar volume).
PROBLEM: "Is this level still relevant?"
→ SOLUTION: Exponential decay naturally fades untouched levels. If the market has forgotten a level, the indicator forgets it too.
PROBLEM: "How is price interacting with this level right now?"
→ SOLUTION: Real-time behavior detection classifies the current interaction as Rejection, Sweep, Break, Retest, or Absorption.
PROBLEM: "How old is this level?"
→ SOLUTION: Age tracking categorizes each level as Fresh (recently formed), Seasoned (survived multiple decay cycles), or Veteran (persistent structural significance).
---
HOW PRICE MEMORY WORKS
The lifecycle of a memory level:
BIRTH - A confirmed pivot swing (high or low) creates a new memory level, or merges into a nearby existing level if one exists within the merge distance.
REINFORCEMENT - Each subsequent reaction at the level adds heat. Reactions with above-average volume add proportionally more heat. The level's price adjusts as a weighted average of all reactions.
DECAY - Every bar without a reaction, the level's heat is multiplied by the decay rate (default 0.992). This creates a natural half-life where untouched levels gradually lose prominence.
DEATH - When heat falls below the death threshold (default 0.08), the level is permanently removed. This keeps the chart clean and focused on relevant levels.
The heat value drives everything:
→ Zone color intensity (hotter = more prominent visual)
→ Classification tier (Dominant, Strong, Active, Developing)
→ Dashboard ranking (sorted by heat, hottest first)
→ Glow effect intensity (stronger glow on high-heat zones near price)
Additionally, wick rejections are detected as secondary reaction sources. When a candle wicks into an existing level and rejects (closes away), it adds heat at half the rate of a confirmed pivot, preventing over-weighting of intrabar noise while still capturing meaningful reactions.
---
WHY THIS IS NOT A MASHUP
This indicator uses pivot detection, ATR, and volume data internally, but it does not combine or display existing indicators. The distinction is fundamental:
A mashup displays independent indicators together on one chart.
This indicator uses standard calculations as INPUT MECHANISMS feeding a completely original processing engine whose output cannot be replicated by any combination of existing tools.
→ Pivots = Detection mechanism only (identifies where reactions occur)
→ ATR = Scaling parameter only (normalizes distances across any asset)
→ Volume = Weighting modifier only (amplifies high-conviction reactions)
→ Heat Accumulation + Decay = ORIGINAL (no existing indicator does this)
→ Dynamic Level Lifecycle = ORIGINAL (birth, reinforce, decay, death)
→ Behavior Detection at Levels = ORIGINAL (classifies interaction patterns)
No component is displayed independently. Everything feeds the central price memory concept.
---
HOW TO READ THE ZONES
ZONE COLORS (Dark Theme - default):
→ Purple/Blue tones = Low heat, Developing level (fewer reactions)
→ Red tones = Medium heat, Active or Strong level
→ Orange/Yellow/Gold tones = High heat, Dominant level (many confirmed reactions)
ZONE COLORS (Light Theme):
→ Gray/Steel tones = Low heat
→ Red/Dark Red tones = Medium to high heat
ZONE COLORS (Classic S/R Theme):
→ Green = Level currently acting as support (price above the zone)
→ Red = Level currently acting as resistance (price below the zone)
ZONE THICKNESS:
Zones expand slightly as heat increases and pulse larger when price approaches (proximity effect). The glow effect adds a soft outer halo that intensifies on high-heat levels near current price, providing immediate visual emphasis on the most important nearby zones.
ZONE LIFESPAN:
Each zone extends from its birth bar to a configurable number of bars into the future (default 15). This visual extension is purely for display - it helps identify where zones project ahead of price. Older zones with maintained heat indicate structural levels where the market has shown persistent memory.
---
HOW TO READ THE LABELS
Each visible zone displays a label with key information. The label format depends on the selected Label Mode. When behavior is detected, it is appended to the end of the label.
MINIMAL MODE EXAMPLE:
"STR 5 2.3x SEA REJ↑"
→ STR = Classification (Strong)
→ 5 = Hit count (5 confirmed reactions)
→ 2.3x = Relative volume (2.3 times average per reaction)
→ SEA = Age (Seasoned - 50 to 200 bars old)
→ REJ↑ = Current behavior (Bullish Rejection detected)
STANDARD MODE EXAMPLE:
"Strong | 5 hits | 2.3x | SEA | Rejection ↑"
→ Full classification name
→ Hit count with label
→ Relative volume multiplier
→ Age abbreviation
→ Full behavior name with direction
DETAILED MODE EXAMPLE:
"Strong | Resistance | 5 | 2.3x | 1.2345 | Seasoned | Sweep ↓"
→ Classification
→ Current support/resistance status
→ Hit count
→ Relative volume
→ Exact price
→ Full age name
→ Full behavior name
LARGE MODE:
Same information as Standard but rendered in larger text for visibility.
When no behavior is currently detected, the behavior portion is simply omitted from the label.
CLASSIFICATION TIERS:
→ Developing = Heat below 40% of max OR fewer than 3 hits
→ Active = Heat above 40% AND 3 or more hits
→ Strong = Heat above 60% AND 4 or more hits
→ Dominant = Heat above 80% AND 5 or more hits
AGE CATEGORIES:
→ Fresh (NEW) = Less than 50 bars since first detection
→ Seasoned (SEA) = Between 50 and 200 bars old
→ Veteran (VET) = More than 200 bars old
A Veteran level with high heat indicates deep structural significance - a price where the market has reacted repeatedly over an extended period and continues to hold relevance.
RELATIVE VOLUME EXPLAINED:
The volume shown is NOT raw volume. It is a normalized multiplier showing how much volume reactions attracted compared to the average bar:
→ 1.0x = Average volume at reactions
→ 2.0x or higher = Above-average conviction behind reactions
→ Below 0.5x = Below-average conviction
→ "-" = Volume data unavailable for this asset
Volume is calculated using attributed notional value: only the fraction of bar volume proportional to the zone width is counted, preventing large-range bars from inflating readings.
---
HOW TO READ THE DASHBOARD
The dashboard provides a ranked summary of all active memory levels. It appears as a table overlay on the chart (position configurable).
COLUMN-BY-COLUMN:
# → Rank by heat intensity. An asterisk (*) marks the highest-heat level. Numbers rank the rest.
PRICE → The exact price of the memory level, formatted to the asset's tick precision. This is the weighted-average price across all reactions at this level.
CLASS → Classification tier (Developing, Active, Strong, Dominant). In Classic S/R theme, a suffix "S" (Support) or "R" (Resistance) is appended based on whether price is above or below the level.
HEAT → Visual heat bar using 8 segments.
→ "||||||||" = Maximum heat (hottest level)
→ "||||...." = Moderate heat
→ "|......." = Low heat (may decay out soon)
HITS → Total number of confirmed reactions at this level. This includes both pivot-confirmed reactions and qualified wick rejections.
RVOL → Relative volume multiplier averaged across all reactions at this level. Higher values indicate stronger volume conviction behind the reactions that built this level.
STATUS → A dynamic field showing one of three things:
→ Behavior pattern name if currently detected (e.g., "REJ↑", "SWP↓", "BRK↑")
→ "At level" if price is within 0.15% of the zone (highlighted in green)
→ Distance as percentage if price is away (e.g., "1.25% above")
AGE → How long the level has existed (NEW, SEA, VET).
FOOTER → Shows total memory levels being tracked, how many are currently visible, and the current decay rate setting.
---
BEHAVIOR DETECTION
When price approaches a memory zone, the indicator analyzes real-time price action to classify how the market is interacting with that level. The detected behavior is displayed as part of the zone label and in the dashboard STATUS column.
Behaviors are checked in priority order. Only the highest-priority match is displayed.
BREAK (Highest Priority):
→ Price opens on one side of the zone and closes decisively on the other
→ Requires strong body (more than 50% of candle range)
→ Close direction must match candle direction (bullish close for Break ↑)
→ Indicates the level has failed and may flip from support to resistance or vice versa
→ Once a Break is detected, the level is marked internally so future Retest detection becomes possible
SWEEP:
→ Price extends significantly beyond the zone (1.5x zone height past the edge) then reverses
→ The extended wick must be larger than the body and more than 35% of total range
→ Close must be back near or inside the zone
→ This pattern often represents a liquidity grab - price pushes through to trigger stops then reverses
REJECTION:
→ A prominent wick touches or enters the zone, and the body closes away
→ Wick must exceed 45% of the candle's total range
→ Body must have meaningful size (more than 25% of range) confirming conviction
→ Indicates the level is actively defending - buyers or sellers are stepping in
RETEST:
→ Price returns to a level that was previously broken
→ Requires all lookback bars to have been on one side (away from zone)
→ Current bar must touch the zone
→ This is the classic "support becomes resistance" or "resistance becomes support" confirmation
ABSORPTION (Lowest Priority):
→ Multiple consecutive bars with bodies inside the zone
→ Average body size is small relative to average range (less than 45%)
→ Indicates accumulation or distribution is occurring within the zone
→ Often precedes significant directional moves
Behaviors persist in the label until a new behavior is detected. When price moves away from the zone, the last detected behavior remains visible, giving context about the most recent significant interaction.
---
RECOMMENDED TIMEFRAMES AND SETTINGS
SCALPING (1-minute to 15-minute charts):
→ Pivot Sensitivity: 2 to 4
→ Decay Rate: 0.980 to 0.985 (faster fade for fast markets)
→ Min Hits: 2
→ Focus on Fresh and Seasoned levels
DAY TRADING (15-minute to 1-hour charts):
→ Pivot Sensitivity: 5 to 8
→ Decay Rate: 0.990 to 0.992 (default range)
→ Min Hits: 2 to 3
→ Balanced mix of age categories
SWING TRADING (4-hour to daily charts):
→ Pivot Sensitivity: 10 to 15
→ Decay Rate: 0.994 to 0.996 (slower fade)
→ Min Hits: 3
→ Focus on Seasoned and Veteran levels
POSITION TRADING (daily to weekly charts):
→ Pivot Sensitivity: 15 to 25
→ Decay Rate: 0.997 to 0.999 (very slow fade)
→ Min Hits: 3 to 4
→ Focus on Veteran levels with high heat
GENERAL TIPS:
→ Higher timeframes benefit from increased Pivot Sensitivity
→ Volatile assets benefit from increased Merge Distance
→ For cleaner charts, increase Min Hits to Display
→ For more context, increase Max Memory Slots and Show Top N Levels
---
PRACTICAL EXAMPLES
EXAMPLE 1 - IDENTIFYING HIGH-PROBABILITY REACTION ZONES:
A Dominant-classified zone (gold/yellow) showing 7 or more hits with Veteran age tells you this is a deeply embedded structural level. The market has reacted here many times over hundreds of bars and the level continues to maintain high heat. When price approaches this zone, the probability of a meaningful reaction is elevated compared to a Developing zone with 2 hits.
EXAMPLE 2 - CONFIRMING A BREAKOUT:
Price approaches a Strong resistance zone. The label updates to show "Break ↑" as price closes decisively above. The dashboard STATUS column changes from "0.5% below" to "BRK↑". If price later returns to this zone and the label shows "Retest ↑", this confirms the classic resistance-to-support flip pattern. The zone's wasBroken flag ensures Retest detection only activates after a confirmed Break.
EXAMPLE 3 - SPOTTING LIQUIDITY SWEEPS:
A high-heat zone sits above price. Price spikes through the zone with a long upper wick but closes back inside or below. The label displays "Sweep ↓" indicating a potential stop-hunt pattern. The wick exceeded 1.5 times the zone height beyond its edge and the upper wick dominated the candle's body - both requirements for Sweep classification.
EXAMPLE 4 - READING VOLUME CONVICTION:
Two zones appear near current price. Zone A shows "2.8x" relative volume while Zone B shows "0.6x". The reactions that built Zone A attracted nearly 3 times the average bar volume, suggesting strong institutional interest. Zone B's reactions occurred on below-average volume, suggesting less conviction. This context helps prioritize which zone is more likely to produce a meaningful reaction.
EXAMPLE 5 - USING LEVEL AGE FOR CONTEXT:
A Veteran level (more than 200 bars old) that still maintains high heat has survived hundreds of decay cycles. Each cycle multiplies its heat by 0.992 (default). After 200 bars of decay without any new reactions, heat would fall to roughly 20% of its peak. For a Veteran level to remain Dominant, it must have received consistent reinforcement over time - indicating genuine structural significance rather than a one-time event.
---
Chart Example
1. Price on the S&P 500 E-mini Futures 15-minute chart is consolidating within a tight range between two heavily-tested Veteran zones, with the gold Dominant level acting as a persistent floor and an orange 22-hit Veteran zone overhead cycling through live behaviors as price repeatedly tests it from below. A structured ladder of purple Developing and red Active zones extends well below current price, with a Retest ↓ pattern visible at a mid-range level indicating a previously broken area is now being revisited from above. The dashboard confirms 17 memory levels tracked with 8 visible, the top-ranked Dominant zone holding a full heat bar and Break ↑ in its STATUS column throughout the session.
2. Price on the Nifty 50 Index 5-minute chart surged strongly through a cluster of high-heat gold zones during the session, reaching a peak at a thin Developing resistance level before pulling back sharply into a contested area between a Dominant zone and a Strong zone sitting just below it. The upper region shows two gold/yellow zones in close proximity - a Dominant and a Strong, both with Sweep behaviors active in their labels, indicating a liquidity grab above followed by a sharp reversal back into the zone cluster. The dashboard shows two Dominant-classified levels in the top two ranks, with a rich mix of Veteran and Seasoned ages confirming this price area carries deep structural memory.
---
SETTINGS REFERENCE
CORE SETTINGS:
→ Pivot Sensitivity - Bars on each side to confirm a swing. Lower = more sensitive, more levels.
→ Merge Distance - How close two reactions must be (in ATR multiples) to merge into one level.
→ ATR Period - Period for volatility normalization (default 14).
MEMORY SETTINGS:
→ Decay Rate - Per-bar multiplier for heat decay. 0.992 = balanced default.
→ Heat Per Reaction - Base heat added per confirmed reaction. Modified by volume weighting.
→ Death Threshold - Minimum heat to survive. Below this, the level is removed.
→ Max Memory Slots - Maximum simultaneous levels tracked (default 20).
→ Min Hits to Display - Reactions required before a zone becomes visible (default 2).
→ Show Top N Levels - Maximum zones rendered on chart (default 8).
DETECTION SETTINGS:
→ Wick Rejections - Enable wick-based reaction detection (adds heat at half rate of pivots).
→ Min Wick Ratio - Required wick percentage for wick reactions (default 55%).
→ Volume-Weighted Heat - Weight reactions by relative volume.
→ Behavior Detection - Enable real-time pattern classification at zones.
→ Behavior Lookback - Bars analyzed for behavior patterns (default 3).
APPEARANCE SETTINGS:
→ Color Theme - Dark (purple to gold gradient), Light (gray to red), Classic S/R (green/red).
→ Zone Thickness - Visual height of zones as ATR fraction.
→ Glow Effect - Soft outer halo that intensifies near price.
→ Proximity Radius - Distance at which proximity effects activate.
LABEL SETTINGS:
→ Show Zone Labels - Toggle zone information labels.
→ Label Mode - Information density (Minimal, Standard, Detailed, Large).
→ Show Hit Count - Include reaction count in labels.
→ Show Relative Volume - Include volume multiplier in labels.
→ Reaction Dots - Show dots at exact reaction prices (off by default for chart clarity).
DASHBOARD SETTINGS:
→ Show Dashboard - Toggle the summary table.
→ Position - Screen position (8 options).
→ Text Size - Font size (Tiny, Small, Normal).
→ Rows - Number of levels shown in dashboard (default 5).
---
ALERTS
Three alert conditions are available:
"Price entered hot zone" - Triggers when price enters a high-heat zone with 3 or more hits and heat above 50% of maximum. Useful for monitoring approaches to significant levels.
"New behavior detected" - Triggers when a new behavior pattern (Rejection, Sweep, Break, Retest, Absorption) is classified at any visible level. Useful for real-time event notification.
"New reaction" - Triggers when a new pivot is confirmed. Useful for tracking all reaction events across all levels.
All alerts describe observed events. They do not predict future price movement or generate buy/sell signals.
---
IMPORTANT NOTES
RETROACTIVE ANCHORING:
Pivot-based levels are confirmed after the Pivot Sensitivity number of bars have passed. The level is drawn at the true swing bar but only becomes known after confirmation. This is standard pivot behavior used across all pivot-based indicators and does not constitute future data usage.
VOLUME DATA AVAILABILITY:
Some assets, particularly certain forex pairs, may not report volume data. When volume is unavailable, relative volume displays show "-" and volume weighting is automatically disabled. The indicator functions fully without volume data.
EARLY CHART BEHAVIOR:
Zones and behavior labels may be sparse early in chart history. The indicator needs sufficient bars to detect pivots, accumulate heat, and meet the minimum hit count. Allow at least 100 bars for the system to populate meaningfully.
PERFORMANCE:
Reaction dots (when enabled) are only rendered within the most recent 500 bars to maintain chart performance. All memory calculations remain unaffected regardless of dot visibility.
---
DISCLAIMER
This indicator is provided for educational and analytical purposes only. It visualizes historical price reaction zones and does not predict future price movement, generate buy/sell signals, or constitute financial advice.
Past reactions at specific price levels do not guarantee future behavior. Market conditions change and levels that held previously may fail in the future. Always conduct your own analysis, use proper risk management, and never risk more than you can afford to lose.
The author assumes no liability for any trading decisions made using this tool. Trading involves significant risk of loss. Use this indicator as one component of a comprehensive trading approach, not as a standalone decision-making system.
---
BullByte Indicateur

Pro Levels & Zones [MTE]Pro Levels & Zones
An intraday futures overlay that combines pivot-based supply and demand zones with multi-session key levels and a confluence-based signal filter. The core idea is that zones alone generate too many potential entries — by requiring alignment across multiple independent factors before labeling a zone touch, the indicator filters out low-conviction setups and highlights where several references converge.
HOW IT WORKS
Supply & Demand Zone Detection
Zones are built from 60-minute pivot highs and pivot lows using a 3-bar left / 3-bar right pivot structure. When a pivot high is confirmed, the area between the candle's high and the top of its body becomes a supply zone (red). When a pivot low is confirmed, the area between the candle's low and the bottom of its body becomes a demand zone (green). Zones extend forward in real time and are automatically removed when price closes beyond the zone boundary or when the zone exceeds a configurable age limit (default: 500 bars). Only the 3 most recent zones per side are kept to avoid chart clutter.
Confluence Scoring (signal filter)
When price enters a fresh (unused) zone, the indicator checks up to 5 independent factors before printing a signal:
1. Volume delta direction — estimated from the bar's close position within its range. A buy signal requires positive delta; a sell signal requires negative delta.
2. VWAP proximity — whether price is near the session VWAP (within 0.15% of current price).
3. Key level proximity — whether price is near a relevant prior-session level (PDH, PDL, PMH, PML).
4. POC proximity — whether price is near the intraday volume Point of Control.
5. VWAP trend bias — whether price is on the "right side" of VWAP for the signal direction (buy below VWAP, sell above).
Each matching factor adds 1 to the score. The signal label displays the count (e.g., "Buy 4/5") so traders can see at a glance how many factors aligned. A configurable cooldown (default: 12 bars) prevents repeated signals in the same area. An additional filter requires bearish candle close for sells and bullish candle close for buys.
Note: The confluence score is simply a count of how many factors happen to align at the moment of zone contact. A higher count does not predict or guarantee a successful trade. It is a filtering tool, not a performance metric.
SESSION LEVELS & KEY LEVELS
The indicator tracks and displays levels from multiple sessions:
- London session high/low — plotted as live-updating steplines during the session, then held after session close.
- Asia session high/low — same behavior, off by default.
- Key levels drawn as dashed horizontal lines: Previous Day High/Low/Close (PDH/PDL/PDC), Pre-Market High/Low (PMH/PML), Previous Week High/Low (PWH/PWL), Overnight High/Low (ONH/ONL), and the RTH Opening Print. All are off by default and individually toggleable.
Previous day and week values use request.security() with a offset and lookahead_on, which is the standard method to reference the prior completed period without future data leakage.
ADDITIONAL TOOLS (all off by default)
- VWAP — standard session-anchored VWAP using ohlc4 as source.
- POC — intraday volume Point of Control calculated by distributing each bar's volume into a 100-bin histogram across the RTH price range, then finding the bin with the highest accumulated volume. Resets daily.
- Fair Value Gaps — bullish and bearish imbalances detected when a gap exists between bar 's low and bar 's high (or vice versa), filtered by a minimum percentage size (default: 0.15%). FVGs auto-expire after 40 bars. Maximum 6 active FVGs.
- Opening Range — plots the RTH opening range as a box (15 or 30 minute, configurable). Extends through the session.
WHY THIS COMBINATION
Most zone-based approaches generate signals every time price touches a zone, regardless of context. This indicator addresses that by requiring zone contact AND directional volume AND candle confirmation before printing anything, then layering additional context (VWAP, key levels, POC) as a visible confluence count. The result is fewer signals that occur only at zones where multiple independent references happen to converge.
The session levels (London, Asia, pre-market, overnight) are included because futures often react at session boundaries, and having them as toggleable overlays avoids needing separate indicators cluttering the chart.
HOW TO USE
1. Apply to a 1-15 minute intraday futures chart (defaults tuned for NQ on 5 min).
2. Adjust "Min Zone Size" for your instrument (NQ: 20-50 pts, ES: 5-15 pts).
3. Watch for Buy/Sell labels at zone touches. Higher confluence counts (4/5, 5/5) mean more factors aligned — use your own judgment on whether the context supports a trade.
4. Toggle key levels on/off depending on which session references matter to your trading approach.
5. All features are independently toggleable. Start with zones + signals, then add levels as needed.
DEFAULT SETTINGS
- Zones: ON, min size 20 pts, max age 500 bars
- Signals: ON, cooldown 12 bars, volume delta confirmation ON
- London session levels: ON
- All other levels and tools: OFF
LIMITATIONS
- Volume delta is estimated from bar close position within range — it is not true order flow data.
- POC uses a 100-bin histogram which is an approximation, not tick-level volume profile.
- Confluence scoring counts factor alignment but does not predict outcomes. Past confluence patterns do not guarantee future results.
- Zone detection has a 3-bar lag due to pivot confirmation.
- Designed for futures instruments. Adjust zone size settings for other markets.
Indicateur

Indicateur

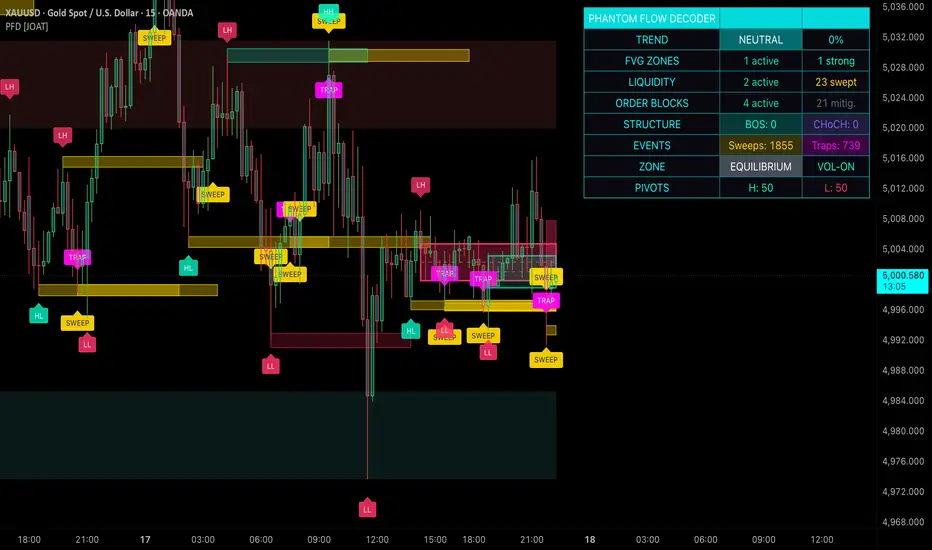
Phantom Flow Decoder [JOAT]Phantom Flow Decoder
Introduction
The Phantom Flow Decoder is an open-source overlay indicator that brings together five core Smart Money Concepts into a single, cohesive tool: market structure detection (BOS/CHoCH), order block identification, liquidity pool tracking with sweep and trap detection, Fair Value Gap (FVG) analysis with consequent encroachment, and premium/discount zone mapping. Rather than toggling between multiple scripts, traders can observe how these institutional concepts interact on the same chart in real time.
The indicator is built with Pine Script v6 and uses custom user-defined types to manage every structural element as a self-contained object, keeping the codebase modular and the chart clean even when all features are enabled simultaneously.
Why This Indicator Exists
Most Smart Money Concept tools on TradingView focus on a single element, such as order blocks alone or FVGs alone. This forces traders to stack multiple concepts and mentally piece together the relationships between them. The Phantom Flow Decoder solves this by synthesizing these elements into one unified system where:
Structure breaks validate order blocks: An order block only forms when a confirmed pivot is detected, ensuring the OB has structural significance.
Liquidity pools are volume-weighted: Pools are not just swing points; they carry a volume weight that reflects how much participation occurred at that level.
FVGs are tracked through their lifecycle: From formation to mitigation, each gap is monitored and visually updated when price fills it.
Premium/discount zones provide context: Knowing whether price sits in the top 20% or bottom 20% of the recent range helps traders decide whether to look for longs or shorts.
Core Components Explained
1. Market Structure Detection (BOS and CHoCH)
The indicator uses pivot-based swing detection to identify Higher Highs (HH), Lower Lows (LL), Higher Lows (HL), and Lower Highs (LH). When price breaks a previous swing level, the script classifies it as either a Break of Structure (BOS), which continues the existing trend, or a Change of Character (CHoCH), which signals a potential trend reversal.
Structure strength is calculated by combining volume ratio and price movement relative to ATR. A BOS with high volume and a large price move relative to ATR is considered stronger than one with thin volume.
calcStructureStrength(float priceMove, float vol, float atrVal, float volSmaVal) =>
float volRatio = vol / volSmaVal
float priceRatio = priceMove / atrVal
math.min(100, (volRatio * 30 + priceRatio * 70))
Each structure break is drawn as a horizontal line extending from the break level, with a compact label ("BOS" or "CHoCH") positioned nearby. Line styles are configurable between solid, dashed, and dotted.
Overview showing BOS and CHoCH labels on the chart with structure lines extending from break points
2. Order Block Detection
Order blocks represent the last opposing candle before a significant move. The indicator identifies bullish order blocks as the last bearish candle before a swing low, and bearish order blocks as the last bullish candle before a swing high. To filter noise, order blocks must meet a minimum size threshold measured in ATR multiples (default 0.5x ATR).
Each order block is drawn as a semi-transparent box with a dashed equilibrium line at its midpoint. When price returns to an order block and penetrates through it, the block is marked as mitigated and its visual is removed from the chart, keeping the display uncluttered.
3. Liquidity Pool Detection with Sweeps and Traps
Liquidity pools form at swing points where stop orders are likely clustered. The indicator tracks these pools and monitors them for two key events:
Sweeps: When price briefly pierces a liquidity level and then reverses, the pool is marked with a gold "SWEEP" label. The sweep threshold is configurable in ATR multiples.
Traps: When a sweep occurs with abnormally high volume, it is classified as a Smart Money Trap and marked with a magenta "TRAP" label, suggesting institutional manipulation.
When volume-weighted liquidity is enabled, each pool carries a weight based on the volume at the swing point relative to the 20-period volume SMA. This helps traders prioritize pools where significant participation occurred.
4. Fair Value Gap (FVG) Analysis
A bullish FVG forms when the current bar's low is above the high from two bars ago, creating a gap in price delivery. A bearish FVG is the inverse. The indicator filters FVGs by a minimum size (default 0.3x ATR) to avoid plotting insignificant gaps.
Each FVG is drawn as a colored box. When Consequent Encroachment is enabled, a dashed line is drawn at the 50% level of the gap, which institutional traders often use as a precise entry point. FVGs are tracked for mitigation: when price fills the gap, the box style changes to indicate it has been mitigated. FVGs older than the configurable max age (default 50 bars) are automatically removed.
5. Premium/Discount Zones
Using a configurable lookback period (default 50 bars), the indicator calculates the highest high and lowest low, then divides the range into zones. The top 20% is the premium zone (where sellers have an edge), the bottom 20% is the discount zone (where buyers have an edge), and the 50% level is the equilibrium. These zones are drawn as semi-transparent boxes with an equilibrium line.
Visual Elements
Swing Point Labels: HH, HL, LH, LL labels at each confirmed pivot
Structure Lines: Horizontal lines at BOS/CHoCH levels with configurable styles
Order Block Boxes: Semi-transparent boxes with equilibrium midlines
Liquidity Pool Boxes: Thin boxes at swing levels with SWEEP/TRAP labels
FVG Zones: Colored boxes with optional CE (50%) lines
Premium/Discount Zones: Background shading for range context
Candle Coloring: Optional trend-based candle coloring
Dashboard: Real-time metrics including trend direction, structure counts, and sweep/trap counts
Input Parameters
Structure Detection:
Pivot Sensitivity (2-20, default 5): Lower values detect more pivots, higher values only detect stronger swings
Show BOS / Show CHoCH: Toggle each structure type independently
Structure Line Style: Solid, Dashed, or Dotted
Order Block Detection:
Order Block Strength (1-10, default 3): Minimum candles for valid OB
Track OB Mitigation: Automatically remove mitigated OBs
Min OB Size (ATR): Minimum order block size filter
Liquidity Detection:
Liquidity Sensitivity (1-10, default 3)
Sweep Threshold (ATR): How far price must pierce a level to count as a sweep
Volume-Weighted Liquidity: Weight pools by volume participation
Fair Value Gaps:
FVG Max Age (bars): Auto-remove old FVGs (default 50)
Track FVG Mitigation: Monitor and update filled gaps
Min FVG Size (ATR): Filter small gaps
Show Consequent Encroachment: Draw 50% midline
Premium/Discount Zones:
Zone Lookback (20-200, default 50)
Show Equilibrium Line
How to Use This Indicator
Step 1: Identify the current market structure by observing BOS/CHoCH labels. A series of bullish BOS confirms an uptrend; a bearish CHoCH warns of a potential reversal.
Step 2: Look for unmitigated order blocks in the direction of the trend. In an uptrend, focus on bullish OBs below current price as potential support zones.
Step 3: Check if any FVGs overlap with order blocks. This confluence of an institutional entry zone (OB) with an imbalance in price delivery (FVG) creates a high-probability area.
Step 4: Confirm the zone is in the discount area (for longs) or premium area (for shorts) using the premium/discount zones.
Step 5: Monitor liquidity pools for sweeps. A sweep of a liquidity pool followed by a reversal into a confluence zone is a classic institutional entry pattern.
Step 6: Use the dashboard to monitor overall market conditions and structure counts.
Example showing a confluence setup: FVG overlapping with an order block in the discount zone, with a nearby liquidity sweep
Indicator Limitations
Pivot detection has an inherent delay equal to the pivot lookback period. Structure labels appear after confirmation, not in real time.
Order blocks and FVGs are based on historical price patterns and do not predict future price movement.
Volume-weighted features work best on instruments with reliable volume data. Low-volume instruments may produce less meaningful liquidity weights.
The indicator draws many visual elements simultaneously. On lower timeframes with high bar counts, consider reducing the Max Structure Elements setting to maintain chart performance.
Premium/discount zones are relative to the lookback period. Changing the lookback significantly alters the zones.
Smart Money Concepts are interpretive frameworks, not guaranteed predictors. Always use proper risk management.
Originality Statement
This indicator is original in its unified integration approach. While individual SMC components (BOS, CHoCH, order blocks, FVGs, liquidity pools) exist in separate scripts, this indicator is justified because:
It combines five distinct SMC methodologies into a single, object-oriented system using Pine Script v6 user-defined types
Volume-weighted liquidity pool detection adds a quantitative dimension to traditional swing-based liquidity mapping
Smart Money Trap detection (high-volume sweeps) provides a layer of institutional activity analysis not found in standard liquidity tools
FVG lifecycle tracking with consequent encroachment gives traders precise institutional entry levels
The premium/discount zone overlay provides immediate context for whether a setup is in a favorable or unfavorable area of the range
All components share state and interact: structure breaks trigger order block creation, liquidity pools are validated against volume data, and FVGs are checked against premium/discount positioning
Disclaimer
This indicator is provided for educational and informational purposes only. It is not financial advice or a recommendation to buy or sell any financial instrument. Trading involves substantial risk of loss and is not suitable for all investors. Smart Money Concepts are analytical frameworks that help interpret market behavior, but they do not guarantee profitable trades. Past patterns do not guarantee future results. Always use proper risk management, including stop losses and position sizing appropriate for your account. The author is not responsible for any losses incurred from using this indicator.
-Made with passion by officialjackofalltrades
Indicateur

Indicateur

Geass SRV - Support Resistance VolumeGeass SRV - Support Resistance Volume
by MasterTony
Volume profile engine adapted from Zeiirman's work — used with respect and full credit.
Most indicators tell you where price is. This one tells you where the market lives. The Support Band + Volume Profile is built around a single idea: price gravitates toward zones where real participation has happened, and it respects dynamic boundaries defined by the market's own momentum structure. This indicator surfaces both at once — a trend-adaptive zone on price and the volume history behind it.
How It's Calculated
Trend Direction (ADX + 200 SMA)
Market direction is read continuously using the DMI system — DI+ vs DI− for directional dominance, with the 200 SMA as a tiebreaker when they are equal. There is no neutral state. The indicator always commits to bull or bear, and all colors and zone behavior follow from that.
The Support Band (SMA 20 / EMA 21)
The innermost layer is a filled zone between the 20-period SMA and the 21-period EMA. These two averages are nearly identical in length but calculated differently, so the gap between them stays tight — producing a precise dynamic level rather than a wide smear. This is the mean of the recent trend. In a bull market it is the floor price returns to on pullbacks. In a bear market it is the ceiling price fails at on rallies. Green in a bull trend, red in a bear trend.
The Kijun Band — Main Trend Support and Resistance
The outer layer is the primary structural boundary of the indicator. The Kijun-Sen and Tenkan-Sen form a filled zone that acts as the main dynamic support in uptrends and the main dynamic resistance in downtrends, derived from Ichimoku Cloud. When price holds above this band the trend is intact. When price breaks through it and cannot reclaim it, the trend is in trouble.
Both lines adapt their lengths based on market conditions — compressing when momentum is strong and price is trending cleanly, expanding when conditions are weak or choppy. This means the boundary zone tightens in fast trends and widens when the market is uncertain, automatically adjusting to the environment. The lines are colored cyan in a bull regime and magenta in a bear regime, keeping them distinct from the inner band at all times.
The Kijun line within that band is the single most important level to watch. It is the baseline the trend must hold. Everything else in the indicator gives context to what happens at the Kijun.
Volume Profile — Reading the Zones
Volume profile engine adapted from Zeiirman's original work.
The volume profile is drawn to the right of price covering the last 240 bars. It answers the question the bands cannot: how much real participation has happened at each price level. A band sitting on a high-volume node is structurally different from a band sitting in empty space.
Point of Control (POC): The price level with the highest total volume — the market's center of gravity. When the POC aligns with the Kijun or the support band, that level is not just a moving average. It is a price the market has repeatedly chosen, making it the highest-conviction read the indicator can produce.
Value Area: The central 68% of all volume, shown as the brightest bars on the profile. The edges of the Value Area are high-probability reaction levels. Price approaching from outside tends to stall at the boundary or accelerate into the core. When the band zone overlaps a Value Area edge, dynamic structure and volume history are stacked at the same level.
Buy/Sell Split: Every row is divided between buying volume (green) and selling volume (red). When one side exceeds 60% it renders as a strong single color. This shows not just where volume was high — it shows who was in control. A dominant green node below price is demand. A dominant red node above is supply.
Low Volume Gaps: Rows with very little volume are structural gaps. Price moves through them quickly with little friction and accelerates until it hits the next meaningful cluster. When the band sits at the edge of a gap, a break can be fast and directional.
Freshness Fade: Recent volume glows brighter. Older volume fades. This prevents the profile from treating a level from 200 bars ago the same as one from yesterday.
Price Pivot S/R Lines
The last three swing highs and swing lows drawn as horizontal dashed lines — red for resistance, green for support. These are price memory. The exact levels where the market has previously reversed.
Bollingerbands
Custom Bollinger bands that can be toggled on to see outer lines of directional trend
How to Read It
The zone between the support band and the Kijun boundary is the core read. Green means the corridor is support — healthy pullbacks happen here. Red means it is resistance — rallies fail here. A tight narrow zone signals strong trend momentum. A wide zone signals a slower or more uncertain market.
The Kijun line is the level that matters most. A pullback that holds above it and bounces is trend continuation. A close below it is a warning. A reclaim from below is the first sign of a potential reversal. Every trade setup built with this indicator lives or dies at the Kijun.
The volume profile tells you whether the Kijun level carries real weight. A Kijun sitting on a large green volume node has been defended by buyers repeatedly — it has structural backing. A Kijun sitting in thin faded volume is unproven. When the POC and the Kijun are at the same price, that is the strongest signal this indicator can produce.
Value Area edges add a second volume-based reference layer. Watch for the band or Kijun to overlap with the top or bottom of the Value Area — that is confluence of two independent structural forces at the same level.
Pivot lines show the nearest price structure above and below. A green pivot just below the Kijun in a bull trend means two separate historical references are stacked — structural and volume-based support reinforce each other.
How to Trade With It
Bull Trend Pullback
Band is green. Price pulls back into the support band or toward the Kijun. Check the volume profile — is there a high-volume green node or the POC near that level? If yes, the zone has volume backing. Wait for a reversal signal inside the zone. Enter long with a stop below the Kijun. The nearest green pivot below is your hard invalidation.
Bear Trend Rally
Band is red. Price rallies into the band or toward the Kijun. Check the volume profile — is there a high-volume red node or the POC near the Kijun? If yes, the resistance is volume-confirmed. Wait for rejection inside the zone. Enter short with a stop above the Kijun. The nearest red pivot above is your invalidation.
Volume Gap Move
When price breaks out of the band and enters a low-volume section of the profile, expect the move to accelerate. There is no structural resistance in that gap. Price will run until it hits the next meaningful volume cluster. Use the profile to identify where that cluster is and target it.
Trend Change Warning
When the band flips color, stop trading the previous direction. Wait for price to pull back and hold the newly-colored zone on a retest before entering the new direction. Check the POC — if it is already on the new direction's side of price, the flip has volume support and is more likely to hold.
Confluence Filter
The cleanest setups occur when everything agrees: band color matches the trade direction, price is testing the Kijun, the POC or a high-volume node is at or near that level, and a pivot line adds nearby structure. When all of that stacks at one price, the zone is as high-conviction as this indicator gets.
Credits
Volume profile engine — Gaussian volume distribution, buy/sell split, POC calculation, Value Area logic, and freshness fade — adapted from Zeiirman's original work. Full credit to Zeiirman for the foundation that powers the volume layer of this indicator. Indicateur

Trend Zone Dashboard with Auto S/R [PhenLabs]Trend Zone Dashboard with Auto Support/Resistance
Version: PineScript™ v6
📌 Description
The Trend Zone Dashboard with Auto Support/Resistance is a professional-grade, self-calibrating support and resistance detection system. It automatically scans for pivot highs and lows across a configurable lookback window, clusters them into consolidated price zones using an adaptive tolerance algorithm, then scores each zone by touch frequency and bounce rate. The result is a clean set of actionable S/R zones rendered directly on the chart with an accompanying data-rich dashboard — no manual level-drawing required.
🚀 Points of Innovation
Auto Mode with Binary Search Calibration: A built-in iterative algorithm automatically tunes clustering tolerance to converge on a user-defined target number of zones (default: 5), eliminating the need for manual parameter tweaking across different instruments and timeframes.
Statistical Zone Scoring: Each zone is scored by both touch count (how often price interacts with the zone) and bounce rate (percentage of touches that produced confirmed reversals), giving traders a quantified measure of zone reliability.
Greedy Merge Clustering: Sorted pivot prices are merged using an ATR-adaptive or percentage-based tolerance, producing naturally consolidated zones that reflect true areas of price memory rather than arbitrary horizontal lines.
🔧 Core Components
Pivot Detection Engine: Uses `ta.pivothigh()` and `ta.pivotlow()` with configurable strength to identify swing points. Raw pivots are accumulated incrementally across all bars for efficiency, then filtered to the lookback window on the final bar.
Adaptive Clustering Algorithm: In Auto Mode, a 15-iteration binary search explores tolerance values between 0.1× ATR and 8× ATR, counting the resulting clusters at each step until the output converges to ±1 of the target zone count. In Manual Mode, the user directly sets ATR multiplier or percentage threshold.
Touch & Bounce Tracker: On the last bar, the engine scans the full lookback window bar-by-bar for each zone. A “touch” occurs when a bar’s high-low range overlaps the zone boundary. A “bounce” is confirmed when the close moves away from the zone midpoint relative to the prior close, distinguishing genuine rejections from breakdowns.
Directional Pruning System: Zones are intelligently removed only when price has decisively broken through them in the correct direction — support zones are pruned only if price collapses far below them, and resistance zones only if price surges far above. This prevents valid zones from being erroneously discarded.
🔥 Key Features
Dynamic Dashboard Table: An on-chart table (positionable to any corner) displays each active zone’s price level, type (Support/Resistance), pivot confluence count, touch strength, distance from current price, and bounce rate — all color-coded for instant readability.
Strength-Scaled Zone Boxes: Zones are drawn as shaded rectangular regions on the chart, with transparency inversely proportional to their strength score. Stronger zones appear more vivid; weaker zones fade into the background.
Color-Coded Bounce Rate: High bounce rates on support zones glow green; high bounce rates on resistance zones glow red. Low-confidence zones are dimmed to gray, directing attention to the most actionable levels.
Pivot Confluence Column: Shows how many raw pivot points were merged into each cluster, providing a confluence metric independent of the touch count.
Info Footer Row: The dashboard footer displays the current mode (Auto/Manual), computed tolerance, total pivot count, and lookback depth for full transparency into the algorithm’s behavior.
🎨 Visualization
Zone Boxes: Support zones rendered in green, resistance zones in red, extending from the lookback origin to 25 bars into the future. Width reflects the natural spread of the clustered pivot prices.
Zone Labels: Compact labels at the right edge of each zone box display type, price level, touch count, and bounce rate at a glance.
Dashboard Table: A 6-column professional table with a blue header row, color-coded data cells, and a gray info footer. Fully repositionable via dropdown input.
📖 Usage Guidelines
Auto Mode (Recommended): Leave Auto Mode enabled with the default target of 5 zones. The algorithm will self-calibrate to produce approximately 5 meaningful S/R zones on any instrument or timeframe. Increase the target for more granular analysis or decrease it for a cleaner chart.
Lookback Period: The default of 200 bars works well for most scenarios. Increase to 500+ on higher timeframes (Daily, Weekly) to capture macro structure. Decrease to 50–100 on scalping timeframes for more responsive zones.
Pivot Strength: Controls the minimum swing significance. Higher values (8–15) produce fewer but more significant pivots. Lower values (2–4) capture minor swings and produce denser zone coverage.
Manual Mode: Disable Auto Mode to take direct control of clustering tolerance. Use ATR multiplier for volatility-adaptive clustering, or percentage threshold for fixed-width zones relative to price.
Breakout Pruning: The breakout ATR multiplier (default 2.0) controls how far price must close beyond a zone before it’s considered invalidated. Increase for more persistent zones; decrease for faster pruning.
✅ Best Use Cases
Key Level Identification: Automatically surface the most statistically significant support and resistance levels without manual drawing, ideal for traders who analyze multiple instruments.
Zone Quality Assessment: Use the bounce rate column to distinguish between zones that consistently produce reversals versus zones that price tends to slice through — critical for setting stop-loss and take-profit targets.
Confluence Trading: Zones with high pivot counts AND high touch counts represent areas where price has repeatedly found significance from multiple independent swing points, offering the highest-probability trade setups.
Breakout Validation: When a zone with a historically high bounce rate is finally broken (pruned from the dashboard), it signals a genuine structural shift rather than a false breakout.
Multi-Timeframe Analysis: Run the indicator on your execution timeframe with a long lookback to naturally capture higher-timeframe structure within a single instance.
⚙️ Settings Overview
Auto Mode (Default: On) — Enables intelligent self-calibration of clustering parameters.
Target Number of Zones (Default: 5) — The desired number of S/R zones in Auto Mode. Range: 2–15.
Lookback Period (Default: 200) — Number of bars to scan for pivots. Range: 20–1000.
Pivot Strength (Default: 5) — Left/right bar count for pivot confirmation. Range: 2–20.
Clustering Method (Default: ATR) — ATR-based or Percentage-based tolerance for manual mode.
ATR Multiplier (Default: 1.0) — Multiplier applied to ATR for zone merge tolerance in manual mode.
Percentage Threshold (Default: 0.5%) — Fixed percentage tolerance for zone merging in manual mode.
Minimum Touches (Default: 2) — Zones with fewer touches are filtered out (manual mode only; auto mode uses 1).
Maximum Zones (Default: 8) — Hard cap on displayed zones.
Breakout Pruning (Default: 2.0× ATR) — Distance beyond zone edge required to consider it broken.
Dashboard Position (Default: Top Right) — Corner placement for the dashboard table.
Show Zone Boxes (Default: On) — Toggle chart zone rendering.
Show Zone Labels (Default: On) — Toggle zone annotation labels.
Support/Resistance Colors — Fully customizable zone and dashboard color scheme.
💡 Note
This indicator performs its full computation on the last bar only (`barstate.islast`), making it lightweight regardless of chart history length. The Auto Mode binary search converges in ≤15 iterations, adding negligible overhead. For best results, ensure your chart has sufficient history loaded (at least 200+ bars) so the pivot detection engine has adequate data to identify meaningful swing points. Always use this tool in conjunction with price action context and broader market structure analysis.
```
Indicateur

Supply & Demand Zones + Triple EMA ProSupply & Demand Zones + Triple EMA Pro is a price action indicator designed to automatically detect high probability supply and demand zones while aligning them with trend direction using a triple EMA structure.
The indicator identifies potential institutional reaction levels where price previously moved away with strong momentum. These areas often represent zones where large buy or sell orders were previously placed, making them potential areas for future support, resistance, or reversals.
Unlike simple pivot based supply and demand indicators, this script filters zones using displacement logic, ATR impulse detection, and optional trend bias to reduce noise and highlight stronger setups.
Core Concepts
Supply Zones
Supply zones represent areas where selling pressure previously overwhelmed buyers and price moved downward quickly.
Demand Zones
Demand zones represent areas where buyers stepped in aggressively and price moved upward with momentum.
When price returns to these areas, traders often look for reactions such as reversals or continuation moves depending on overall market context.
Key Features
Automatic Supply and Demand Detection
The indicator detects supply and demand zones using pivot structure and price displacement.
Zones are created only when:
A swing high or swing low forms
Price moves away with sufficient momentum
A valid base candle is detected
This helps filter weak zones and highlight stronger institutional reaction areas.
Displacement Filtering
Zones are confirmed only when price moves away from the pivot with sufficient strength using ATR based impulse measurement.
This helps avoid zones that form during weak or sideways price movement.
Base Candle Detection
Instead of using the pivot candle directly, the indicator searches for the last opposing candle before the move, which often represents the true origin of the supply or demand zone.
Examples:
Supply zone
Last bullish candle before a strong bearish move
Demand zone
Last bearish candle before a strong bullish move
Triple EMA Trend Filter
The indicator includes a 21 / 50 / 200 EMA stack to identify market trend.
Bullish structure
EMA 21 > EMA 50 > EMA 200
Bearish structure
EMA 21 < EMA 50 < EMA 200
Zones can optionally be filtered to only show those that align with the current trend.
EMA Trend Coloring
Candles can be automatically colored based on EMA alignment:
Green
Strong bullish structure
Red
Strong bearish structure
Gray
Neutral or transitional structure
This helps quickly identify trend direction while trading zone retests.
Automatic Zone Mitigation
Zones are automatically removed when price fully breaks through them.
This keeps charts clean and ensures only relevant zones remain.
Inputs
Pivot Left / Right Bars
Controls sensitivity of swing detection.
Zone Extension
How far zones extend into the future.
ATR Impulse Multiplier
Controls how strong the move away must be to validate a zone.
Lookahead Bars
Number of bars used to measure displacement.
EMA Bias Filter
Optional trend filter using EMA structure.
Candle Coloring
Toggle EMA based candle coloring.
How to Use
Typical workflow:
Identify overall trend using the EMA stack.
Focus on demand zones during bullish trends.
Focus on supply zones during bearish trends.
Wait for price to return to the zone.
Look for confirmation such as:
rejection candles
market structure shifts
volume spikes
lower timeframe entries
The indicator is suitable for:
Forex
Crypto
Stocks
Futures
Works on all timeframes but performs best on 15m and higher where price structure is cleaner.
Strategy Ideas
Trend continuation
Buy demand zones in bullish EMA structure.
Pullback entries
Use demand zones as retracement entries in trends.
Reversal setups
Watch for price rejection at opposing zones.
Liquidity reactions
Look for aggressive price rejection when zones are retested.
Notes
This indicator is designed as a price action tool, not a standalone trading system.
Best results are achieved when combined with:
market structure
liquidity sweeps
volume analysis
higher timeframe bias
Disclaimer
This script is for educational and analytical purposes only.
Trading involves significant risk. Always manage risk and perform your own analysis before taking trades. Indicateur

Institutional Delta Sweeps [BOSWaves]Institutional Delta Sweeps - Liquidity Engineering Detection with Sweep-Confirmed Directional Zones
Overview
Institutional Delta Sweeps is a liquidity-aware market structure system that identifies engineered price movements designed to absorb resting orders at significant swing highs and lows, then projects directional action zones derived from confirmed sweep behavior.
Rather than treating price extremes as simple support and resistance levels, this system evaluates them as active liquidity pools, concentrations of stop orders and pending positions that institutional order flow systematically targets before reversing. Sweep detection, pool visualization, and forward-projecting action zones are each driven by structural pivot logic, ATR-normalized zone construction, and comet-decay fade modeling.
This produces a dynamic picture of where liquidity rests, which pools have been raided, and where post-sweep directional opportunity emerges, distinguishing engineered reversals from ordinary price fluctuations rather than treating all breakouts as directional commitments.
Conceptual Framework
Institutional Delta Sweeps is founded on the principle that price does not break significant swing levels to continue, it breaks them to collect. The majority of retail positions cluster around swing highs and lows in the form of stop-loss orders and breakout entries, creating predictable liquidity concentrations that larger participants systematically exploit before reversing.
Traditional breakout frameworks interpret price exceeding a prior swing high or low as directional confirmation. This system inverts that premise: a wick beyond a structural level that closes back inside is treated not as a failed breakout but as a deliberate liquidity raid, and the close back inside, paired with structural reversion, becomes the actual signal.
Three core principles guide the design:
Liquidity pools form predictably at structural pivot highs and lows where the majority of the market has positioned stops.
A sweep is confirmed only when price wicks through the pool and the bar closes back inside prior structure, indicating rejection rather than continuation.
Post-sweep directional opportunity exists within the zone created by the sweep candle itself, where the aggressive move originated.
This reframes conventional breakout analysis into a liquidity engineering detection framework anchored in institutional order flow principles.
Theoretical Foundation
Institutional Delta Sweeps combines pivot-based structural identification, ATR-normalized zone construction, sweep confirmation logic, and time-decay visualization modeling.
Swing highs and lows are identified through configurable left and right pivot lookback periods, locating price extremes that attracted sufficient market participation to create meaningful liquidity concentrations. ATR-based zone depth provides adaptive scaling that accounts for varying volatility regimes, ensuring pool boundaries reflect realistic stop clustering distances rather than fixed offsets. Comet-decay fade modeling progressively reduces zone opacity as pools age, visually communicating diminishing relevance without removing valid unswept levels.
Four internal systems operate in tandem:
Pivot Detection Engine : Identifies confirmed structural highs and lows using bilateral lookback logic, capturing swing extremes with sufficient confirmation on both sides.
Liquidity Pool Construction : Builds ATR-scaled zone boxes above swing highs and below swing lows, with inner and outer boundary layers representing the core and extended stop clustering regions.
Sweep Confirmation Logic : Validates liquidity raids by requiring both wick penetration of the pool and a closing price back inside prior structure on the same candle, filtering genuine raids from false breakouts.
Comet-Decay Fade System : Applies exponential aging to unswept pool opacity, creating a visual comet-trail effect where fresher zones display with full intensity and older zones fade progressively toward expiry.
This architecture distinguishes active liquidity targets from stale, already-discounted levels while providing clear visual hierarchy across the chart.
How It Works
Institutional Delta Sweeps processes price through a sequence of structure-aware evaluation steps:
Pivot Identification : Bilateral lookback logic confirms swing highs and lows once sufficient price bars exist on both sides, anchoring zone placement to structurally significant levels.
Zone Construction : ATR-scaled boxes are drawn above each confirmed pivot high and below each confirmed pivot low, establishing the expected stop-clustering region with inner and outer boundary layers.
Level Line Projection : A horizontal reference line extends from each pivot price forward in time, maintaining visibility of the exact sweep threshold as price develops.
Market Structure Visualization : ZigZag connections between alternating swing highs and lows provide directional context, identifying the prevailing structural sequence surrounding each liquidity pool.
Comet-Decay Application : As bars accumulate from zone creation, opacity decreases via cubic decay curve. Fresh zones appear solid and prominent, aging zones fade toward invisibility approaching the maximum age threshold.
Sweep Detection : Each bar is evaluated against all active unswept zones. A bearish sweep confirms when price wicks above a high zone and closes below the pivot level with an open below it. A bullish sweep confirms when price wicks below a low zone and closes above the pivot level with an open above it.
Cooldown Enforcement : A configurable bar cooldown between sweeps of the same directional type prevents multiple triggers within the same impulse move, maintaining signal quality during volatile sequences.
Sweep Highlight Rendering : A localized box is drawn around the sweep wick from the wick extreme to the pivot price, visually marking the exact penetration zone with directional color coding.
Penetration Labeling : The percentage distance the wick traveled beyond the pivot price is calculated and displayed, quantifying the depth of the liquidity raid for contextual assessment.
Post-Sweep Zone Projection : Buy and Sell zones are drawn forward from the sweep candle body, extending a configurable number of bars into the future and marking the actionable re-entry region derived from the sweep structure.
Together, these elements form a continuously updating liquidity map that distinguishes engineered price movements from genuine directional expansion.
Liquidity Pools
Liquidity pools are the foundational structural element of this system. Each confirmed pivot high produces a bearish pool, a zone above the swing extreme where buy-stop orders and breakout entries have accumulated. Each confirmed pivot low produces a bullish pool, a zone beneath the swing extreme where sell-stop orders and breakdown entries cluster.
Pool depth is determined by the ATR Zone Width parameter, scaling zone thickness relative to recent volatility so that stop-clustering boundaries remain proportional to actual market movement ranges regardless of instrument or timeframe. An inner boundary layer within each pool highlights the densest expected stop concentration, while the outer boundary captures the extended reach of the zone.
Pools remain visible and active until one of two conditions is met: the zone is swept and confirmed, or the maximum zone age is exceeded. During their lifespan, pools fade progressively through the comet-decay model. Brightest at creation, dimming exponentially as time passes, providing immediate visual distinction between recently formed levels with high relevance and aged levels with diminishing structural significance.
This creates a living liquidity landscape across the chart, where the most actionable pools stand out clearly and historical zones naturally recede without requiring manual management.
Sweep Signals & Post-Sweep Zones
Sweep detection is the core signal event of this system. A confirmed sweep requires precise price behavior: the wick must penetrate the liquidity pool, but the bar must close entirely back inside prior structure with the open also inside structure, confirming that the excursion was absorbed and rejected rather than sustained.
When a bearish sweep confirms, a SELL ZONE is projected forward from the sweep candle body. This zone spans from the high of the sweep candle down to the upper boundary of the candle body, extending forward a configurable number of bars. The logic behind this zone is structural: the candle body represents where price was before and after the raid, and a return to this region following the sweep constitutes a re-engagement with the origin of the institutional move. Bearish continuation from within this zone aligns with the directional implication of the sweep.
When a bullish sweep confirms, a BUY ZONE is projected forward from the sweep candle body. This zone spans from the lower boundary of the candle body down to the sweep wick low, extending forward across the same configurable projection window. A price return into this zone after the sweep offers a structurally anchored re-entry aligned with the bullish implication of the liquidity raid.
Both zone types display with dashed borders and low-opacity fills to distinguish them from the liquidity pools themselves, and each carries a directional text label for immediate visual identification. The penetration percentage label at each sweep candle provides additional context, quantifying exactly how far price traveled into the liquidity cluster before rejecting. Deeper penetrations often indicate more aggressive institutional participation.
Sweep cooldown parameters prevent duplicate zone projection during fast markets, ensuring each projected zone corresponds to a single clean sweep event rather than a cascade of overlapping signals.
Interpretation
Institutional Delta Sweeps should be interpreted as a structural liquidity map with directional implications derived from confirmed engineered reversals:
Active Liquidity Pool (Bearish - Red) : Marks a confirmed pivot high where sell-stop and breakout-buy orders are clustered, representing a viable sweep target for downside liquidity raids.
Active Liquidity Pool (Bullish - Green) : Marks a confirmed pivot low where buy-stop and breakdown-sell orders cluster, representing a viable sweep target for upside liquidity raids.
Zone Opacity : Brighter, more saturated zones are recently formed and structurally relevant. Faded, transparent zones are aging toward expiry and carry reduced analytical weight.
Sweep Highlight Box : A small colored box enclosing the sweep wick marks the exact penetration region, distinguishing the raid candle visually from surrounding price action.
SWEEP % Label : Percentage above or below the pivot that the wick reached, providing raid depth context for conviction assessment.
SELL ZONE (Red Dashed) : Forward-projecting zone derived from a bearish sweep candle body, marking the region where price return offers structurally aligned short opportunity.
BUY ZONE (Green Dashed) : Forward-projecting zone derived from a bullish sweep candle body, marking the region where price return offers structurally aligned long opportunity.
Market Structure Lines : ZigZag connections between swing extremes provide directional trend context surrounding each liquidity pool.
Pool age, sweep confirmation quality, and structural trend alignment carry more interpretive weight than isolated wick penetration depth alone.
Strategy Integration
Institutional Delta Sweeps fits within liquidity-informed and structure-based trading approaches:
Sweep-Confirmed Reversals : Enter in the direction of the sweep implication, short following bearish sweeps, long following bullish sweeps, using the projected zone as the entry region.
Zone Re-entry Precision : Rather than entering immediately at the sweep candle close, wait for price to return to the projected Buy or Sell zone, offering a lower-risk entry with a structurally defined reference.
Pool-Based Anticipation : Identify active unswept pools ahead of price as areas where sweep attempts may occur, allowing pre-positioning for the subsequent reaction.
Structural Context Filtering : Use the market structure ZigZag to assess whether a sweep aligns with the broader directional sequence. Sweeps occurring against the prevailing structure carry higher reversal probability.
Penetration Depth Assessment : Deeper sweep penetrations may indicate more significant liquidity absorption, potentially supporting higher-confidence directional commitment following confirmation.
Multi-Timeframe Liquidity Mapping : Apply higher-timeframe pools as macro sweep targets and lower-timeframe sweep confirmations as precision entry triggers within the same directional thesis.
Technical Implementation Details
Pivot Engine : Bilateral lookback pivot detection with configurable left/right confirmation periods
Zone Construction : ATR-scaled dual-layer box system with inner concentration boundary and outer cluster boundary
Decay System : Cubic comet-decay fade applied to zone opacity across maximum age lifespan
Sweep Logic : Wick-penetration plus same-bar close-back confirmation with directional cooldown enforcement
Post-Sweep Projection : Body-anchored forward zones with configurable bar extension and dashed border styling
Visualization : Layered box architecture with level lines, sweep highlights, penetration labels, and directional zone text
Signal Logic : Alert conditions for both bullish and bearish sweep confirmations
Performance Profile : Optimized for real-time execution across all timeframes
Optimal Application Parameters
Timeframe Guidance:
1 - 5 min : Intraday liquidity raid detection with tighter pivot lookbacks for responsive pool formation
15 - 60 min : Session-level sweep identification with balanced zone aging and medium projection windows
4H - Daily : Macro liquidity pool mapping with wider pivot lookbacks and extended zone persistence
Suggested Baseline Configuration:
Pivot Lookback Left : 20
Pivot Lookback Right : 20
Sweep Cooldown Bars : 10
Zone ATR Width : 0.3
Max Zone Age (Bars) : 200
Buy/Sell Zone Projection : 50 bars
Show Liquidity Pools : Enabled
Highlight Sweep Zone : Enabled
Show Sweep Labels : Enabled
Project Buy/Sell Zones After Sweep : Enabled
Show Market Structure : Enabled
These suggested parameters represent a balanced starting point; asset-specific volatility profiles, structural swing frequency, and preferred signal density will require individual calibration for optimal performance.
Parameter Calibration Notes
Use the following adjustments to refine behavior without altering the core logic:
Too many zones forming : Increase Pivot Lookback Left and Right to require greater structural significance before a swing qualifies as a liquidity pool.
Zones expiring before being tested : Increase Max Zone Age to extend pool lifespan, particularly useful on slower-moving instruments.
Overlapping sweep signals : Increase Sweep Cooldown Bars to enforce greater separation between consecutive detections during volatile sequences.
Buy/Sell zones expiring before price returns : Increase Zone Projection bars to extend forward reach, allowing more time for post-sweep re-entries to develop.
Zones too thick or thin relative to price action : Adjust ATR Zone Width to scale pool depth proportionally to the instrument's typical volatility range.
Signal noise in ranging conditions : Tighten Pivot Lookback to require more local context around each swing, reducing zone formation in non-trending environments.
Adjustments should be assessed across a representative sample of market conditions rather than tuned to a single isolated session.
Performance Characteristics
High Effectiveness:
Trending markets with clear structural swing sequences and consistent directional momentum following sweep events
Instruments with predictable stop clustering behavior at technical swing levels
Reversal-oriented strategies entering at sweep confirmation with post-sweep zone precision
Multi-timeframe frameworks where higher-timeframe pools provide macro sweep targets
Reduced Effectiveness:
Grinding, overlapping markets where swing points form erratically without clean separation
Instruments with thin liquidity where stop-cluster raids are less institutionally driven
News-spike environments where price gaps through zones without canonical sweep-and-close patterns
Extended consolidation phases where pools accumulate without sufficient directional momentum to trigger sweep events
Markets with structural volatility expansion that consistently overshoots zones, triggering false sweep confirmations
Integration Guidelines
Pool Respect : Treat unswept pools as live structural targets. Price approaching these zones carries sweep attempt probability that should inform position management.
Zone Discipline : Only engage Buy and Sell zones when price returns to them after the sweep. Immediate entry at the sweep candle close sacrifices the structural precision the zone provides.
Structural Alignment : Weight sweeps more heavily when they align with the prevailing ZigZag structure sequence, and treat counter-structure sweeps as higher-risk with reduced position sizing.
Confluence : Combine with BOSWaves momentum tools, volume analysis, or session context to validate sweep events with supporting evidence beyond price structure alone.
Pool Age Awareness : Fresh pools with high opacity represent recently formed liquidity concentrations with strong relevance. Faded pools approaching age expiry warrant lower confidence in clean sweep behavior.
Disclaimer
Institutional Delta Sweeps is a professional-grade liquidity analysis and market structure tool. It applies pivot-based zone detection, ATR-normalized pool construction, and sweep confirmation logic but does not predict future price movements. Results depend on market conditions, structural swing clarity, parameter configuration, and disciplined execution. BOSWaves recommends deploying this indicator within a comprehensive analytical framework that incorporates momentum context, volume behavior, and rigorous risk management protocols. Indicateur

Indicateur