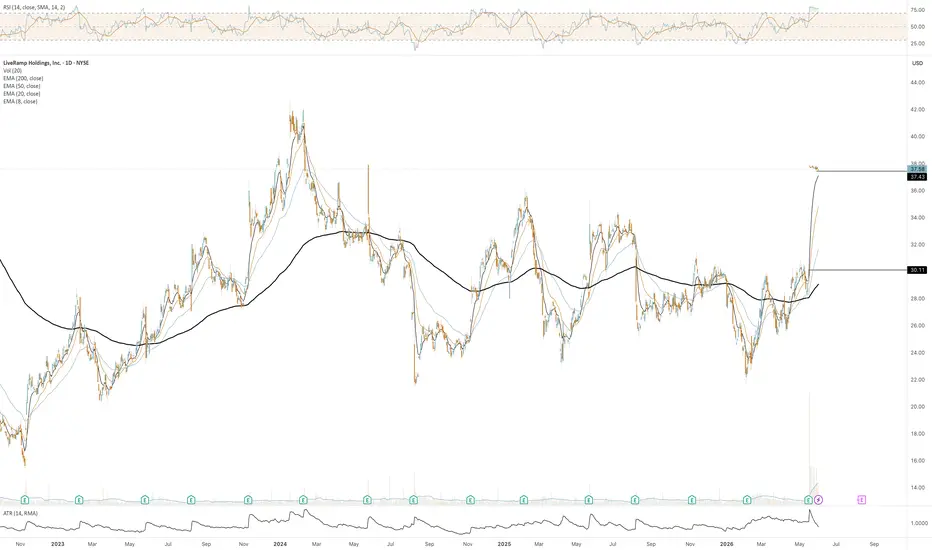
RAMP 10.0 A+ PEG SetupRAMP gapped up 27.4% on earnings and is now consolidating the move instead of giving it back — textbook PEG continuation. Holding above all 3 EMAs, tightening up over the last 10 sessions. Continuation targets $42.85, stop under $37.06.
#earningsgap #PEG #continuation #momentum
LiveRamp Holdings, Inc.
No trades
No trades
Compare with LiveRamp Holdings, Inc.
2.15 EUR
125.31 M EUR
703.62 M EUR
58.14 M
Next report date
—
Report period
—
EPS estimate
—
Revenue estimate
—
Company info
Sector
Industry
CEO
Scott E. Howe
Website
Headquarters
San Francisco
Founded
1969
IPO date
Dec 14, 1983
ISIN
US53815P1084
CUSIP
53815P108
FIGI
BBG00M6H21B0
Identifiers
ISIN US53815P1084
LiveRamp Holdings, Inc. is a global technology company, which engages in the provision of a data collaboration platform in consumer privacy, data ethics, and foundational identity. The company was founded in 1969 and is headquartered in San Francisco, CA.
Beyond Basic Candlestick Pattern AnalysisLearning to Recognize Who Is Controlling the Stock Price
There is a plethora of training on Candlestick Pattern Analysis and interpretation, and yet this remains one of the most problematic areas for Technical Traders who want to trade at the expert level.
Once the basics of Japanese Candlestick
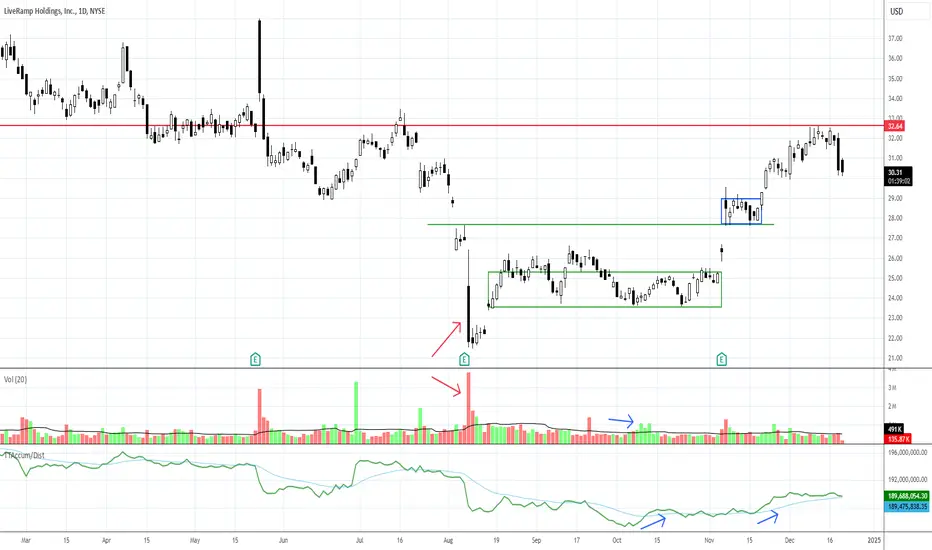
$RAMP with a PEG Consolidation.NYSE:RAMP may well ramp up here. They had nice earnings beat with a Power Earnings Gap (PEG) and now some nice consolidation. I have placed an alert just over yesterday’s high. Should it trigger, I will look to a lower timeframe for a good risk reward entry. I like these kinds of set-ups as the ris
November Gainers (RAMP, account up 1%)5th gainer in November is NYSE:RAMP . Holding period is 1 day (11/9/22-11/10/22). Account up 1%.
This month till today, my account is up 4%, average holding period is 13 days.
My trading method is mostly short term and is independent of market swings.
Will keep updating on my trades.
$RAMP time to Short / Stay away?Looking at the green trend line starting from around mid 2014, till 2025 ish .
The trend line suggested price target of 47$ by 2024 already seems priced-in during today's date (Feb 9, 2022)'s after-hours session!
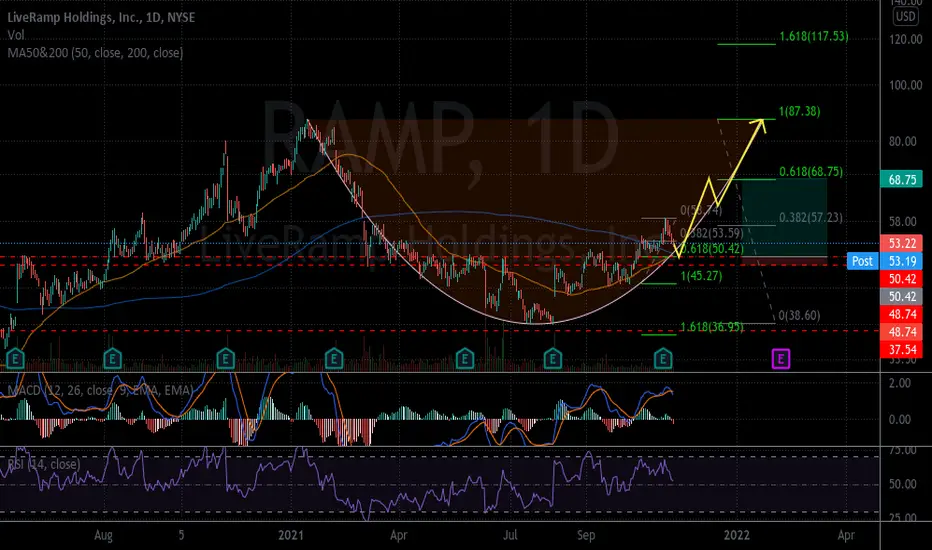
Additionally, there's that giant Inverted Cup and Handle pattern. Ignore the covid-19
RAMP | ForecastJournal Entry
Bias: Positive.
Sentiment: Optimistic.
Emoji (emotion): Kindled 🔥.
Null Hypothesis: Buy.
Alternative Hypothesis: Sell.
Signals: %B oversold, Bollinger Bands oversold.
Position: Short term day trade.
Notes: They surprised earnings estimates last week.
Other: ...
Disclaimer: My
RAMP both head and shoulders inverse and double bottomRAMP in the daily chart has shown a head and shoulders inverse pattern, and is now coming back down to also form a double bottom pattern. This together has created a situation for very strong long signal for RAMP once it reaches the $43.70 support line.
See all ideas
Summarizing what the indicators are suggesting.
Neutral
Neutral
Neutral
An aggregate view of professional's ratings.
Neutral
Neutral
Neutral
Displays a symbol's price movements over previous years to identify recurring trends.
Frequently asked questions
The current price of XIM is 33.20 EUR — it has increased by 0.61% in the past 24 hours. Watch LiveRamp Holdings, Inc. stock price performance more closely on the chart.
Depending on the exchange, the stock ticker may vary. For instance, on GETTEX exchange LiveRamp Holdings, Inc. stocks are traded under the ticker XIM.
XIM stock has risen by 1.22% compared to the previous week, the month change is a 2.47% rise, over the last year LiveRamp Holdings, Inc. has showed a 38.33% increase.
We've gathered analysts' opinions on LiveRamp Holdings, Inc. future price: according to them, XIM price has a max estimate of 33.15 EUR and a min estimate of 33.15 EUR. Watch XIM chart and read a more detailed LiveRamp Holdings, Inc. stock forecast: see what analysts think of LiveRamp Holdings, Inc. and suggest that you do with its stocks.
XIM stock is 0.00% volatile and has beta coefficient of 0.61. Track LiveRamp Holdings, Inc. stock price on the chart and check out the list of the most volatile stocks — is LiveRamp Holdings, Inc. there?
Today LiveRamp Holdings, Inc. has the market capitalization of 2.02 B, it has increased by 0.91% over the last week.
Yes, you can track LiveRamp Holdings, Inc. financials in yearly and quarterly reports right on TradingView.
LiveRamp Holdings, Inc. is going to release the next earnings report on Nov 11, 2026. Keep track of upcoming events with our Earnings Calendar.
XIM earnings for the last quarter are 0.57 EUR per share, whereas the estimation was 0.51 EUR resulting in a 12.07% surprise. The estimated earnings for the next quarter are 0.67 EUR per share. See more details about LiveRamp Holdings, Inc. earnings.
LiveRamp Holdings, Inc. revenue for the last quarter amounts to 187.38 M EUR, despite the estimated figure of 185.15 M EUR. In the next quarter, revenue is expected to reach 193.17 M EUR.
XIM net income for the last quarter is 15.34 M EUR, while the quarter before that showed 60.36 M EUR of net income which accounts for 0.00% change. Track more LiveRamp Holdings, Inc. financial stats to get the full picture.
No, XIM doesn't pay any dividends to its shareholders. But don't worry, we've prepared a list of high-dividend stocks for you.
As of Sep 30, 2026, the company has 1.3 K employees. See our rating of the largest employees — is LiveRamp Holdings, Inc. on this list?
EBITDA measures a company's operating performance, its growth signifies an improvement in the efficiency of a company. LiveRamp Holdings, Inc. EBITDA is 105.84 M EUR, and current EBITDA margin is 12.53%. See more stats in LiveRamp Holdings, Inc. financial statements.
Like other stocks, XIM shares are traded on stock exchanges, e.g. Nasdaq, Nyse, Euronext, and the easiest way to buy them is through an online stock broker. To do this, you need to open an account and follow a broker's procedures, then start trading. You can trade LiveRamp Holdings, Inc. stock right from TradingView charts — choose your broker and connect to your account.
Investing in stocks requires a comprehensive research: you should carefully study all the available data, e.g. company's financials, related news, and its technical analysis. So LiveRamp Holdings, Inc. technincal analysis shows the strong buy rating today, and its 1 week rating is buy. Since market conditions are prone to changes, it's worth looking a bit further into the future — according to the 1 month rating LiveRamp Holdings, Inc. stock shows the buy signal. See more of LiveRamp Holdings, Inc. technicals for a more comprehensive analysis.