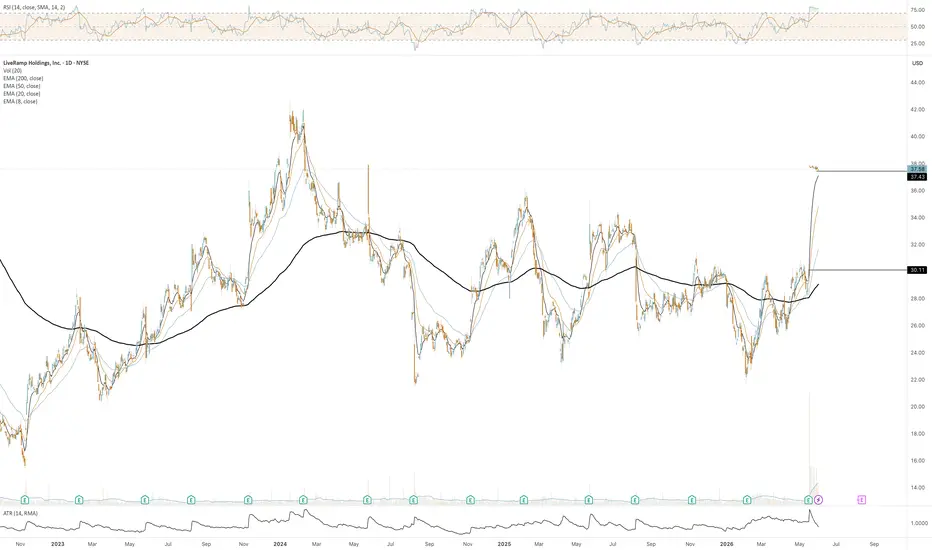
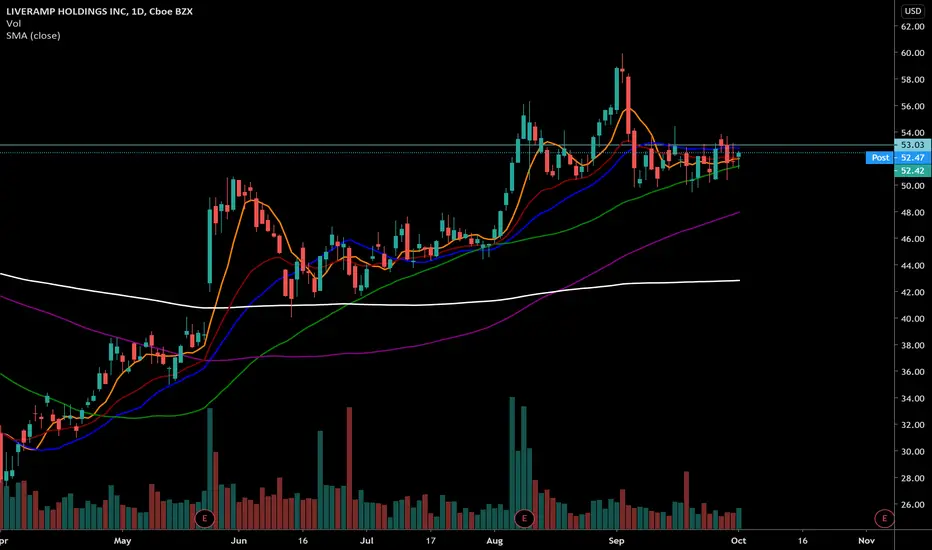
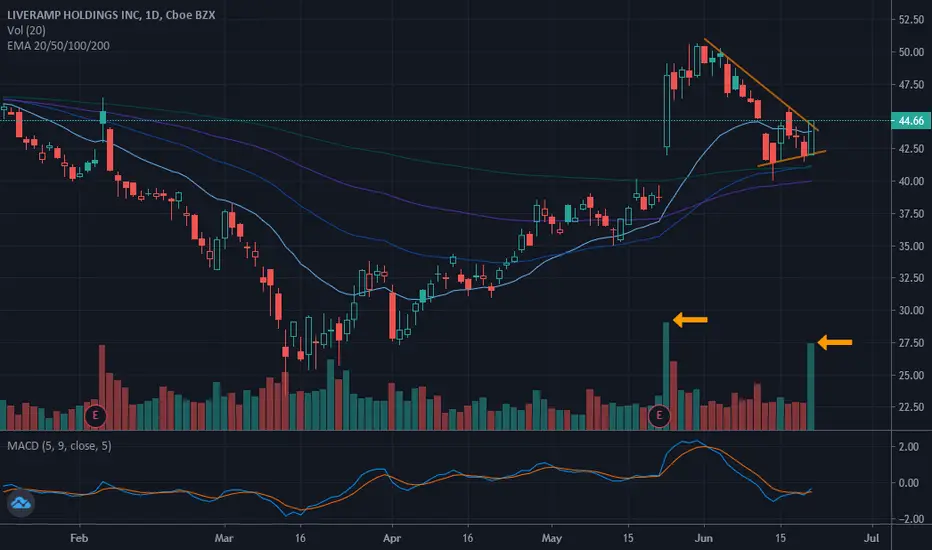
RAMP 10.0 A+ PEG SetupRAMP gapped up 27.4% on earnings and is now consolidating the move instead of giving it back — textbook PEG continuation. Holding above all 3 EMAs, tightening up over the last 10 sessions. Continuation targets $42.85, stop under $37.06.
#earningsgap #PEG #continuation #momentum
LiveRamp Holdings, Inc.
No trades
No trades
In-depth trading ideas
Beyond Basic Candlestick Pattern AnalysisLearning to Recognize Who Is Controlling the Stock Price
There is a plethora of training on Candlestick Pattern Analysis and interpretation, and yet this remains one of the most problematic areas for Technical Traders who want to trade at the expert level.
Once the basics of Japanese Candlestick Patterns are understood, it is time to move up to the next tier of analysis. That is being able to recognize not only where a pattern is, but also who forms that pattern, why they are capable of creat
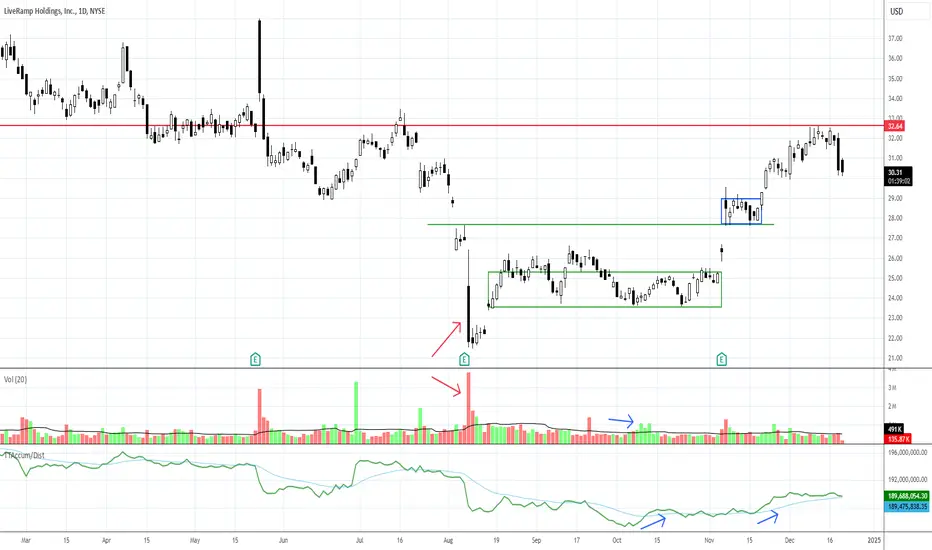
$RAMP with a PEG Consolidation.NYSE:RAMP may well ramp up here. They had nice earnings beat with a Power Earnings Gap (PEG) and now some nice consolidation. I have placed an alert just over yesterday’s high. Should it trigger, I will look to a lower timeframe for a good risk reward entry. I like these kinds of set-ups as the risk can be clearly defined. So, if the trade does not workout I will get stopped out for a small loss.
From LiveRamp’s website: LiveRamp aspires to make it safe
and easy for companies to use data effec
November Gainers (RAMP, account up 1%)5th gainer in November is NYSE:RAMP . Holding period is 1 day (11/9/22-11/10/22). Account up 1%.
This month till today, my account is up 4%, average holding period is 13 days.
My trading method is mostly short term and is independent of market swings.
Will keep updating on my trades.
$RAMP time to Short / Stay away?Looking at the green trend line starting from around mid 2014, till 2025 ish .
The trend line suggested price target of 47$ by 2024 already seems priced-in during today's date (Feb 9, 2022)'s after-hours session!
Additionally, there's that giant Inverted Cup and Handle pattern. Ignore the covid-19 crash of March 2020, and two red lines clearly indicate necklines.
First Neckline around 44$, and the 2nd one around 39$.
I wouldn't be interested in shorting, as:
1) I'm unaware on fundamentals pict
RAMP | ForecastJournal Entry
Bias: Positive.
Sentiment: Optimistic.
Emoji (emotion): Kindled 🔥.
Null Hypothesis: Buy.
Alternative Hypothesis: Sell.
Signals: %B oversold, Bollinger Bands oversold.
Position: Short term day trade.
Notes: They surprised earnings estimates last week.
Other: ...
Disclaimer: My journal entry is not a complete prospectus, please consider it accordingly.
Social: I'm happy to hear from my readers/audience and I encourage constructive feedback; although I'm busy I will give my
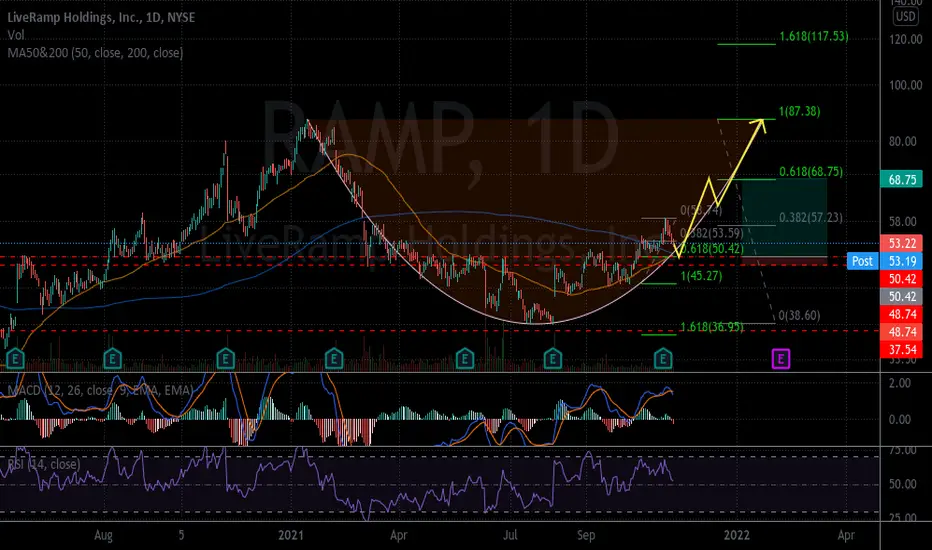
RAMP both head and shoulders inverse and double bottomRAMP in the daily chart has shown a head and shoulders inverse pattern, and is now coming back down to also form a double bottom pattern. This together has created a situation for very strong long signal for RAMP once it reaches the $43.70 support line.
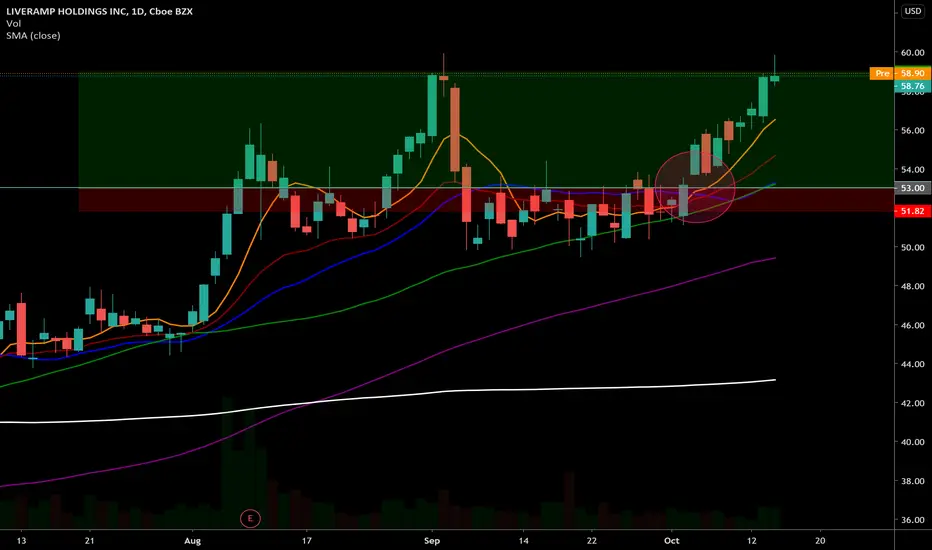
RAMP - Short term upsidePotential upside momentum for NYSE:RAMP
This trade came on my radar with all the indicators align with my criteria for an entry.
However, we do have to take note of the recent sell-off that happened last week. Hence, I will monitor this trade closely with a trailing stoploss.
In recent, "Technology" sector & "Information Technology" industry has been bullish. But with the added effect of COVID vaccine early trial success, I do believe this stock will still have some room for the bull in t
LiveRamp Holdings - $RAMP Hi this is my first post. I'm relatively new to Trading even newer to doing this T/A.
I welcome your comments / feedback as to how I can make this a better chart. I do not hold a position with this stock, when trading at $63 / share a friend had recommend I buy this a few weeks ago. Unfortunately I didn't have capital available to buy.
I am also posting this, in hopes that those who are new to TV and trading can get a more 'basics' idea as to what / how to do a chart for T/A!
Thx
LIVERAMP HOLDINGS Chart Hey guys, LIVERAMP HOLDINGS is in a fake bearish movement with a hammer bear candle and a high volume of wind early in the session. The TIMEFRAME M1 shows a marubozu bullish which is about to break its consolidation zone to go into the one above. There is a strong potential to reach the next high in this one see (See TIMEFRAME M1) then make a new high. And if buyers push we can still breakout the cosolidation zone to test the symbolic figure of 80.00.
Please LIKE & FOLLOW, thank you!
Bullish2019 collapse has fully retraced the collapse and been a 7 months rally. We note that momentum is building up for this share. Hence, Bullish move could be build up until 2022 for this cycle. Our price projection is at 90. Exit just below psychological resistance at 50.
Disclaimer the content on this analysis is subject to change at any time without notice, and is provided for the sole purpose of assisting traders to make independent investment decisions.
$RAMP Morgan Stanley initiates LiveRamp at OverweightAnalyst Stan Zlotsky set a price target of $64 a share for the San Francisco company, writing in a note to investors that "LiveRamp's unique software allows marketers to more effectively utilize data and deliver people-based campaigns across devices and channels, while improving marketing dollar return on investment."
"The key to this capability is LiveRamp's IdentityLink software that converts a customer's list of people (customers or prospects) into unique LiveRamp identifiers, removing all re