
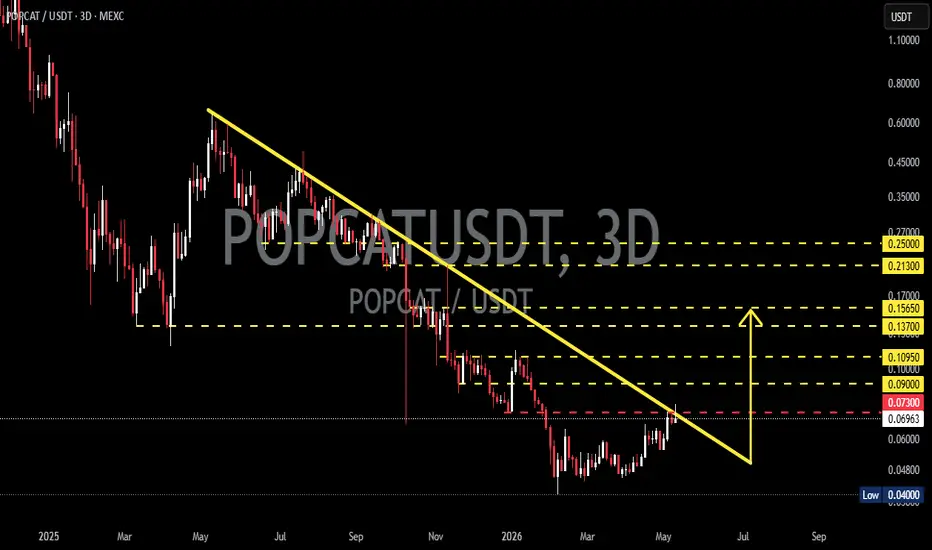
On this 3D timeframe chart, POPCAT appears to be recovering after experiencing a long-term downtrend from its previous peak levels. 📉➡️📈
Interestingly, price is now approaching a major descending trendline resistance that has been suppressing bullish momentum for several months. ⚠️🟡
This yellow descending trendline is the key level that could determine the next major market direction. If a breakout happens with strong volume confirmation, the potential for a medium-to-long-term trend reversal becomes significantly stronger. 🚀🔥
In addition, price has started forming a higher low structure near the bottom area, signaling that selling pressure is gradually weakening while buyers slowly regain market control. 🐂📈
━━━━━━━━━━━━━━━
📌 Pattern Formation
🔻 Descending Resistance / Falling Trendline
For months, price has continuously traded below a descending resistance line. This type of structure often signals an accumulation phase before a major breakout move occurs. 📊⚡
📍 Key Characteristics on This Chart:
✅ Continuous lower highs
✅ Bearish pressure gradually weakening
✅ Price stabilizing around the bottom zone
✅ Recovery momentum beginning to build
If the trendline resistance gets broken successfully, this structure could evolve into a:
🚀 Bullish Trend Reversal Structure
━━━━━━━━━━━━━━━
🟢 Bullish Scenario
✅ Main Bullish Confirmation
The bullish setup becomes more valid if the 3D candle can:
📌 Break above the yellow trendline
📌 Close strongly above the 0.07300 level
📌 Show increasing trading volume 🔥
If the breakout succeeds, the next bullish targets could potentially be:
🎯 Bullish Targets:
🚀 0.09000
🚀 0.10950
🚀 0.13700
🚀 0.15650
🚀 0.21300
🚀 0.25000 🔥🔥🔥
The 0.15650 area is an important resistance zone because it previously acted as a strong supply area that rejected price movement. ⚠️
If the overall crypto market momentum remains supportive, POPCAT could experience an impulsive rally toward higher psychological levels. 🌕🚀
━━━━━━━━━━━━━━━
🔴 Bearish Scenario
The bearish outlook remains valid if price fails to break the descending trendline resistance and gets rejected again. ❌📉
⚠️ Bearish Signals:
🔻 Strong rejection near the trendline resistance
🔻 Weak breakout volume
🔻 Candle closes back below 0.06900
If that happens, price could potentially revisit lower support areas:
🎯 Bearish Targets:
📉 0.06000
📉 0.04800
📉 0.04000 (major support zone) ⚠️
The 0.04000 level is currently a very important low area and acts as the last major defense for buyers. If this level breaks, the long-term downtrend could continue further. 🐻
━━━━━━━━━━━━━━━
📈 Conclusion
POPCAT is currently sitting at a very critical decision zone. ⚡
The chart shows early signs of a possible reversal after a prolonged downtrend, but the main confirmation still depends on a successful breakout above the descending resistance trendline. 👀📊
As long as price remains above support and volume continues increasing, the probability of a bullish continuation becomes much stronger. 🚀
However, traders should remain cautious of potential fake breakouts because the current resistance area is still a significant supply zone. ⚠️📉
This chart will be extremely interesting to watch over the next few 3D candles, as it could mark the beginning of a major trend reversal. 🔥🌕
━━━━━━━━━━━━━━━
#POPCAT #POPCATUSDT #Crypto 🚀 #Cryptocurrency #TechnicalAnalysis 📊 #Altcoin #MemeCoin 🐱 #Bullish #Breakout #CryptoTrading #PriceAction #SupportResistance #Trendline #Altseason
Interestingly, price is now approaching a major descending trendline resistance that has been suppressing bullish momentum for several months. ⚠️🟡
This yellow descending trendline is the key level that could determine the next major market direction. If a breakout happens with strong volume confirmation, the potential for a medium-to-long-term trend reversal becomes significantly stronger. 🚀🔥
In addition, price has started forming a higher low structure near the bottom area, signaling that selling pressure is gradually weakening while buyers slowly regain market control. 🐂📈
━━━━━━━━━━━━━━━
📌 Pattern Formation
🔻 Descending Resistance / Falling Trendline
For months, price has continuously traded below a descending resistance line. This type of structure often signals an accumulation phase before a major breakout move occurs. 📊⚡
📍 Key Characteristics on This Chart:
✅ Continuous lower highs
✅ Bearish pressure gradually weakening
✅ Price stabilizing around the bottom zone
✅ Recovery momentum beginning to build
If the trendline resistance gets broken successfully, this structure could evolve into a:
🚀 Bullish Trend Reversal Structure
━━━━━━━━━━━━━━━
🟢 Bullish Scenario
✅ Main Bullish Confirmation
The bullish setup becomes more valid if the 3D candle can:
📌 Break above the yellow trendline
📌 Close strongly above the 0.07300 level
📌 Show increasing trading volume 🔥
If the breakout succeeds, the next bullish targets could potentially be:
🎯 Bullish Targets:
🚀 0.09000
🚀 0.10950
🚀 0.13700
🚀 0.15650
🚀 0.21300
🚀 0.25000 🔥🔥🔥
The 0.15650 area is an important resistance zone because it previously acted as a strong supply area that rejected price movement. ⚠️
If the overall crypto market momentum remains supportive, POPCAT could experience an impulsive rally toward higher psychological levels. 🌕🚀
━━━━━━━━━━━━━━━
🔴 Bearish Scenario
The bearish outlook remains valid if price fails to break the descending trendline resistance and gets rejected again. ❌📉
⚠️ Bearish Signals:
🔻 Strong rejection near the trendline resistance
🔻 Weak breakout volume
🔻 Candle closes back below 0.06900
If that happens, price could potentially revisit lower support areas:
🎯 Bearish Targets:
📉 0.06000
📉 0.04800
📉 0.04000 (major support zone) ⚠️
The 0.04000 level is currently a very important low area and acts as the last major defense for buyers. If this level breaks, the long-term downtrend could continue further. 🐻
━━━━━━━━━━━━━━━
📈 Conclusion
POPCAT is currently sitting at a very critical decision zone. ⚡
The chart shows early signs of a possible reversal after a prolonged downtrend, but the main confirmation still depends on a successful breakout above the descending resistance trendline. 👀📊
As long as price remains above support and volume continues increasing, the probability of a bullish continuation becomes much stronger. 🚀
However, traders should remain cautious of potential fake breakouts because the current resistance area is still a significant supply zone. ⚠️📉
This chart will be extremely interesting to watch over the next few 3D candles, as it could mark the beginning of a major trend reversal. 🔥🌕
━━━━━━━━━━━━━━━
#POPCAT #POPCATUSDT #Crypto 🚀 #Cryptocurrency #TechnicalAnalysis 📊 #Altcoin #MemeCoin 🐱 #Bullish #Breakout #CryptoTrading #PriceAction #SupportResistance #Trendline #Altseason

✅ Get Free Signals! Join Our Telegram Channel Here: t.me/TheCryptoNuclear
✅ Twitter: twitter.com/crypto_nuclear
✅ Join Bybit : partner.bybit.com/b/nuclearvip
✅ Benefits : Lifetime Trading Fee Discount -50%
✅ Twitter: twitter.com/crypto_nuclear
✅ Join Bybit : partner.bybit.com/b/nuclearvip
✅ Benefits : Lifetime Trading Fee Discount -50%
Pernyataan Penyangkalan
Informasi dan publikasi ini tidak dimaksudkan, dan bukan merupakan, saran atau rekomendasi keuangan, investasi, trading, atau jenis lainnya yang diberikan atau didukung oleh TradingView. Baca selengkapnya di Ketentuan Penggunaan.
✅ Get Free Signals! Join Our Telegram Channel Here: t.me/TheCryptoNuclear
✅ Twitter: twitter.com/crypto_nuclear
✅ Join Bybit : partner.bybit.com/b/nuclearvip
✅ Benefits : Lifetime Trading Fee Discount -50%
✅ Twitter: twitter.com/crypto_nuclear
✅ Join Bybit : partner.bybit.com/b/nuclearvip
✅ Benefits : Lifetime Trading Fee Discount -50%
Pernyataan Penyangkalan
Informasi dan publikasi ini tidak dimaksudkan, dan bukan merupakan, saran atau rekomendasi keuangan, investasi, trading, atau jenis lainnya yang diberikan atau didukung oleh TradingView. Baca selengkapnya di Ketentuan Penggunaan.